[Preprint]. 2024 Feb 28:2024.02.26.582092.
doi: 10.1101/2024.02.26.582092.

HB-EGF and EGF infusion following CNS demyelination mitigates age-related decline in regeneration of oligodendrocytes from neural precursor cells originating in the ventricular-subventricular zone

Affiliations

HB-EGF and EGF infusion following CNS demyelination mitigates age-related decline in regeneration of oligodendrocytes from neural precursor cells originating in the ventricular-subventricular zone

Kaveh Moradi et al. bioRxiv. .

Abstract

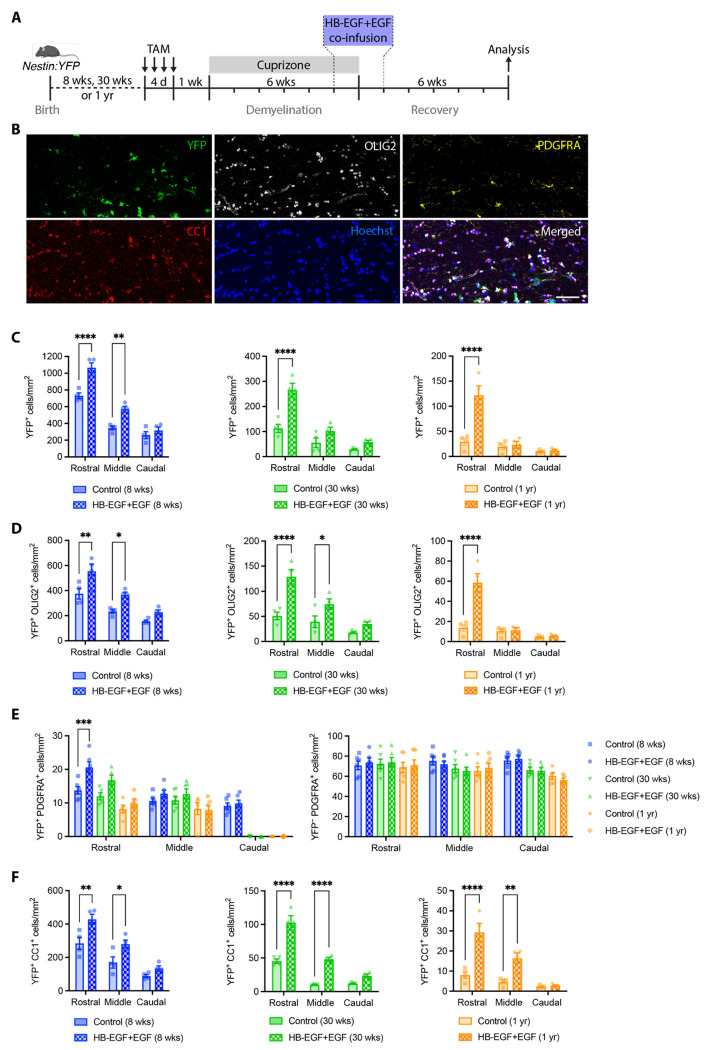
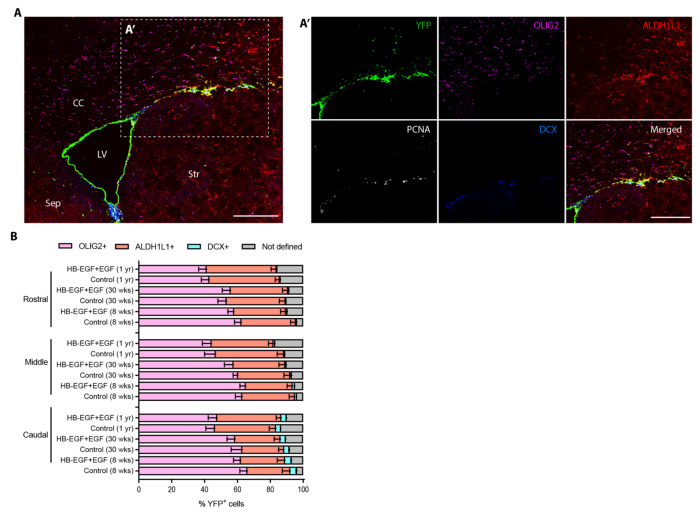
In multiple sclerosis (MS), chronic demyelination initiated by immune-mediated destruction of myelin, leads to axonal damage and neuronal cell death, resulting in a progressive decline in neurological function. The development of interventions that potentiate remyelination could hold promise as a novel treatment strategy for MS. To this end, our group has demonstrated that neural precursor cells (NPCs) residing in the ventricular-subventricular zone (V-SVZ) of the adult mouse brain contribute significantly to remyelination in response to central nervous system (CNS) demyelination and can regenerate myelin of normal thickness. However, aging takes its toll on the regenerative potential of NPCs and reduces their contribution to remyelination. In this study, we investigated how aging influences the contribution of NPCs to oligodendrogenesis during the remyelination process and whether the delivery of growth factors into the brains of aged mice could potentiate the oligodendrogenic potential of NPCs. To enable us to map the fate of NPCs in response to demyelination induced at different postnatal ages, Nestin-CreERT2;Rosa26-LSL-eYFP mice were gavaged with tamoxifen at either 8 weeks, 30 weeks or one year of age before being challenged with cuprizone for a period of six weeks. Using osmotic minipumps, we infused heparin-binding EGF-like growth factor (HB-EGF), and/or epidermal growth factor (EGF) into the cisterna magna for a period of two weeks beginning at the peak of cuprizone-induced demyelination (n=6-8 mice per group). Control mice received artificial cerebrospinal fluid (vehicle) alone. Mice were perfused six weeks after cuprizone withdrawal and the contribution of NPCs to oligodendrocyte regeneration in the corpus callosum was assessed. Our data reveal that although NPC-derived oligodendrocyte generation declined dramatically with age, this decline was partially reversed by growth factor infusion. Notably, co-infusion of EGF and HB-EGF increased oligodendrocyte regeneration twofold in some regions of the corpus callosum. Our results shed light on the beneficial effects of EGF and HB-EGF for increasing the contribution of NPCs to remyelination and indicate their therapeutic potential to combat the negative effects of aging upon remyelination efficacy.


Conflict of interest statement

Conflict of Interest: The authors declare no competing financial interests.

Figures

Figure 1.
Figure 1.
The efficiency of Cre-mediated recombination among dividing NPCs within subdomains of the V-SVZ of Nestin:YFP mice was similar across postnatal age. A, Confocal micrograph of the dorsolateral corner of the lateral ventricle of a 30-week-old Nestin:YFP mouse assessed 1 week after tamoxifen administration reveals abundant YFP+ PCNA+ cells (recombined mitotic NPCs) and a small number of YFP PCNA+ cells (non-recombined mitotic NPCs). B, Examples of YFP+ PCNA+ and YFP PCNA+ cells in the V-SVZ of a tamoxifen-gavaged Nestin:YFP mouse observed at high magnification. C, Coronal micrograph of the V-SVZ of the rostral forebrain. Demarcated areas show the five subdomains in which Cre recombination efficacy was assessed, namely the dorsolateral corner, lateral wall, ventral wall, medial wall, and dorsal wall of the lateral ventricles. The section was immunolabeled against GFAP and counterstained with Hoechst. D, Efficiency of Cre-mediated recombination among NPCs in the four regions of the V-SVZ where PCNA+ cells observed was estimated by determining the %YFP+ PCNA+ cells among total PCNA+ cells within each region. Data were analyzed by two-way ANOVA with Bonferroni’s post hoc test, n=6 mice/group. Data represent mean ± SEM. Scale bars: 100 μm (A), 5 μm (B), 200 μm (C). CC, corpus callosum; LV, lateral ventricle; Sep, septum; Str, striatum; V-SVZ, ventricular-subventricular zone.
Figure 2.
Figure 2.
Aging dramatically reduced the extent to which NPCs contributed to oligodendrogenesis in the corpus callosum following cuprizone-induced demyelination. A, Experimental timeline for Nestin:YFP mice indicating time points for tamoxifen gavage, cuprizone challenge and tissue collection. B, Confocal micrograph of a coronal brain section from a Nestin:YFP mouse administered tamoxifen at 30 weeks of age then fed cuprizone for 6 weeks and perfused at 6 weeks recovery post cuprizone withdrawal. Immunohistochemistry was performed to detect YFP (green), CC1 (red) and SOX10 (grey). Sections were counterstained with Hoechst. The dashed line delineates the region of the corpus callosum. B’, Representative high magnification micrograph of labeled cells in the corpus callosum. C, Schematic representation of a sagittal section of the adult mouse brain illustrating the rostral (R), middle (M), and caudal (C) segments of the corpus callosum that were examined (relates to plots in D and E). D,E, Histograms showing the mean density of total YFP+ cells (NPC fate-mapped cells, D) or YFP+ CC1+ cells (NPC-derived oligodendrocytes, E) detected in rostral, middle, and caudal segments of the corpus callosum of cuprizone-challenged Nestin:YFP mice as a function of postnatal age. Animals were gavaged with tamoxifen at either 8 weeks, 30 weeks, or 1 year of age, then fed cuprizone for 6 weeks and perfused at 6 weeks recovery post cuprizone withdrawal. F, Schematic representation of a coronal section of the adult mouse brain illustrating positive (+) and negative (−) positions along the mediolateral axis relative to the dorsolateral corner of the V-SVZ, which we designated as position zero (0 μm) (relates to plots shown in G). G, Mean density of YFP+ CC1+ cells (NPC-derived oligodendrocytes) distributed along the mediolateral axis of the corpus callosum assessed at rostral, middle and caudal levels of the forebrain of Nestin:YFP mice as a function of postnatal age. Animals were gavaged with tamoxifen at either 8 weeks, 30 weeks, or 1 year of age, then fed cuprizone for 6 weeks and perfused at 6 weeks recovery post cuprizone withdrawal. Cell counts were performed for n=4-5 mice/group. Data represent mean ± SEM. Data were analyzed by two-way ANOVA with Tukey’s multiple comparisons test: **p<0.01, ****p<0.0001. Scale bar: 200 μm (B). CC, corpus callosum; Ctx, cerebral cortex; LV, lateral ventricle; Sep, septum; Str, striatum.
Figure 3.
Figure 3.
Intracisternal infusion of EGF or HB-EGF into the CSF of mice aged 30 weeks increased the density of NPC-derived cells in the corpus callosum assessed at 6 weeks recovery. A, Experimental timeline for Nestin:YFP mice indicating time points for tamoxifen gavage, cuprizone challenge, growth factors infusion and tissue collection. B, Confocal micrographs of coronal brain sections from 30-week-old Nestin:YFP mice assessed at 6 weeks recovery after cuprizone withdrawal. Images show YFP-expressing NPCs that have migrated from V-SVZ into the corpus callosum of mice infused with EGF, HB-EGF, HB-EGF+EGF, or vehicle control. The dashed yellow line indicates the ventral border of the corpus callosum. C, Density of total YFP+ cells in the corpus callosum at 6 weeks recovery. D, Density of YFP+ SOX10+ cells in the corpus callosum at 6 weeks recovery. E, Density of YFP+ CC1+ cells in the corpus callosum at 6 weeks recovery. F, The relative contribution of NPCs to oligodendrogenesis in rostral, middle and caudal segments of the corpus callosum. G, Plots of the % of CC1+ cells that co-express YFP according to their position along the mediolateral axis of the corpus callosum, where the dorsolateral corner of the V-SVZ is taken as 0 μm. Cell counts were performed for n=8 mice/group. Data represent mean ± SEM. Data were analyzed by two-way ANOVA with Tukey’s multiple comparisons tests: *p<0.05, **p<0.01, ***p<0.001, ****p<0.0001. Scale bar: 400 μm (B). CC, corpus callosum; Ctx, cerebral cortex; LV, lateral ventricle; Str, striatum.
Figure 4.
Figure 4.
Growth factor infusions did not alter measures of myelin density in the corpus callosum of 30-week-old Nestin:YFP mice assessed at 6 weeks recovery after cuprizone withdrawal. A, Spectral confocal reflectance (SCoRe) microscopy of the rostral corpus callosum in an HB-EGF+EGF-infused mouse and optical density (OD). B, Quantification of SCoRe signal intensity from photomicrographs of the corpus callosum of growth factor-infused or vehicle-infused controls. Data are presented as mean optical density (OD) for rostral, middle and caudal segments. C, Confocal micrograph of a coronal brain section of an HB-EGF+EGF-infused mouse assessed at 6 weeks recovery following immunohistochemical detection of PLP. D, Plot of optical density measures of PLP labeling in the rostral, middle and caudal segments of the corpus callosum of growth factor-infused or vehicle-infused controls. E, Confocal micrograph of a coronal brain section of an HB-EGF+EGF-infused mouse assessed at 6 weeks recovery following immunohistochemical detection of MBP. F, Plot of optical density measures of MBP labeling in the rostral, middle and caudal segments of the corpus callosum of growth factor-infused or vehicle-infused controls. Data represent mean ± SEM. Scale bar: 300 μm (A,C,E). CC, corpus callosum; Ctx, cerebral cortex; LV, lateral ventricles; Str, striatum.
Figure 5.
Figure 5.
Infusion of HB-EGF+EGF into the CSF after cuprizone challenge attenuated the age-related decline in NPC-mediated oligodendrocyte regeneration. A, Experimental timeline for Nestin:YFP mice indicating time points for tamoxifen gavage, cuprizone challenge, growth factors infusion and tissue collection. B, Example confocal micrograph of an area of the corpus callosum of an HB-EGF+EGF-infused Nestin:YFP mouse taken from the 8-week cohort. Immunohistochemistry was performed against YFP, OLIG2, PDGFRA, CC1, and Hoechst to label NPC-derived cells, oligodendroglia, OPCs, oligodendrocytes, and cell nuclei, respectively. C, Density of YFP+ cells (NPC-derived cells) in the corpus callosum of Nestin:YFP mice aged 8 weeks, 30 weeks or 1 year that were infused with HB-EGF+EGF or vehicle control and assessed at 6 weeks recovery. D, Density of YFP+ OLIG2+ cells in the corpus callosum at 6 weeks recovery following cuprizone withdrawal shows the abundance of NPC-derived cells that have committed to the oligodendroglial lineage. E, Density of YFP+ PDGFRA+ cells (NPC-derived OPCs) and YFP PDGFRA+ cells (pOPCs) in the corpus callosum of mice at 6 weeks recovery. F, Density of YFP+ CC1+ cells in the corpus callosum at 6 weeks recovery after cuprizone withdrawal reveals the distribution of NPC-derived oligodendrocytes in the rostral, middle and caudal segments for each age group. Data represent mean ± SEM. Data were analyzed by two-way ANOVA with Tukey’s multiple comparisons tests: *p<0.05, **p<0.01, ***p<0.001, ****p<0.0001. Scale bar: 50 μm (B).
Figure 6.
Figure 6.
Postnatal age and HB-EGF+EGF infusion did not alter total oligodendrocyte density or measures of myelin abundance in the corpus callosum of Nestin:YFP mice assessed at 6 weeks recovery after cuprizone withdrawal. A, Density of total CC1+ oligodendrocytes (YFP+ and YFP fractions combined) in the corpus callosum of Nestin:YFP mice at 6 weeks recovery. B, Optical density of compact myelin in the corpus callosum measured from photomicrographs captured by spectral confocal reflectance microscopy. C,D, Optical density measures of PLP (C) and MBP (D) fluorescence intensity in the corpus callosum of acquired confocal images. E, Density of CC1+ oligodendrocytes across the mediolateral axis of the corpus callosum for the 8-week, 30-week and 1-year cohorts. The distributions of total CC1+ cells (black lines), YFP+ CC1+ cells (green lines) and YFP CC1+ cells (blue lines) are plotted separately for both HB-EGF+EGF-infused (solid lines) and vehicle-infused Nestin:YFP controls (dashed lines). Data represent mean ± SEM.
Figure 7.
Figure 7.
HB-EGF+EGF infusion significantly increased the contribution of NPC-derived oligodendrocytes to the total oligodendrocytes present in the corpus callosum at 6 weeks recovery after cuprizone challenge. A, Plot of the % of total CC1+ cells that express YFP, indicating the % contribution of NPC-derived oligodendrocytes to the total oligodendrocyte population in the corpus callosum of Nestin:YFP mice assessed at 6 weeks recovery following cuprizone withdrawal. B, Plots of the % of total CC1+ cells that express YFP across the mediolateral axis of the corpus callosum for the 8-week, 30-week and 1-year cohorts for HB-EGF+EGF-infused (solid lines) and vehicle-infused Nestin:YFP controls (dashed lines). Data represent mean ± SEM. Data (A) were analyzed by two-way ANOVA with Sidak’s multiple comparisons test: *p<0.05, **p<0.01, ****p<0.0001.
Figure 8.
Figure 8.
Aging influenced the cell fate specification of NPC-derived cells during remyelination of the corpus callosum but lineage specification was not altered by infusion with HB-EGF+EGF. A, Representative confocal micrograph of a coronal brain section processed immunohistochemically to detect YFP, ALDH1L1, OLIG2, DCX and PCNA to label NPC-derived cells, astrocytes, oligodendroglia, neuroblasts and dividing cells, respectively. A’, High magnification of the dashed box shown in A. B, The % of NPC-derived cells in the corpus callosum of Nestin:YFP mice at 6 weeks recovery that expressed oligodendroglial (OLIG2+), astroglial (ALDH1L1+) or neuronal (DCX+) markers. YFP+ cells that did not express any of these markers were classified as ‘not defined’. Data represent mean ± SEM. Scale bar: 300 μm (A, A’). CC, corpus callosum; LV, lateral ventricle; Sep, septum; Str, striatum.
Figure 9.
Figure 9.
HB-EGF+EGF infusion increases the proliferation of NPCs and GFAP+ MCM2+ neural stem cells in the V-SVZ. A, Density of mitotic NPCs (PCNA+ cells) in the V-SVZ of Nestin:YFP mice at 6 weeks recovery after cuprizone withdrawal assessed across the rostocaudal axis for all age groups. B, Experimental timeline for Nestin:YFP mice indicating time points for tamoxifen gavage, cuprizone challenge, growth factor infusion, EdU injection and tissue collection. C, Representative confocal micrograph of a coronal brain section following immunohistochemistry to detect GFAP, MCM2, EdU and Hoechst. Labeling was performed to identify putative neural stem cells (NSCs) (GFAP+ MCM2+ cells) that passed through the S phase of the cell cycle within 2 hours after EdU injection. C, Absolute number of EDU+ GFAP+ MCM2+ cells (dividing NSCs) in the dorsolateral of the V-SVZ in rostral, middle and caudal segments. D, Absolute number of EDU GFAP+ MCM2+ cells (non-dividing NSCs) in the dorsolateral of the V-SVZ. Data represent mean ± SEM. Data were analyzed by two-way ANOVA with Sidak’s multiple comparisons test: *p<0.05, ***p<0.001, ****p<0.0001. Scale bar: 200 μm (C), 50 μm (C’). CC, corpus callosum; LV, lateral ventricle; Sep, septum; Str, striatum.

Similar articles

References

    1. Noseworthy J.H. (1999). Progress in determining the causes and treatment of multiple sclerosis. Nature 399, A40–47. 10.1038/399a040. - DOI - PubMed
    1. Liebetanz D., and Merkler D. (2006). Effects of commissural de- and remyelination on motor skill behaviour in the cuprizone mouse model of multiple sclerosis. Exp Neurol 202, 217–224. 10.1016/j.expneurol.2006.05.032. - DOI - PubMed
    1. Zawadzka M., Rivers L.E., Fancy S.P., Zhao C., Tripathi R., Jamen F., Young K., Goncharevich A., Pohl H., Rizzi M., et al. (2010). CNS-resident glial progenitor/stem cells produce Schwann cells as well as oligodendrocytes during repair of CNS demyelination. Cell Stem Cell 6, 578–590. 10.1016/j.stem.2010.04.002. - DOI - PMC - PubMed
    1. Xing Y.L., Roth P.T., Stratton J.A., Chuang B.H., Danne J., Ellis S.L., Ng S.W., Kilpatrick T.J., and Merson T.D. (2014). Adult neural precursor cells from the subventricular zone contribute significantly to oligodendrocyte regeneration and remyelination. J Neurosci 34, 14128–14146. 10.1523/JNEUROSCI.3491-13.2014. - DOI - PMC - PubMed
    1. Serwanski D.R., Rasmussen A.L., Brunquell C.B., Perkins S.S., and Nishiyama A. (2018). Sequential Contribution of Parenchymal and Neural Stem Cell-Derived Oligodendrocyte Precursor Cells toward Remyelination. Neuroglia 1, 91–105. 10.3390/neuroglia1010008. - DOI - PMC - PubMed

Publication types