. 2024 Mar 26:12:RP89376.
doi: 10.7554/eLife.89376.

Large-scale animal model study uncovers altered brain pH and lactate levels as a transdiagnostic endophenotype of neuropsychiatric disorders involving cognitive impairment

Hideo Hagihara  1 Hirotaka Shoji  1 Satoko Hattori  1 Giovanni Sala  1 Yoshihiro Takamiya  1 Mika Tanaka  1 Masafumi Ihara  2 Mihiro Shibutani  3 Izuho Hatada  3 Kei Hori  4 Mikio Hoshino  4 Akito Nakao  5 Yasuo Mori  5 Shigeo Okabe  6 Masayuki Matsushita  7 Anja Urbach  8 Yuta Katayama  9 Akinobu Matsumoto  9 Keiichi I Nakayama  9 Shota Katori  10 Takuya Sato  10 Takuji Iwasato  10 Haruko Nakamura  11 Yoshio Goshima  11 Matthieu Raveau  12 Tetsuya Tatsukawa  12 Kazuhiro Yamakawa  12   13 Noriko Takahashi  14   15 Haruo Kasai  14   16 Johji Inazawa  17 Ikuo Nobuhisa  18 Tetsushi Kagawa  18 Tetsuya Taga  18 Mohamed Darwish  19   20 Hirofumi Nishizono  21 Keizo Takao  20   22 Kiran Sapkota  23 Kazutoshi Nakazawa  23 Tsuyoshi Takagi  24 Haruki Fujisawa  25 Yoshihisa Sugimura  25 Kyosuke Yamanishi  26 Lakshmi Rajagopal  27 Nanette Deneen Hannah  27 Herbert Y Meltzer  27 Tohru Yamamoto  28 Shuji Wakatsuki  29 Toshiyuki Araki  29 Katsuhiko Tabuchi  30 Tadahiro Numakawa  31 Hiroshi Kunugi  31   32 Freesia L Huang  33 Atsuko Hayata-Takano  34   35   36 Hitoshi Hashimoto  34   36   37   38   39 Kota Tamada  40   41 Toru Takumi  40   41 Takaoki Kasahara  42   43 Tadafumi Kato  42   44 Isabella A Graef  45 Gerald R Crabtree  45 Nozomi Asaoka  46 Hikari Hatakama  47 Shuji Kaneko  47 Takao Kohno  48 Mitsuharu Hattori  48 Yoshio Hoshiba  49 Ryuhei Miyake  50 Kisho Obi-Nagata  50 Akiko Hayashi-Takagi  49   50 Léa J Becker  51 Ipek Yalcin  51 Yoko Hagino  52 Hiroko Kotajima-Murakami  52 Yuki Moriya  52 Kazutaka Ikeda  52 Hyopil Kim  53   54 Bong-Kiun Kaang  53   55 Hikari Otabi  56   57 Yuta Yoshida  56 Atsushi Toyoda  56   57   58 Noboru H Komiyama  59   60 Seth G N Grant  59   60 Michiru Ida-Eto  61 Masaaki Narita  61 Ken-Ichi Matsumoto  62 Emiko Okuda-Ashitaka  63 Iori Ohmori  64 Tadayuki Shimada  65 Kanato Yamagata  65 Hiroshi Ageta  66 Kunihiro Tsuchida  66 Kaoru Inokuchi  67   68   69 Takayuki Sassa  70 Akio Kihara  70 Motoaki Fukasawa  71 Nobuteru Usuda  71 Tayo Katano  72 Teruyuki Tanaka  73 Yoshihiro Yoshihara  74 Michihiro Igarashi  75   76 Takashi Hayashi  77 Kaori Ishikawa  78   79 Satoshi Yamamoto  80 Naoya Nishimura  80 Kazuto Nakada  78   79 Shinji Hirotsune  81 Kiyoshi Egawa  82 Kazuma Higashisaka  83 Yasuo Tsutsumi  83 Shoko Nishihara  84 Noriyuki Sugo  85 Takeshi Yagi  85 Naoto Ueno  86 Tomomi Yamamoto  87 Yoshihiro Kubo  87 Rie Ohashi  88   89   90 Nobuyuki Shiina  88   89   90 Kimiko Shimizu  91 Sayaka Higo-Yamamoto  92 Katsutaka Oishi  92   93   94   95 Hisashi Mori  96 Tamio Furuse  97 Masaru Tamura  97 Hisashi Shirakawa  47 Daiki X Sato  1   98 Yukiko U Inoue  4 Takayoshi Inoue  4 Yuriko Komine  99   100 Tetsuo Yamamori  100   101 Kenji Sakimura  102   103 Tsuyoshi Miyakawa  1
Affiliations

Large-scale animal model study uncovers altered brain pH and lactate levels as a transdiagnostic endophenotype of neuropsychiatric disorders involving cognitive impairment

Hideo Hagihara et al. Elife. .

Abstract

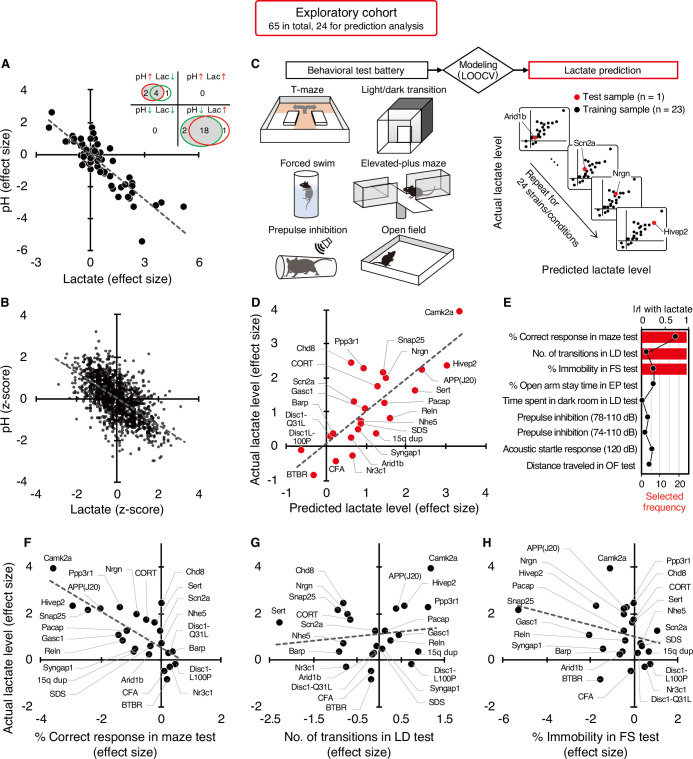
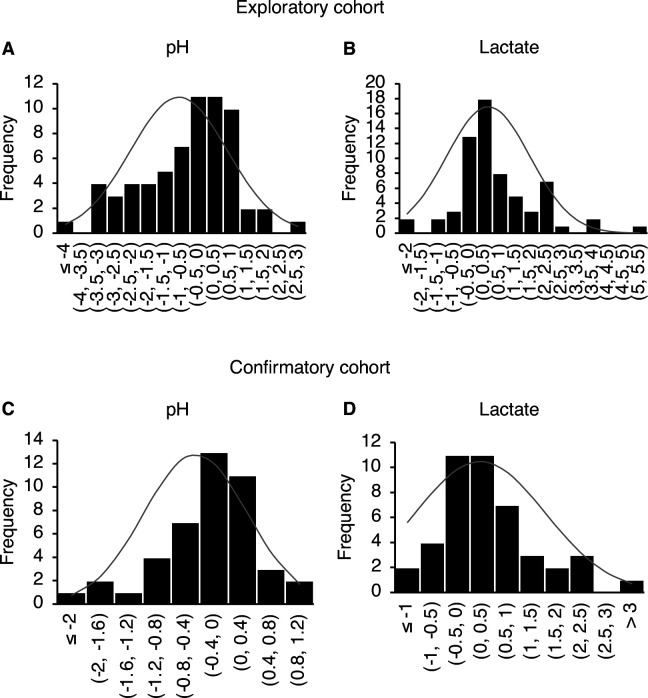
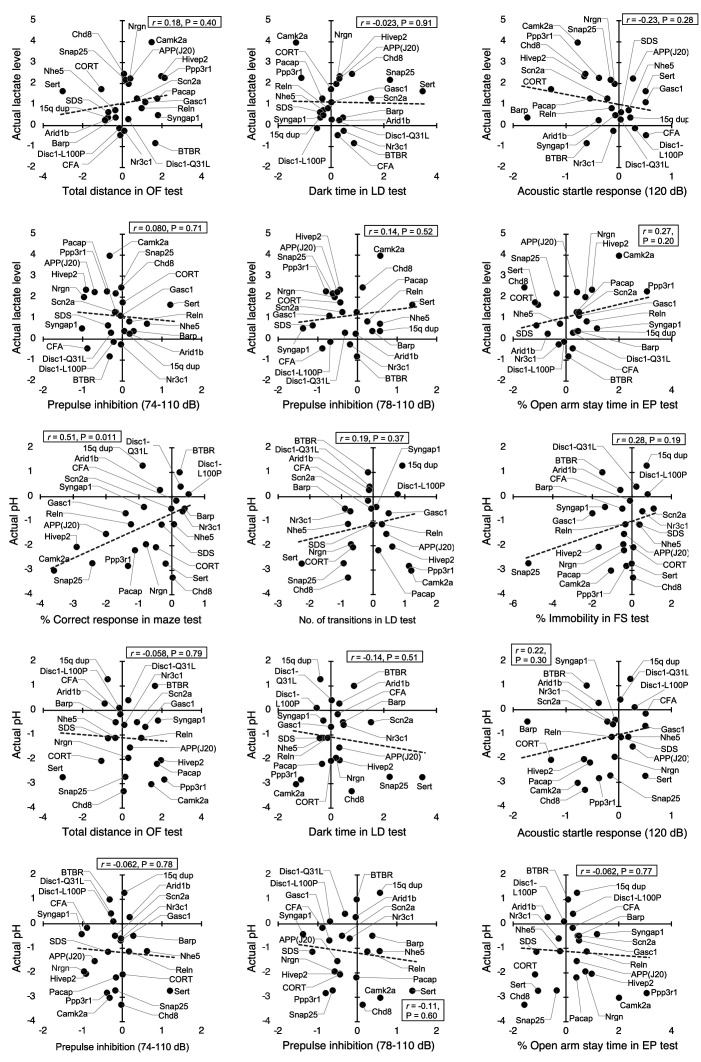
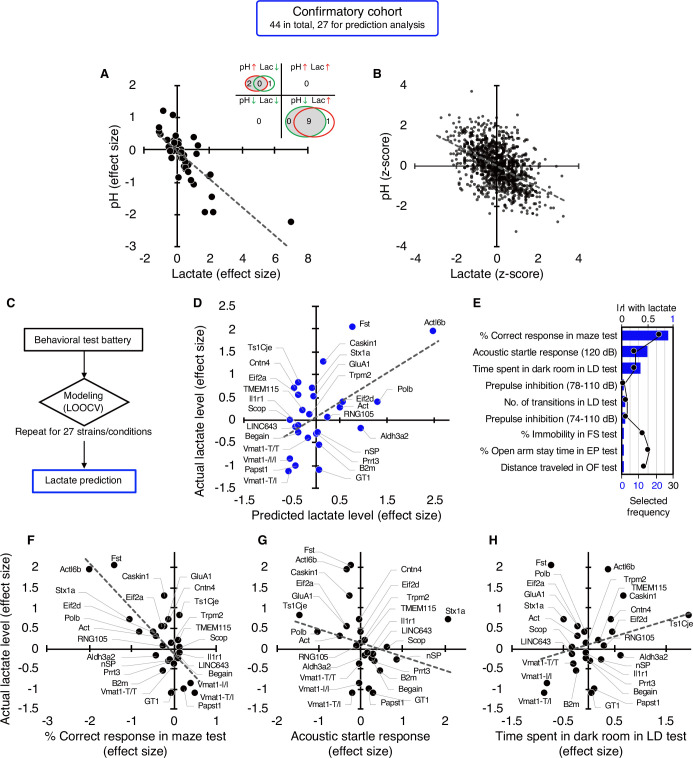
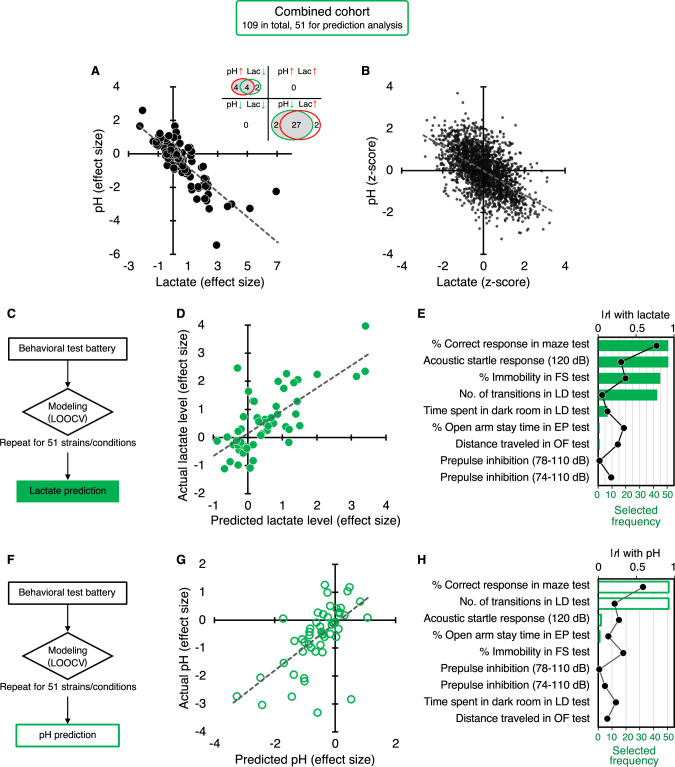
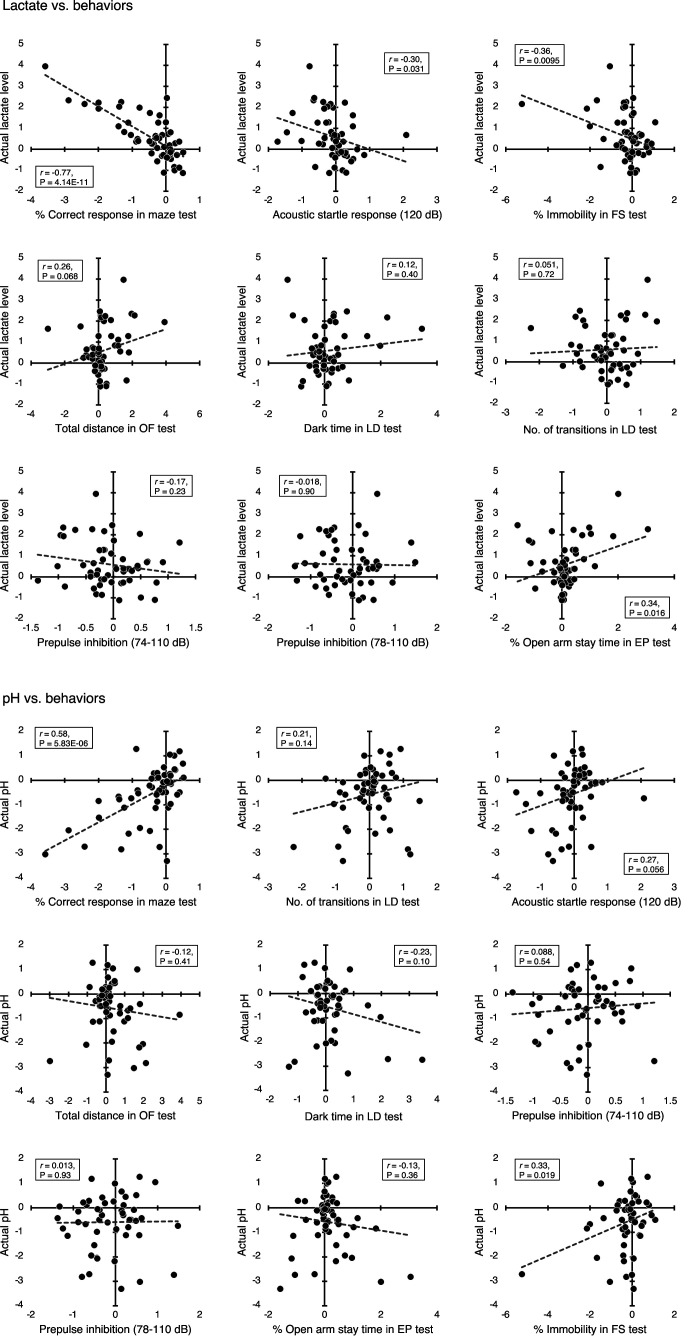
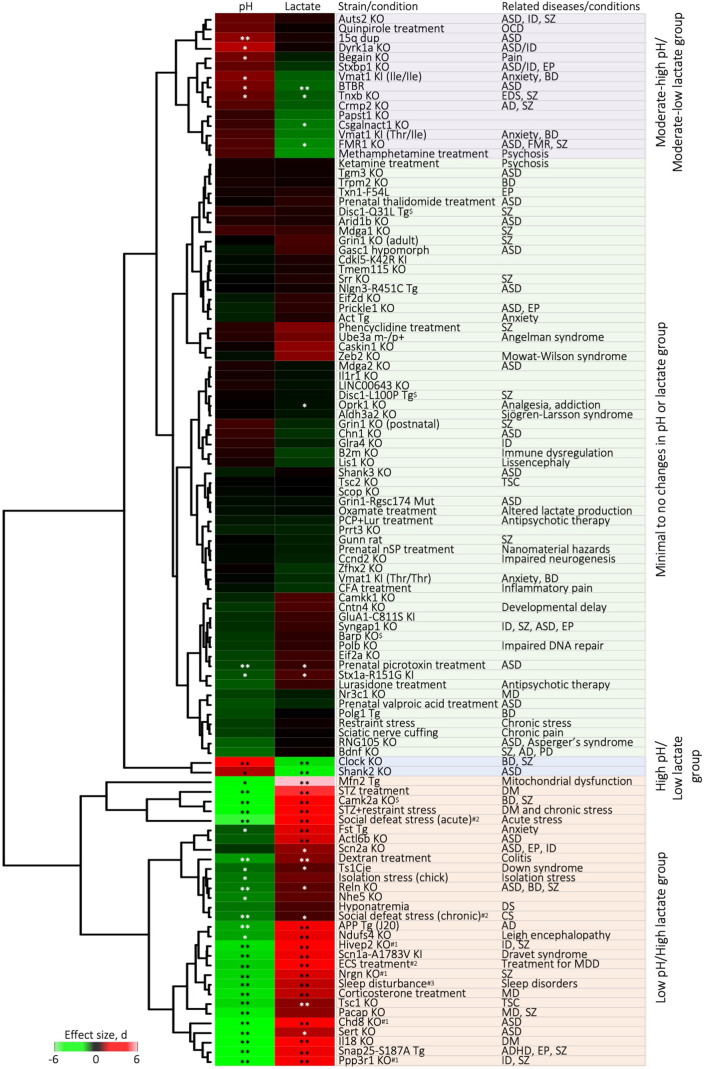
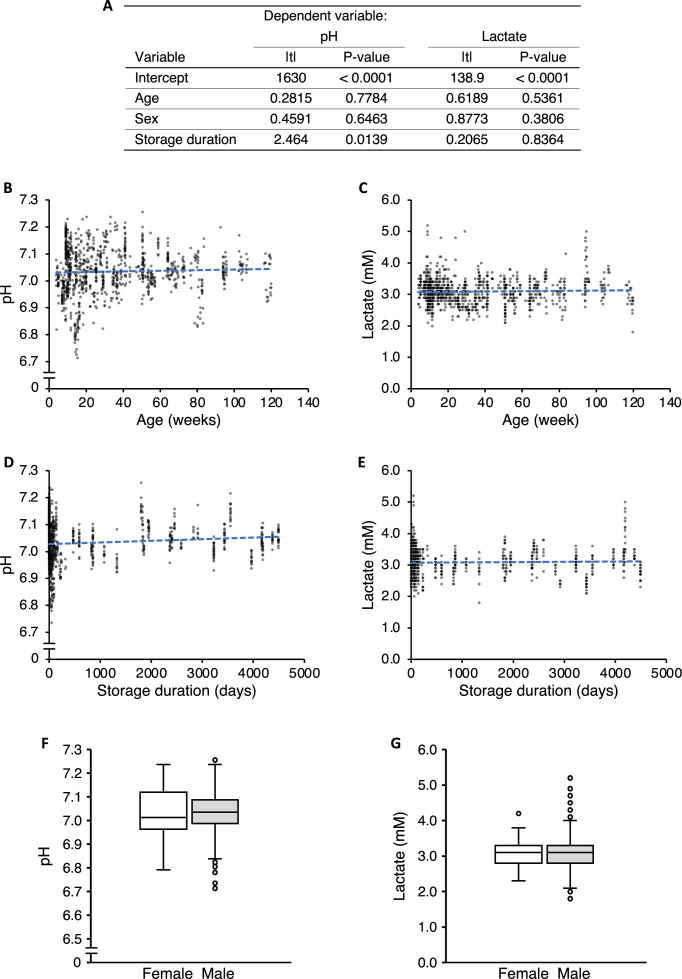
Increased levels of lactate, an end-product of glycolysis, have been proposed as a potential surrogate marker for metabolic changes during neuronal excitation. These changes in lactate levels can result in decreased brain pH, which has been implicated in patients with various neuropsychiatric disorders. We previously demonstrated that such alterations are commonly observed in five mouse models of schizophrenia, bipolar disorder, and autism, suggesting a shared endophenotype among these disorders rather than mere artifacts due to medications or agonal state. However, there is still limited research on this phenomenon in animal models, leaving its generality across other disease animal models uncertain. Moreover, the association between changes in brain lactate levels and specific behavioral abnormalities remains unclear. To address these gaps, the International Brain pH Project Consortium investigated brain pH and lactate levels in 109 strains/conditions of 2294 animals with genetic and other experimental manipulations relevant to neuropsychiatric disorders. Systematic analysis revealed that decreased brain pH and increased lactate levels were common features observed in multiple models of depression, epilepsy, Alzheimer's disease, and some additional schizophrenia models. While certain autism models also exhibited decreased pH and increased lactate levels, others showed the opposite pattern, potentially reflecting subpopulations within the autism spectrum. Furthermore, utilizing large-scale behavioral test battery, a multivariate cross-validated prediction analysis demonstrated that poor working memory performance was predominantly associated with increased brain lactate levels. Importantly, this association was confirmed in an independent cohort of animal models. Collectively, these findings suggest that altered brain pH and lactate levels, which could be attributed to dysregulated excitation/inhibition balance, may serve as transdiagnostic endophenotypes of debilitating neuropsychiatric disorders characterized by cognitive impairment, irrespective of their beneficial or detrimental nature.

Keywords: animal models; brain pH; chicken; lactate; metabolism; mouse; neuropsychiatric disorders; neuroscience; rat; working memory.


Conflict of interest statement

HH, HS, SH, GS, YT, MT, MI, MS, IH, KH, MH, AN, YM, SO, MM, AU, YK, AM, KN, SK, TS, TI, HN, YG, MR, TT, KY, NT, HK, JI, IN, TK, TT, MD, HN, KT, KS, KN, TT, HF, YS, KY, LR, NH, HM, TY, SW, TA, KT, TN, HK, FH, AH, HH, KT, TT, TK, TK, IG, GC, NA, HH, SK, TK, MH, YH, RM, KO, AH, LB, IY, YH, HK, YM, KI, HK, BK, HO, YY, AT, NK, SG, MI, MN, KM, EO, IO, TS, KY, HA, KT, KI, TS, AK, MF, NU, TK, TT, YY, MI, TH, KI, KN, SH, KE, KH, YT, SN, NS, TY, NU, TY, YK, RO, NS, KS, SH, KO, HM, TF, MT, HS, DS, YI, TI, YK, TY, KS, TM No competing interests declared, SY, NN Employee of Takeda Pharmaceutical Company, Ltd

Figures

Figure 1.
Figure 1.. Increased brain lactate levels correlated with decreased pH are associated with poor working memory.
(A) Venn diagrams show the number of strains/conditions of animal models with significant changes (P<0.05 compared with the corresponding controls) in brain pH and lactate levels in an exploratory cohort. Scatter plot shows the effect size-based correlations between pH and lactate levels of 65 strains/conditions of animals in the cohort. (B) Scatter plot showing the z-score-based correlations between pH and lactate levels of 1,239 animals in the cohort. A z-score was calculated for each animal within the strain/condition and used in this study. (C) Schematic diagram of the prediction analysis pipeline. Statistical learning models with leave-one-out cross-validation (LOOCV) were built using a series of behavioral data to predict brain lactate levels in 24 strains/conditions of mice in an exploratory cohort. (D) The scatter plot shows significant correlations between predicted and actual lactate levels. (E) Feature preference for constructing the model to predict brain lactate levels. Bar graphs indicate the selected frequency of behavioral indices in the LOOCV. Line graph indicates absolute correlation coefficient between brain lactate levels and each behavioral measure of the 24 strains/conditions of mice. r, Pearson’s correlation coefficient. (F–H) Scatter plot showing correlations between actual brain lactate levels and measures of working memory (correct responses in maze test) (F), the number of transitions in the light/dark transition test (G), and the percentage of immobility in the forced swim test (H).
Figure 1—figure supplement 1.
Figure 1—figure supplement 1.. Normal distribution of effect size values for pH and lactate in the exploratory and confirmatory cohorts.
(A) D=0.12, P=0.32. (B) D=0.15, P=0.088. (C) D=0.14, P=0.33. (D) D=0.18, P=0.10.
Figure 1—figure supplement 2.
Figure 1—figure supplement 2.. Correlations of brain lactate levels and pH with behavioral measures in an exploratory cohort.
Scatter plots showing effect size-based correlations between actual lactate levels and pH, and behavioral measures. Data from 24 strains/conditions of mice used in the prediction analysis are shown. EP, elevated-plus maze; FS, forced swim test; LD, light/dark transition test; OF, open field test; r, Pearson’s correlation coefficient.
Figure 2.
Figure 2.. Studies in an independent confirmatory cohort validate the negative correlation of brain lactate levels with pH and the association of increased lactate with poor working memory.
(A) Venn diagrams show the number of strains/conditions of animal models with significant changes (P<0.05 compared with the corresponding controls) in brain pH and lactate levels in a confirmatory cohort. Scatter plot shows the effect size-based correlations between pH and lactate levels of 44 strains/conditions of animals in the cohort. (B) Scatter plot showing the z-score-based correlations between pH and lactate levels of 1,055 animals in the cohort. (C) Statistical learning models with leave-one-out cross-validation (LOOCV) were built using a series of behavioral data to predict brain lactate levels in 27 strains/conditions of mice in the confirmatory cohort. (D) The scatter plot shows significant correlations between predicted and actual lactate levels. (E) Feature preference for constructing the model to predict brain lactate levels. Bar graphs indicate the selected frequency of behavioral indices in the LOOCV. Line graph indicates absolute correlation coefficient between brain lactate levels and each behavioral index of the 27 strains of mice. r, Pearson’s correlation coefficient. (F–H) Scatter plots showing correlations between actual brain lactate levels and working memory measures (correct responses in the maze test) (F), the acoustic startle response at 120 dB (G), and the time spent in dark room in the light/dark transition test (H). Figure supplements.
Figure 2—figure supplement 1.
Figure 2—figure supplement 1.. A priori power analysis to estimate the optimum sample size for the confirmatory experiment.
Input parameters: tails = two, correlation |ρ| H1=0.79, α error probability = 0.01, power (1–β error probability)=0.95, correlation |ρ| H0=0. Output parameters: total sample size = 18, actual power = 0.95. The red line indicates 1–β=0.95.
Figure 2—figure supplement 2.
Figure 2—figure supplement 2.. Correlations of brain lactate levels and pH with behavioral measures in a confirmatory cohort.
Scatter plots showing effect size-based correlations between actual lactate levels and pH, and behavioral measures. Data from 27 strains/conditions of mice used in the prediction analysis are shown. EP, elevated-plus maze; FS, forced swim test; LD, light/dark transition test; OF, open field test; r, Pearson’s correlation coefficient.
Figure 2—figure supplement 3.
Figure 2—figure supplement 3.. Correlation of increased brain lactate levels and decreased pH and their associations with poor working memory: studies in a combined cohort.
(A) Venn diagrams show the number of strains/conditions of animal models with significant changes (P<0.05 compared to the corresponding controls) in brain pH and lactate levels in a combined cohort. Scatter plot shows the effect size-based correlations between pH and lactate levels of 109 strains/conditions of animals combined. (B) Scatter plot showing z-score-based correlations between pH and lactate levels of 2,294 animals combined. A z-score was calculated for each animal within strain/condition. (C–H) Prediction of brain lactate levels (C–E) and pH (F–H) from behavioral outcomes in 51 strains/conditions of animals. The scatter plot shows correlations between predicted and actual lactate levels (D) and pH values (G). Feature preference for constructing the model to predict brain lactate levels (E) and pH (H). Bar graphs indicate the selected frequency of behavioral indices in the LOOCV. Line graph shows the absolute correlation coefficient between brain lactate levels and pH, and each behavioral index of 51 mouse strains. r, Pearson’s correlation coefficient.
Figure 2—figure supplement 4.
Figure 2—figure supplement 4.. Correlations of brain lactate levels and pH with behavioral measures in a combined cohort.
Scatter plots showing effect size-based correlations between actual lactate levels and pH, and behavioral measures. Data from 51 strains/conditions of mice used in the prediction analysis are shown. EP, elevated-plus maze; FS, forced swim test; LD, light/dark transition test; OF, open field test; r, Pearson’s correlation coefficient.
Figure 2—figure supplement 5.
Figure 2—figure supplement 5.. Hierarchical clustering of 109 strains/conditions of animals with respect to brain pH and lactate levels.
The effect size was calculated for each strain/condition and was used in this analysis. #1pH and lactate data have been previously reported (Hagihara et al., 2018). #2Lactate data have been reported previously (Hagihara et al., 2021a). #3Lactate data have been submitted elsewhere. Asterisks indicate significant effects of genotype/condition. *p < 0.05, **p < 0.01; unpaired t-test, or one-way or two-way ANOVA followed by post hoc Tukey’s multiple comparison test. Detailed statistical analysis is shown in Supplementary file 3. AD, Alzheimer’s disease; ADHD, attention-deficit/hyperactivity disorder; ASD, autism spectrum disorders; BD, bipolar disorder; CS, chronic stress; DM, diabetes mellitus; EDS, Ehlers-Danlos syndrome; DS, depression symptom; EP, epilepsy; FMR, Fragile X mental retardation; ID, intellectual disability, KI, knock-in; KO, knock out; MD, major depressive disorder; OCD, obsessive-compulsive disorder; PD, Parkinson’s disease; SZ, schizophrenia; Tg, transgenic; TSC, tuberous sclerosis complex.
Figure 2—figure supplement 6.
Figure 2—figure supplement 6.. Effects of age, sex, and storage duration on brain pH and lactate levels.
(A) Multivariate linear regression analysis. (B, C) Scatter plots showing correlations between age at sampling and raw pH (B), and lactate values (C) in wild-type/control animals. (D, E) Scatter plots showing correlations between storage duration and pH (D), and lactate values (E) in the wild-type/control animals. (F, G) Box plots of pH (F) and lactate values (G) in wild-type/control animals of each sex.

Update of

  • doi: 10.1101/2021.02.02.428362
  • doi: 10.7554/eLife.89376.1
  • doi: 10.7554/eLife.89376.2

References

    1. Akter M, Ma H, Hasan M, Karim A, Zhu X, Zhang L, Li Y. Exogenous L-lactate administration in rat hippocampus increases expression of key regulators of mitochondrial biogenesis and antioxidant defense. Frontiers in Molecular Neuroscience. 2023;16:1117146. doi: 10.3389/fnmol.2023.1117146. - DOI - PMC - PubMed
    1. Andrés P. Frontal cortex as the central executive of working memory: time to revise our view. Cortex; a Journal Devoted to the Study of the Nervous System and Behavior. 2003;39:871–895. doi: 10.1016/s0010-9452(08)70868-2. - DOI - PubMed
    1. Argyelan M, Ikuta T, DeRosse P, Braga RJ, Burdick KE, John M, Kingsley PB, Malhotra AK, Szeszko PR. Resting-state fMRI connectivity impairment in schizophrenia and bipolar disorder. Schizophrenia Bulletin. 2014;40:100–110. doi: 10.1093/schbul/sbt092. - DOI - PMC - PubMed
    1. Beasley CL, Dwork AJ, Rosoklija G, Mann JJ, Mancevski B, Jakovski Z, Davceva N, Tait AR, Straus SK, Honer WG. Metabolic abnormalities in fronto-striatal-thalamic white matter tracts in schizophrenia. Schizophrenia Research. 2009;109:159–166. doi: 10.1016/j.schres.2009.01.017. - DOI - PMC - PubMed
    1. Béland-Millar A, Larcher J, Courtemanche J, Yuan T, Messier C. Effects of systemic metabolic fuels on glucose and lactate levels in the brain extracellular compartment of the mouse. Frontiers in Neuroscience. 2017;11:7. doi: 10.3389/fnins.2017.00007. - DOI - PMC - PubMed