. 2024 Mar 26;134(10):e176390.
doi: 10.1172/JCI176390.

Pharmacological suppression of the OTUD4/CD73 proteolytic axis revives antitumor immunity against immune-suppressive breast cancers

Affiliations

Pharmacological suppression of the OTUD4/CD73 proteolytic axis revives antitumor immunity against immune-suppressive breast cancers

Yueming Zhu et al. J Clin Invest. .

Abstract

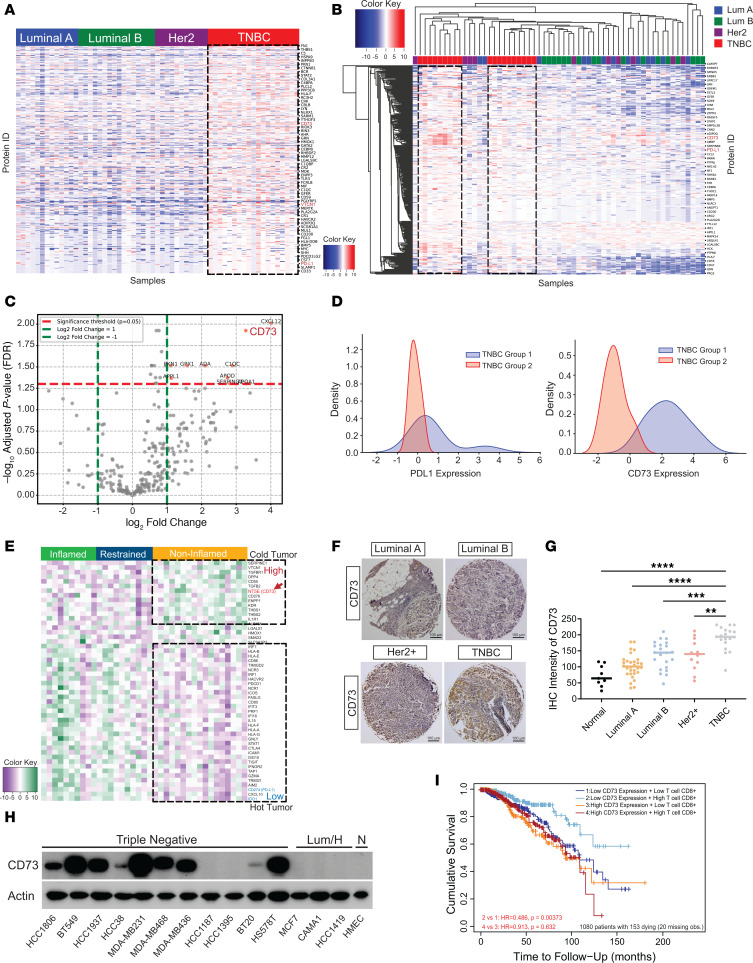
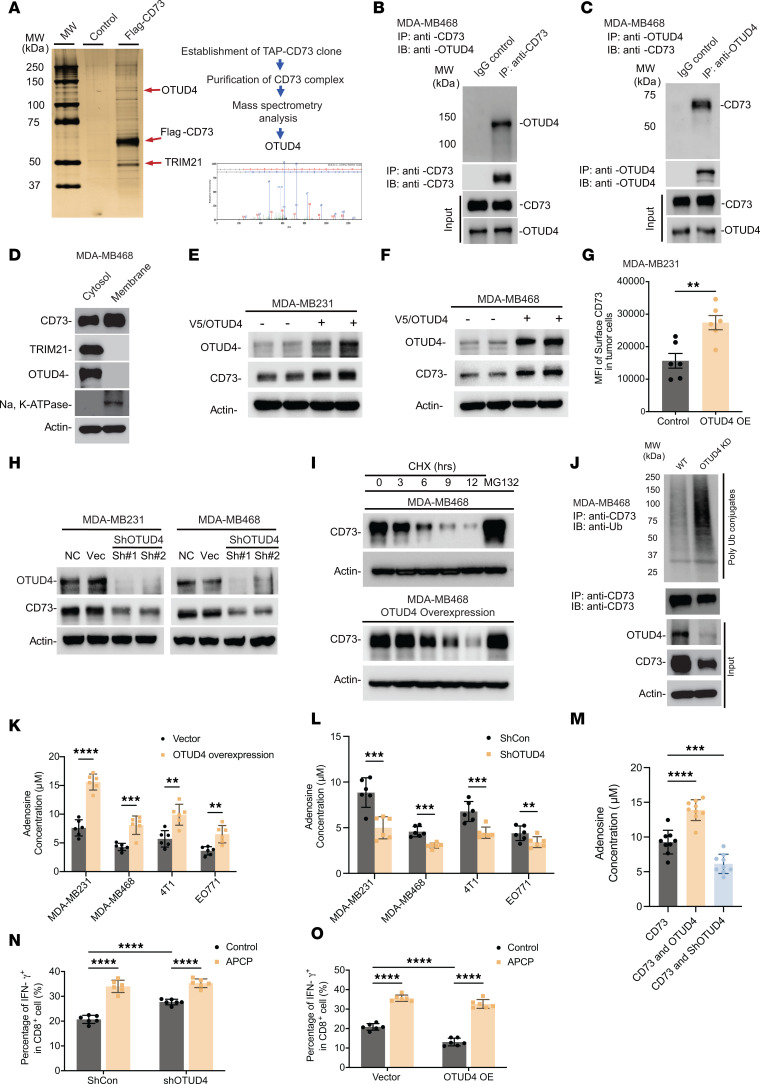
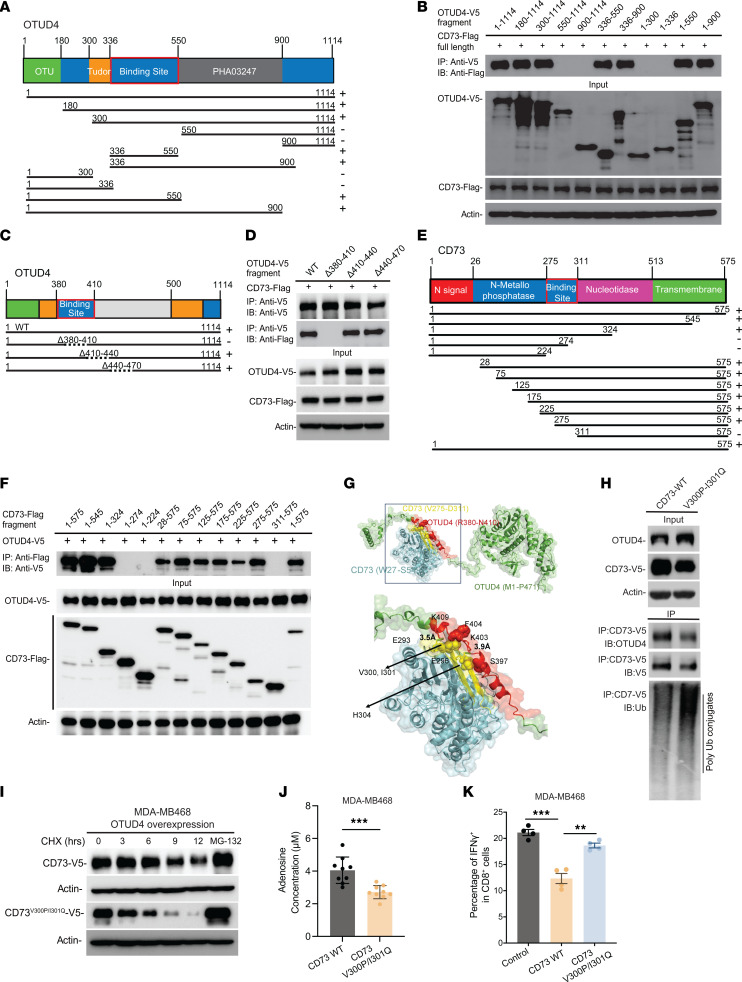
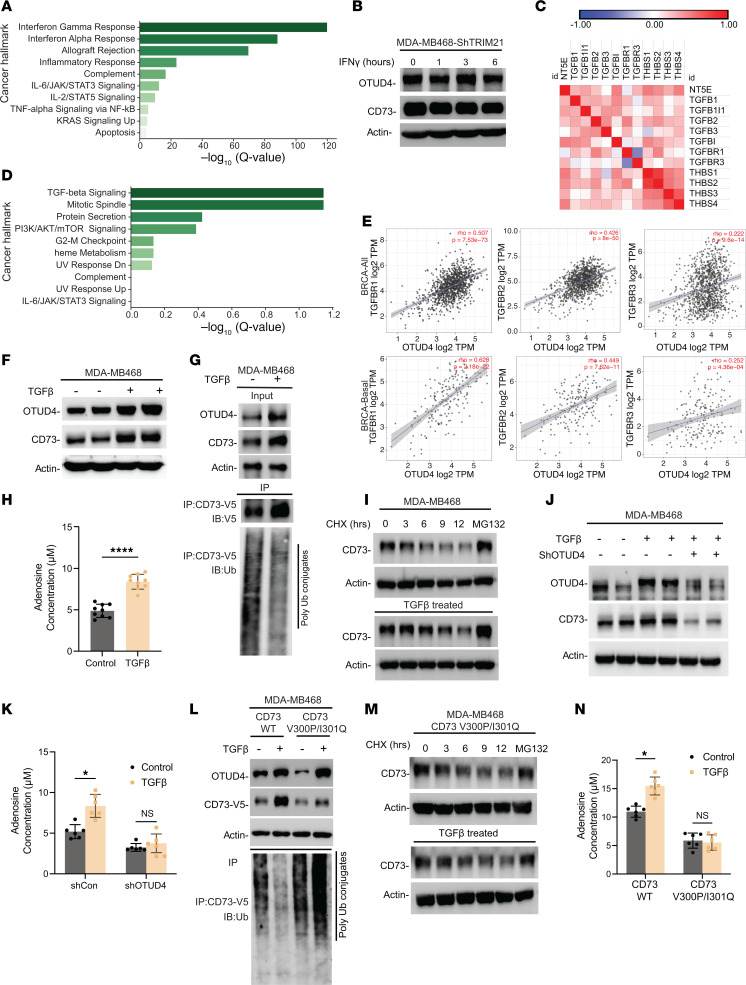
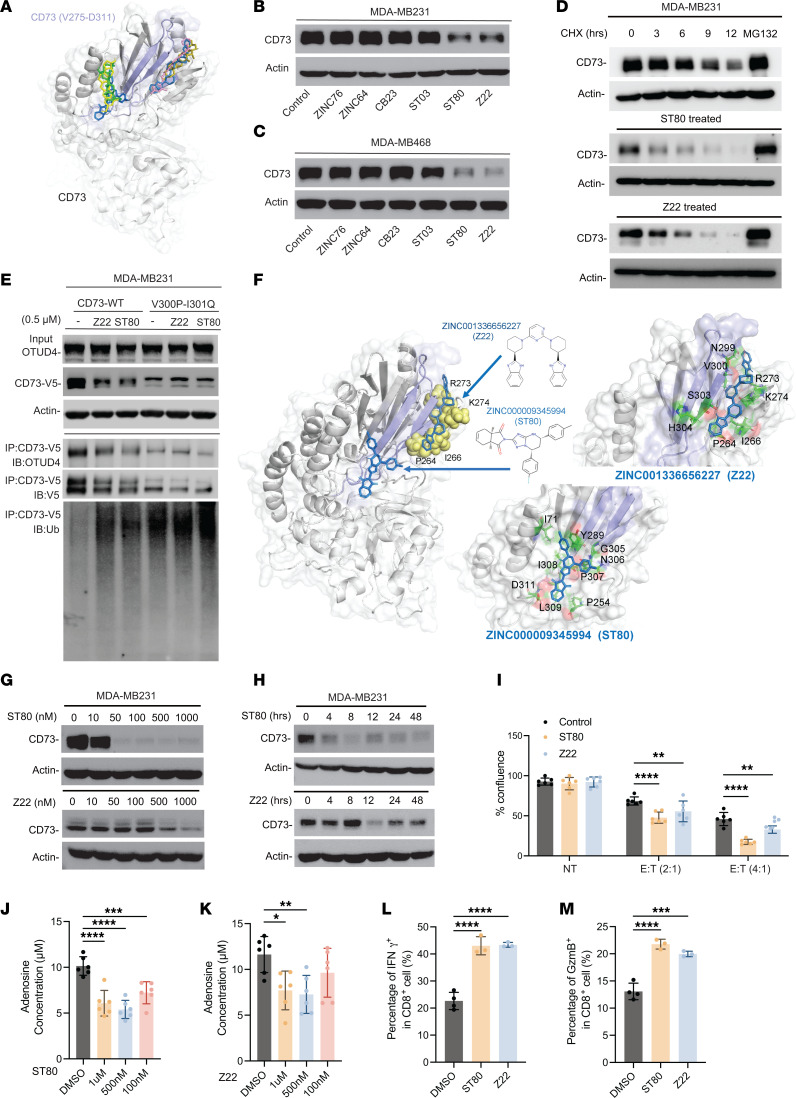
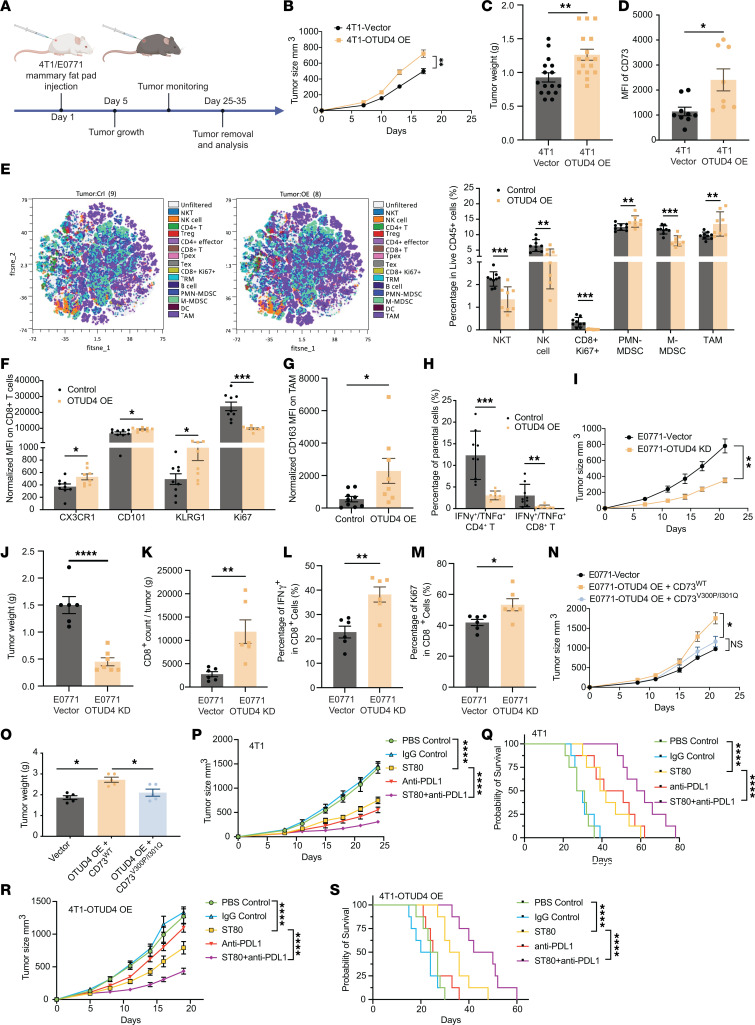
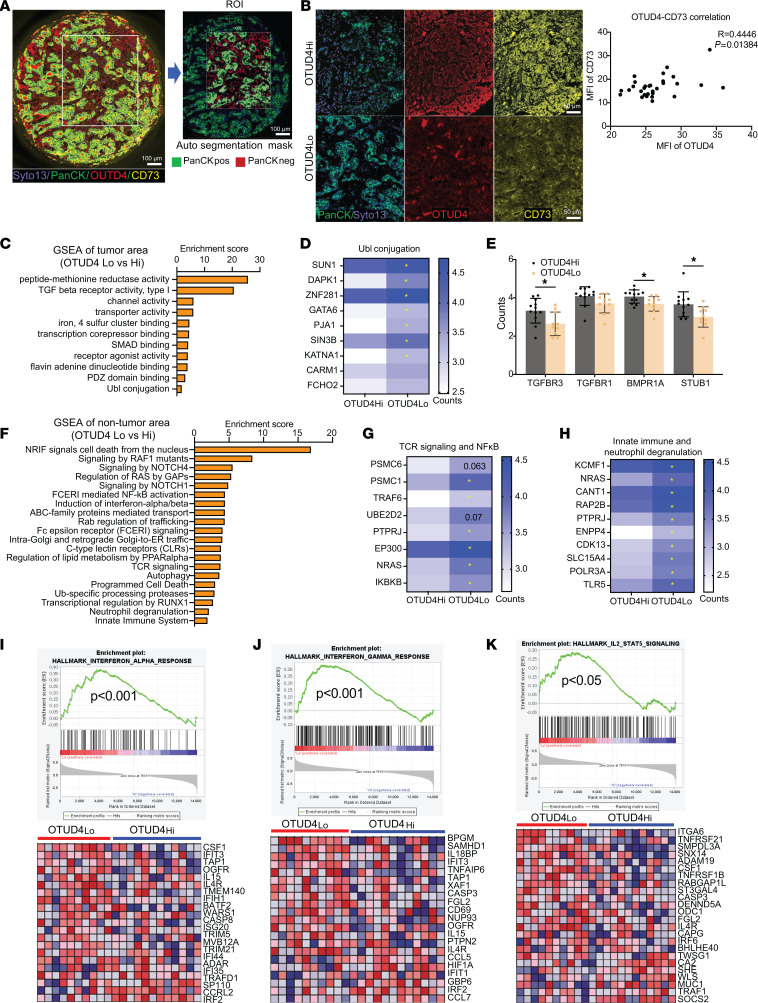
Despite widespread utilization of immunotherapy, treating immune-cold tumors remains a challenge. Multiomic analyses and experimental validation identified the OTUD4/CD73 proteolytic axis as a promising target in treating immune-suppressive triple negative breast cancer (TNBC). Mechanistically, deubiquitylation of CD73 by OTUD4 counteracted its ubiquitylation by TRIM21, resulting in CD73 stabilization inhibiting tumor immune responses. We further demonstrated the importance of TGF-β signaling for orchestrating the OTUD4/CD73 proteolytic axis within tumor cells. Spatial transcriptomics profiling discovered spatially resolved features of interacting malignant and immune cells pertaining to expression levels of OTUD4 and CD73. In addition, ST80, a newly developed inhibitor, specifically disrupted proteolytic interaction between CD73 and OTUD4, leading to reinvigoration of cytotoxic CD8+ T cell activities. In preclinical models of TNBC, ST80 treatment sensitized refractory tumors to anti-PD-L1 therapy. Collectively, our findings uncover what we believe to be a novel strategy for targeting the immunosuppressive OTUD4/CD73 proteolytic axis in treating immune-suppressive breast cancers with the inhibitor ST80.

Keywords: Cancer immunotherapy; Drug screens; Oncology; Therapeutics.


Figures

Figure 1
Figure 1. Accumulation of CD73 is dramatically associated with an unfavorable tumor immune response and prognosis in immune-suppressive breast cancers.
(A) Proteomic analysis of 59 immune-related proteins in TCGA samples of PAM50-defined intrinsic and hormone receptor subtypes, including 19 TNBC, 13 luminal A, 17 luminal B, and 10 Her2+ breast tumors. (B) Heatmap and hierarchical clustering are based on the expression levels of the 309 immune-related proteins — differentially expressed in 4 breast cancer types. Each column represents a sample; each row represents a protein. The log2 relative protein expression scale is depicted on the top left. (C) Volcano plots showing the immune-related protein expression changes in 2 TNBC patient cohorts. Each circle represents 1 protein. The log fold change is represented on the x-axis. The y-axis shows the FDR adjusted log10 of the P value. (D) CD73 and PD-L1 expression density in 2 TNBC groups were calculated based on log2 relative protein expression. (E) mRNA analysis of immune-relevant proteins in 37 specimens from patients with TNBC from the GEO database. The genes (rows) are sorted according to the difference between the average mRNA levels in breast cancer types. (F) Breast cancer specimens TMA stained with an anti-CD73 antibody and representative pictures of different breast cancer subtypes are shown. Scale bars: 100 μm.(G) Quantified TMA consisting of luminal A, luminal B, Her2+, and TNBC samples immune stained for CD73. (H) The expression of CD73 in normal human mammary epithelial cells and various subtypes of breast cancer cells was detected by immunoblotting using an anti-CD73 antibody. (I) Kaplan-Meier curves using multivariable Cox proportional hazard model for the corresponding CD8+ T cells and CD73 expression. A total n = 1,100 breast cancer patients were included in the study, with 20 cases having missing data. The analysis was performed on the remaining 1,080 patients, of whom 153 had died, and Kaplan-Meier curves were subsequently plotted. Low- and high-expression groups refer to patients with expression levels lower and greater than the 50th percentile, respectively. **P < 0.01, ***P < 0.001, and ****P < 0.0001, statistical significance was determined by 1-way ANOVA with Tukey’s multiple comparisons test for immunostaining using n = 110 breast samples.
Figure 2
Figure 2. Identification of OTUD4 as a key driver for CD73 accumulation in immune-suppressive TNBC breast tumors.
(A) CD73 complex was purified with a tandem-affinity purification protocol followed by mass spectrometry analysis in MDA-MB468-Flag/HA-CD73 cells. Silver staining of the purified CD73 complex was illustrated. OTUD4 was identified as a binding partner of CD73, and the representative spectra were included. (B and C) Validation of biochemical interaction between CD73 and OTUD4 in MDA-MB468 cells by coimmunoprecipitation of endogenous CD73 (B) and by coimmunoprecipitation of endogenous OTUD4 (C). (D) Cellular fractionated protein (cytosol versus membrane) expression of CD73 and OTUD4 in MDA-MB468 cells was determined. (E and F) CD73 protein levels were determined in MDA-MB231-OTUD4 (E) and MDA-MB468-OTUD4 (F) breast cancer cells. (G) The MFI of membrane-expressed CD73 was determined by flow cytometry in both MDA-MB231 and MDA-MB231-OTUD4 cells. (H) CD73 protein levels were determined in MDA-MB231-ShOTUD4 and MDA-MB468-ShOTUD4 cells. (I) MDA-MB468 and MDA-MB468-OTUD4 cells were treated with cycloheximide (CHX) or MG132, and CD73 protein levels were determined. (J) Validation of CD73 ubiquitylation by Coimmunoprecipitation of endogenous CD73 in both MDA-MB231 and MDA-MB231-ShOTUD4 cells. (K and L) The adenosine levels were determined in MDA-MB231, MDA-MB468, 4T1, and EO771 breast cancer cells with OTUD4 overexpression (K) or ShOTUD4 (L). (M) The adenosine levels were determined in MDA-MB468-CD73WT, MDA-MB468-CD73WT-OTUD4, and MDA-MB468-CD73WT-ShOTUD4 cells. (N and O) MDA-MB468, MDA-MB468-ShOTUD4 (N), and MDA-MB468-OTUD4-OE (O) were cocultured with human PBMCs with or without APCP treatment, and CD8+ IFN-γ+ T cell population was measured and quantified using flow cytometry (ShCon, control shRNA). Data (mean ± SEM) are representative of at least 3 independent experiments. **P < 0.01, ***P < 0.001 and ****P < 0.0001, by 1-way ANOVA with Tukey’s multiple comparisons test.
Figure 3
Figure 3. Mapping of molecular regions that facilitate the interaction between CD73 and OTUD4 and 3D structural modeling of CD73 regulation based on the interplay of ubiquitylation and deubiquitylation.
(AD) Schematic diagram of human OTUD4 domains and strategy to engineer a series of OTUD4 deletion mutants. Mapping of the molecular domain on OTUD4 involving in the interaction with CD73. The interactions between CD73 and OTUD4 fragments were examined by coimmunoprecipitation experiments in HEK-293T cells. Amino acids stretching from 380–410 on OTUD4 (D) were identified as the region that mediates the interaction between OTUD4 and CD73. (E) Schematic diagram of human CD73 domains and strategy to engineer a series of CD73 deletion fragments. (F) The interactions between OTUD4 and CD73 fragments were determined. Amino acids stretching from 275–311 on CD73 were identified as the region that mediates the interaction between OTUD4 and CD73. (G) Structural model for the interaction of CD73 with OTUD4. Residues R380–N410 (red) of OTUD4 (green) interact with the residues V275–D311 (yellow) of CD73 (cyan). Salt bridges are formed between E296 and E293 of CD73 and K409 and K403 of OTUD4, respectively. The interface is further stabilized by hydrophobic interactions between V300 and V301 of CD73 (yellow) and F404 (red) of OTUD4, and contacts between H304 (yellow) of CD73 and S397 (red) of OTUD4. (H) Validation of interaction domains between OTUD4 with CD73 by coimmunoprecipitation of ectopic V5-tagged CD73WT and V5-tagged CD73V300P/I301Q mutant in HEK-293T cells. The ubiquitylation status of CD73WT and CD73V300P/I301Q mutant was also determined. (I) MDA-MB468-CD73WT and MDA-MB468-CD73V300P/I301Q cells were treated with CHX and MG-132 and CD73 protein turnover were determined. (J) The adenosine levels were determined in MDA-MB468-CD73WT and MDA-MB468-CD73V300P/I301Q. (K) MDA-MB468, MDA-MB468-CD73WT and MDA-MB468-CD73V300P/I301Q were cocultured with human PBMCs and percentage of IFN-γ + in CD8+ T cell population quantified using flow cytometry. Data (mean ± SEM) are representative of at least 3 independent experiments. **P < 0.01 and ***P < 0.001, by unpaired t test, 1-way ANOVA with Tukey’s multiple comparisons test.
Figure 4
Figure 4. Stabilization of CD73 by OTUD4 in immune-cold tumors is orchestrated in response to TGF-β signaling.
(A) MSigDB-based pathway enrichment analysis shows that CD73 expression in TCGA TNBC samples is positively correlated with TGF-β signaling hallmark. (B) MDA-MB468-ShTRIM21 cells were treated with IFN-γ (100 μg/mL), and OTUD4 and CD73 protein levels were determined. (C) Spearman’s rank correlation analysis using CPTAC data set showing the CD73 protein expression is highly positively correlated with TGF-β signaling pathway–related proteins. (D) The MSigDB-based pathway enrichment analysis showing that OTUD4 expression in TCGA TNBC samples is positively correlated with TGF-β signaling hallmark. (E) Spearman’s correlation analysis showing the positive correlation between OTUD4 expression and TGF-β signaling pathway. (F) MDA-MB468 were treated with 3 ng/mL TGF-β, OTUD4, and CD73 protein levels were determined by immunoblotting. (G) MDA-MB468-CD73-V5 were treated with 3 ng/mL TGF-β, CD73 immune complexes were immunoprecipitated and ubiquitylation levels were determined. (H) MDA-MB468 cells were treated with 3 ng/mL TGF-β, adenosine production levels were determined. (I) MDA-MB468 cells were treated with CHX and MG-132. Cell lysates were collected at indicated time points and followed by measuring CD73 protein expression. (J and K) MDA-MB468-ShCon and MDA-MB468-ShOTUD4 were treated with 3 ng/mL TGF-β, OTUD4 and CD73 protein levels (J) and adenosine production (K) were determined. (L) MDA-MB468-CD73WT and MDA-MB468-CD73V300P/I301Q cells were treated with 3 ng/mL TGF-β, V5-tagged CD73 and CD73V300P/I301Q were immunoprecipitated and ubiquitylation level was determined. (M and N) CD73 protein turnover rate (M) and adenosine production level (N) were determined in MDA-MB468-CD73V300P/I301Q and TGF-β–treated MDA-MB468-CD73V300P/I301Q cells. Data (mean ± SEM) are representative of at least 3 independent experiments. *P < 0.05 and ****P < 0.0001, by unpaired t test, 1-way ANOVA with Tukey’s multiple comparisons test.
Figure 5
Figure 5. Development of pharmacological inhibitor that blocks OTUD4/CD73 interaction in restoring tumor immune response in immune-suppressive breast cancer.
(A) Binding sites of the 6 small molecules on CD73. The diagram displays the superposition of all 6 small molecules illustrating that they essentially target 2 distinct sites in the vicinity of the region V275–D311 of CD73 (in indigo) which makes interfacial contacts OTUD4 in the CD73/OTUD4 complex. (B and C) MDA-MB231(B) and MDA-MB468 (C) were treated with 0.5 μM screened compounds and CD73 expression levels were determined. (D) MDA-MB231 were treated with 0.5 μM ST80 or Z22 and CD73 protein turnover rate was determined by pulse-chase analysis. (E) MDA-MB231-CD73WT and MDA-MB231-CD73V300P/I301Q cells were treated with 0.5 μM ST80 and Z22, CD73 immune complexes were immunoprecipitated, OTUD4, CD73, and CD73 ubiquitylation were determined by immunoblotting. (F) Coordination of ST80 and Z22. ST80 (marine) and Z22 (blue) are located in and around residues V275–D311 (indigo) of CD73. The yellow spheres correspond to the labelled CD73 residues that predominantly interact with Z22. (G) MDA-MB231 cells were treated with different doses of ST80 or Z22 for 24 hours and CD73 protein levels were determined. (H) MDA-MB231 cells were treated with 0.5 μM ST80 or Z22, cell lysates were collected at different time points,and CD73 protein levels were determined. (I) MDA-MB231 cells were cocultured with human PBMCs at different Effector (E) to Target (T) ratios (2:1 or 4:1) and treated with ST80 and Z22 (0.5 μM), and cell proliferation rate was determined. (J and K) MDA-MB231 cells were treated with 1 μM, 0.5 μM, and 0.1 μM ST80 (J) and Z22 (K), adenosine productions were determined. (L and M) MDA-MB231 cells were cocultured with human PBMCs and treated with 0.5 μM ST80 or Z22. Percentage of IFN-γ+ in CD8+ T cells (L) and percentage of GzmB+ in CD8+ T cells (M) were measured and quantified using flow cytometry. Data (mean ± SEM) are representative of at least 3 independent experiments. *P < 0.05, **P < 0.01, ***P < 0.001, and ****P < 0.0001, by 1-way ANOVA with Tukey’s multiple comparisons test.
Figure 6
Figure 6. OTUD4-mediated deubiquitylation of CD73 orchestrates tumor immune evasion in vivo.
(A) Schematic diagram of 4T1 control and EO771 breast cancer cells were orthotopically injected into the right fourth mammary gland of the BALB/c WT (WT) mice. PBS was used in the control mouse group. Tumor weight was measured at the endpoint, and the tumor growth curve was plotted. (BD) 4T1 control and 4T1-OTUD4 overexpression tumors were harvested 21 days after tumor challenge, tumor growth curve was plotted (B), and tumor weight was measured at the endpoint (C). Membrane-bound CD73 was analyzed by flow cytometry (D). (E) Exemplified tSNE visualization of overlaid main immune cell population composition within tumor infiltrates. Summarized frequencies of total infiltrated main immune populations among live CD45+ cells were compared in 4T1 control tumor and 4T1-OTUD4 overexpression tumor at 18 days after tumor challenge. (F) The expression levels of CX3CR1, CD101, KLRG1, and Ki67 were measured in the tumor-infiltrating CD8+ T cells between 4T1-control tumors and 4T1-OTUD4–overexpression tumor. (G) The expression levels of CD163 were compared in tumor associated macrophages (TAMs) between 4T1 control tumors and 4T1-OTUD4 overexpression tumors. (H) Comparison of the percentage of IFN-γ+/TNF-α+ among tumor-infiltrated CD4+ or CD8+ T cells between 4T1 control tumor and 4T1-OTUD4 overexpression tumor. (I and J) EO771-control and EO771-OTUD4–KD tumors were harvested 21 days after tumor challenge and analyzed. Tumor growth curve was plotted (I) and tumor weight (J) was measured at the end point. (K) Tumor-infiltrating CD8+ T cells in EO771 control and EO771-OTUD4–KD tumors were determined by flow cytometry. (L) Percentage of IFN-γ+ in tumor-infiltrating CD8+ T cells in EO771-control and EO771-OTUD4–KD tumors was shown. (M) T cell proliferation was determined by Ki67 staining using flow cytometry. (N and O) EO771, EO771-OTUD4-CD73WT, and EO771-OTUD4-CD73V300P/I301Q breast cancer cells were orthotopically injected into the right fourth mammary gland of the C57BL/6 WT mice. PBS was used in control group. Tumor growth curve was plotted (N) and tumor weight was measured at the end point (O). (PS) 4T1-hPD-L1 and 4T1-hPDL1-OTUD4, where the basal mouse PD-L1 was replaced with a human counterpart, and 4T1-hPD-L1 or 4T1-hPDL1-OTUD4 cells were orthotopically injected into the right fourth mammary fat pad and allow to grow around 100 mm3, followed by injection of ST80 (5 mg/kg, i.p.) 2 times/week, and PD-L1 antibody durvalumab (5 mg/kg, i.p.) 3 times. PBS and IgG control were used in control groups. Tumor growth (P and R) and survival curves (Q and S) of the mice were plotted. Data (means ± SEM) are representative of at least 2 independent experiments with 5 to 10 independently analyzed mice per group. *P < 0.05, **P < 0.01, ***P < 0.001, and ****P < 0.0001. For tumor growth statistical analysis, 2-way ANOVA followed by multiple unpaired t tests were performed.
Figure 7
Figure 7. Spatially resolved signatures pertaining to OTUD4hi/CD73hi are associated with unfavorable immune responses.
(A) Representative staining of OTUD4, CD73 and PanCK, followed by the selection of regions of interest (ROI) and subsequent autosegmentation in TNBC tissue sections (n = 30) using DSP. Scale bars: 100 μm. (B) The analysis of OTUD4 and CD73 protein expression on TNBC (n = 30) using ImageJ showing the positive correlation between OTUD4 with CD73. Scale bars: 50 μm. (C–E) DAVID functional gene onology (GO) analysis of molecular function (MF) on the DEGs (different expressional genes) in tumor epithelial compartment (PanCK+) between OTUD4-high expression cases and OTUD4-low expression cases (C), revealing decreased Ubl conjugation (D) and increased TGF-β signaling activity (E) in OTUD4-high expression tumors; (FH) DAVID REACTOME analysis of DEGs in nontumor areas between OTUD4-high expression cases and OTUD4-low expression cases (F), highlighting increased TCR signaling, NFκB activation (G) and induction of IFN-α/β (H) in patients with OTUD4-low expression; (I–K) Gene set enrichment analysis (GSEA) demonstrating positive enrichment of hallmark curated gene sets for IFN-α response (I), IFN-γ response (J), and IL-2-STAT5 signaling (K) in nontumor areas of OTUD4-low expression cases compared with OTUD4-high expression cases. Data (mean ± SEM) are representative of at least 3 independent experiments. *P < 0.05, by 1-way ANOVA with Tukey’s multiple comparisons test.

Comment in

  • Posttranslational protein modifications as gatekeepers of cancer immunogenicity doi: 10.1172/JCI180914

References

    1. Vijayan D, et al. Targeting immunosuppressive adenosine in cancer. Nat Rev Cancer. 2017;17(12):709–724. doi: 10.1038/nrc.2017.86. - DOI - PubMed
    1. Sharma P, et al. Primary, adaptive, and acquired resistance to cancer immunotherapy. Cell. 2017;168(4):707–723. doi: 10.1016/j.cell.2017.01.017. - DOI - PMC - PubMed
    1. Hegde PS, Chen DS. Top 10 challenges in cancer immunotherapy. Immunity. 2020;52(1):17–35. doi: 10.1016/j.immuni.2019.12.011. - DOI - PubMed
    1. Song X, et al. Pharmacologic suppression of B7-H4 glycosylation restores antitumor immunity in immune-cold breast cancers. Cancer Discov. 2020;10(12):1872–1893. doi: 10.1158/2159-8290.CD-20-0402. - DOI - PMC - PubMed
    1. Stanton SE, et al. Variation in the incidence and magnitude of tumor-infiltrating lymphocytes in breast cancer subtypes: a systematic review. JAMA Oncol. 2016;2(10):1354–1360. doi: 10.1001/jamaoncol.2016.1061. - DOI - PubMed

MeSH terms