Review
. 2024 Aug;56(8):2651-2658.
doi: 10.1007/s11255-024-04022-8. Epub 2024 Mar 26.

ROC curve analysis: a useful statistic multi-tool in the research of nephrology

Affiliations
Review

ROC curve analysis: a useful statistic multi-tool in the research of nephrology

Stefanos Roumeliotis et al. Int Urol Nephrol. 2024 Aug.

Abstract

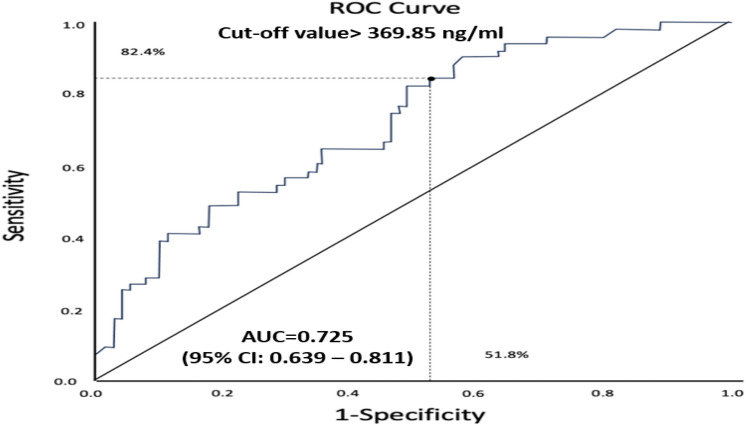
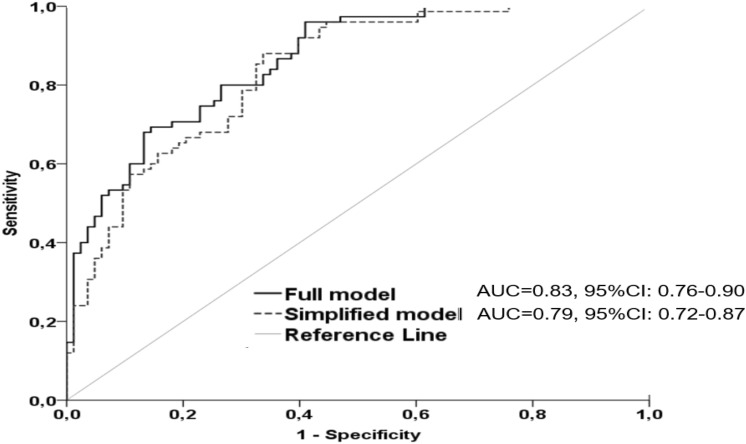
In the past decade, scientific research in the area of Nephrology has focused on evaluating the clinical utility and performance of various biomarkers for diagnosis, risk stratification and prognosis. Before implementing a biomarker in everyday clinical practice for screening a specific disease context, specific statistic measures are necessary to evaluate the diagnostic accuracy and performance of this biomarker. Receiver Operating Characteristic (ROC) Curve analysis is an important statistical method used to estimate the discriminatory performance of a novel diagnostic test, identify the optimal cut-off value for a test that maximizes sensitivity and specificity, and evaluate the predictive value of a certain biomarker or risk, prediction score. Herein, through practical examples, we aim to present a simple methodological approach to explain in detail the principles and applications of ROC curve analysis in the field of nephrology pertaining diagnosis and prognosis.

Keywords: Area under the curve; Diagnostic test,; Discriminatory ability; Receiver operator characteristic curve; Sensitivity; Specificity.


Figures

Fig. 1
Fig. 1
Receiver operating characteristics (ROC) curves. Diagonal, dotted, black line (iii): a diagnostic test with the lowest discriminatory ability, which is no better than chance, area under the curve (AUC) = 0.5. The value of AUC is accompanied by 95% CIs. Gray line (ii): a test with a modest discriminatory ability of about 0.5. Black line (i): a perfect, accurate diagnostic test (highest sensitivity (100%) and specificity (100%)), AUC = 1
Fig. 2
Fig. 2
ROC curve showing optimal cut-off value for serum asprosin, with an AUC of 72.5% for cutoff > 369.85 ng/ml (black dot), dotted black lines show sensitivity and specificity for this specific cut-off value, 82.4% and 51.8% respectively
Fig. 3
Fig. 3
ROC curve showing optimal cut-off value for UAR, with an AUC of 72% for cutoff > 12.17(black dot). dotted black lines show sensitivity and specificity for this specific cut-off value, 83.21% and 60.81%, respectively
Fig. 4
Fig. 4
ROC curves comparing the discriminatory performance of the full and simplified risk model in predicting CV disease in patients with diabetic kidney disease

References

    1. Obuchowski NA, Bullen JA (2018) Receiver operating characteristic (ROC) curves: review of methods with applications in diagnostic medicine. Phys Med Biol 63(7):07TR110.1088/1361-6560/aab4b1 - DOI - PubMed
    1. Cook NR (2008) Statistical evaluation of prognostic versus diagnostic models: beyond the ROC curve. Clin Chem 54(1):17–23 10.1373/clinchem.2007.096529 - DOI - PubMed
    1. Kamarudin AN, Cox T, Kolamunnage-Dona R (2017) Time-dependent ROC curve analysis in medical research: current methods and applications. BMC Med Res Methodol 17(1):1–19 10.1186/s12874-017-0332-6 - DOI - PMC - PubMed
    1. Zhou J, Yuan W, Guo Y, Wang Y, Dai Y, Shen Y et al (2023) Asprosin is positively associated with metabolic syndrome in hemodialysis patients: a cross-sectional study. Ren Fail 45(1):2220425 10.1080/0886022X.2023.2220425 - DOI - PMC - PubMed
    1. Rodrigues HCN, Silva ML, dos Santos MM, da Silva JM, Domingues MFP, Tanni SÉ et al (2023) Higher urea-to-albumin ratio is associated with mortality risk in critically ill COVID-19 patients. Clin Nutr ESPEN 56:9–12 10.1016/j.clnesp.2023.04.017 - DOI - PMC - PubMed

LinkOut - more resources