Randomized Controlled Trial
. 2024 Aug 1;116(8):1374-1383.
doi: 10.1093/jnci/djae070.

Metformin boosts antitumor immunity and improves prognosis in upfront resected pancreatic cancer: an observational study

Collaborators, Affiliations
Randomized Controlled Trial

Metformin boosts antitumor immunity and improves prognosis in upfront resected pancreatic cancer: an observational study

Casper W F van Eijck et al. J Natl Cancer Inst. .

Abstract

Background: Beyond demographic and immune factors, metabolic considerations, particularly metformin's recognized impact in oncology, warrant exploration in treating pancreatic cancer. This study aimed to investigate the influence of metformin on patient survival and its potential correlation with distinct immune profiles in pancreatic ductal adenocarcinoma (PDAC) tumors.

Methods: We included 82 upfront resected and 66 gemcitabine-based neoadjuvant chemoradiotherapy (nCRT)-treated patients from the PREOPANC randomized controlled trial (RCT). Transcriptomic NanoString immunoprofiling was performed for a subset of 96 available resected specimens.

Results: Disparities in survival outcomes and immune profiles were apparent between metformin and non-metformin users in upfront resected patients but lacking in nCRT-treated patients. Compared to non-metformin users, upfront resected metformin users showed a higher median overall survival (OS) of 29 vs 14 months and a better 5-year OS rate of 19% vs 5%. Furthermore, metformin use was a favorable prognostic factor for OS in the upfront surgery group (HR = 0.56; 95% CI = 0.32 to 0.99). Transcriptomic data revealed that metformin users significantly underexpressed genes related to pro-tumoral immunity, including monocyte to M2 macrophage polarization and activation. Furthermore, the relative abundance of anti-inflammatory CD163+ MRC1+ M2 macrophages in non-metformin users and immune-activating CD1A+ CD1C+ dendritic cells in metformin users was heightened (P < .001).

Conclusion: This study unveils immune profile changes resulting from metformin use in upfront resected pancreatic cancer patients, possibly contributing to prolonged survival outcomes. Specifically, metformin use may decrease the abundance and activity of pro-tumoral M2 macrophages and increase the recruitment and function of tumor-resolving DCs, favoring antitumor immunity.[PREOPANC trial EudraCT: 2012-003181-40].


Conflict of interest statement

The authors declare that they have no competing interests.

Figures

Figure 1.
Figure 1.
Survival analysis of metformin and non-metformin users. (A) Kaplan-Meier curves stratified by treatment illustrate different OS in months associated with metformin use in treatment-naive patients but not in nCRT-treated patients. Treatment-naive patients using metformin (green) show prolonged OS compared to non-metformin users (red). The x-axis displays the overall survival (months), and the y-axis displays the survival probability (%). (B) Forest plots, stratified by treatment, visualize univariate and multivariate Cox proportional hazard models highlighting metformin use as an independent prognostic factor for OS in treatment-naive patients but not in nCRT-treated patients. Squares highlighted in green denote statistical significance (P.adj < .05) for the respective covariate. CI = confidence interval; nCRT = neoadjuvant chemoradiotherapy; OS = overall survival; P.adj = adjusted P value.
Figure 2.
Figure 2.
Exploration analysis of the transcriptomic NanoString expression data from the 96 PDAC specimens. (A) t-SNE biplots illustrating the expression profile of 730 immune-related genes, stratified by treatment and grouped by metformin (green) and non-metformin (red) users. Clear clusters of patients based on metformin use are observed in the treatment-naive group, whereas no such clustering is present in gemcitabine nCRT-treated patients. Each dot represents a patient, and the x-axis and y-axis represent the first and second t-SNE dimensions. (B) Volcano plots, stratified by treatment, illustrate the DE genes between metformin (green) and non-metformin (red) users. The treatment-naive group exhibits a greater number of DE genes compared to the nCRT-treated group. The x-axis displays the log2 fold of change, while the y-axis displays the -log10 P value. Each dot represents a gene, and gene names indicate that they have exceeded the significance threshold of P less than   .01. Genes on the right (positive) are overexpressed in metformin users, whereas genes on the left are overexpressed in non-metformin users. DE = differentially expressed; nCRT = neoadjuvant chemoradiotherapy; PDAC = pancreatic ductal adenocarcinoma; t-SNE = t-distributed stochastic neighbor embedding.
Figure 3.
Figure 3.
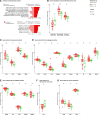
Detailed analysis of the transcriptomic NanoString expression data from the 46 upfront resected PDAC specimens. (A) Bar plots illustrate the results of the overrepresentation analysis for pathways characterized by a gene set size of ≤40. Only pathways exhibiting a proportional overlap of ≥ 10% (left of the x-axis) and an enrichment P.adj < .01 (right of the x-axis) are presented. Each bar represents a unique pathway, and all pathways are enhanced in non-metformin users (ie, diminished in metformin users). (B) Boxplots illustrating the mRNA-based immune cell score (y-axis) of tumor-infiltrating cells (x-axis). The relative abundance of DCs, M2 macrophages, and monocytes was higher in non-metformin (red) than in metformin (green) users. (C-G) Boxplots, stratified by metformin (green) and non-metformin (red) users, illustrate the log2 gene expression count (y-axis) of DE genes (P < .01) and several genes with trends (P < .05) (x-axis). In metformin compared to non-metformin users, genes related to monocyte recruitment (C), M2 macrophage polarization (D), M2 macrophage activation (E), and immune checkpoints (F) are overexpressed, whereas a gene related to DC development and function (G) were underexpressed. In panels A and C to G, each dot represents a patient. DC = dendritic cell; DE = differentially expressed; GOBP = gene ontology biological processes; nCRT = neoadjuvant chemoradiotherapy; PDAC = pancreatic ductal adenocarcinoma; ■P value  less than .05, *P value  less than .01, **P value less than .001.

References

    1. Malvezzi M, Santucci C, Boffetta P, et al.European cancer mortality predictions for the year 2023 with focus on lung cancer. Ann Oncol. 2023;34(4):410-419. - PubMed
    1. Siegel RL, Miller KD, Wagle NS, et al.Cancer statistics, 2023. CA Cancer J Clin. 2023;73(1):17-48. - PubMed
    1. Chakraborty S, Singh S.. Surgical resection improves survival in pancreatic cancer patients without vascular invasion- a population based study. Ann Gastroenterol. 2013;26(4):346-352. - PMC - PubMed
    1. Winter JM, Brennan MF, Tang LH, et al.Survival after resection of pancreatic adenocarcinoma: Results from a single institution over three decades. Ann Surg Oncol. 2012;19(1):169-175. - PubMed
    1. Paniccia A, Hosokawa P, Henderson W, et al.Characteristics of 10-year survivors of pancreatic ductal adenocarcinoma. JAMA Surg. 2015;150(8):701-710. - PubMed

Publication types

MeSH terms