. 2024 May 7;227(1):iyae031.
doi: 10.1093/genetics/iyae031.

Mouse Genome Informatics: an integrated knowledgebase system for the laboratory mouse

Collaborators, Affiliations

Mouse Genome Informatics: an integrated knowledgebase system for the laboratory mouse

Richard M Baldarelli et al. Genetics. .

Abstract

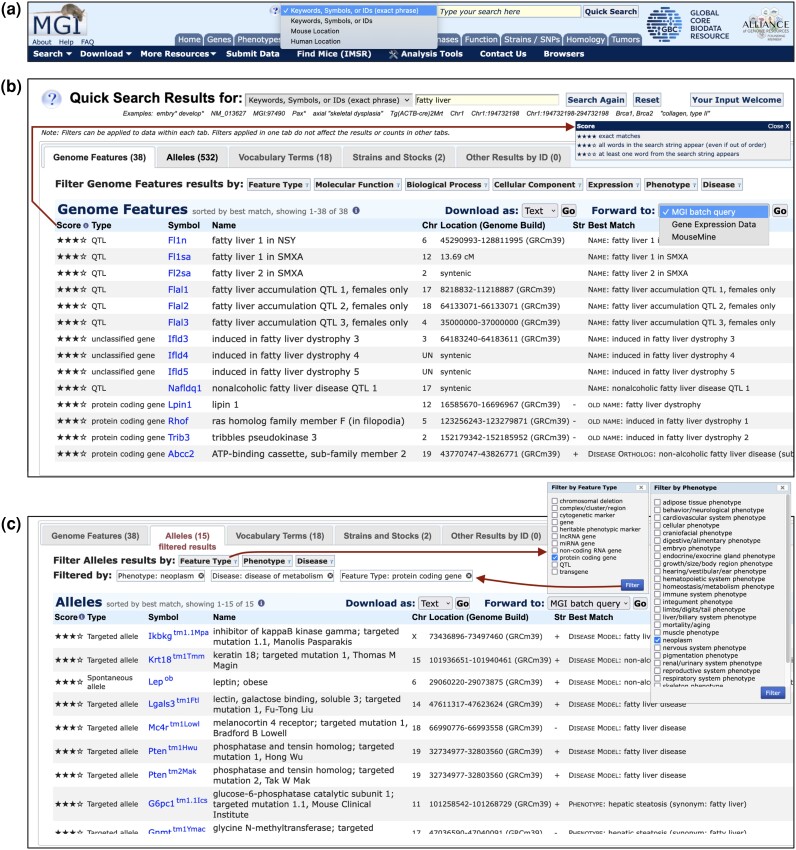
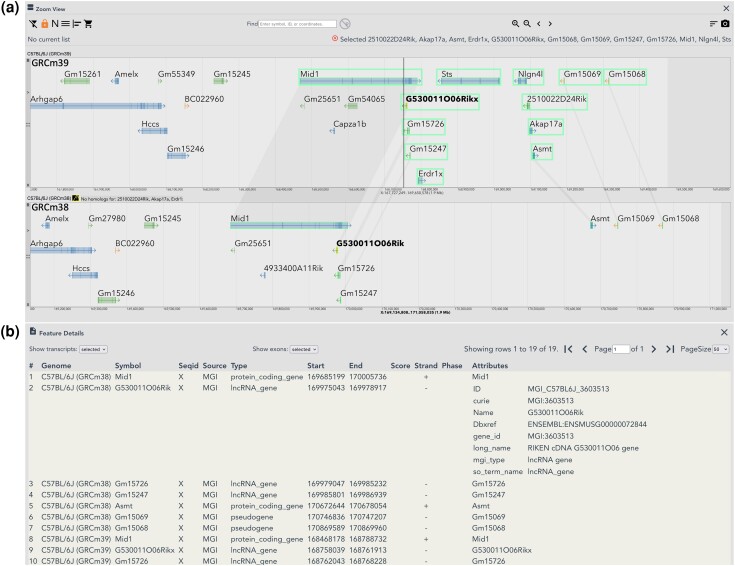
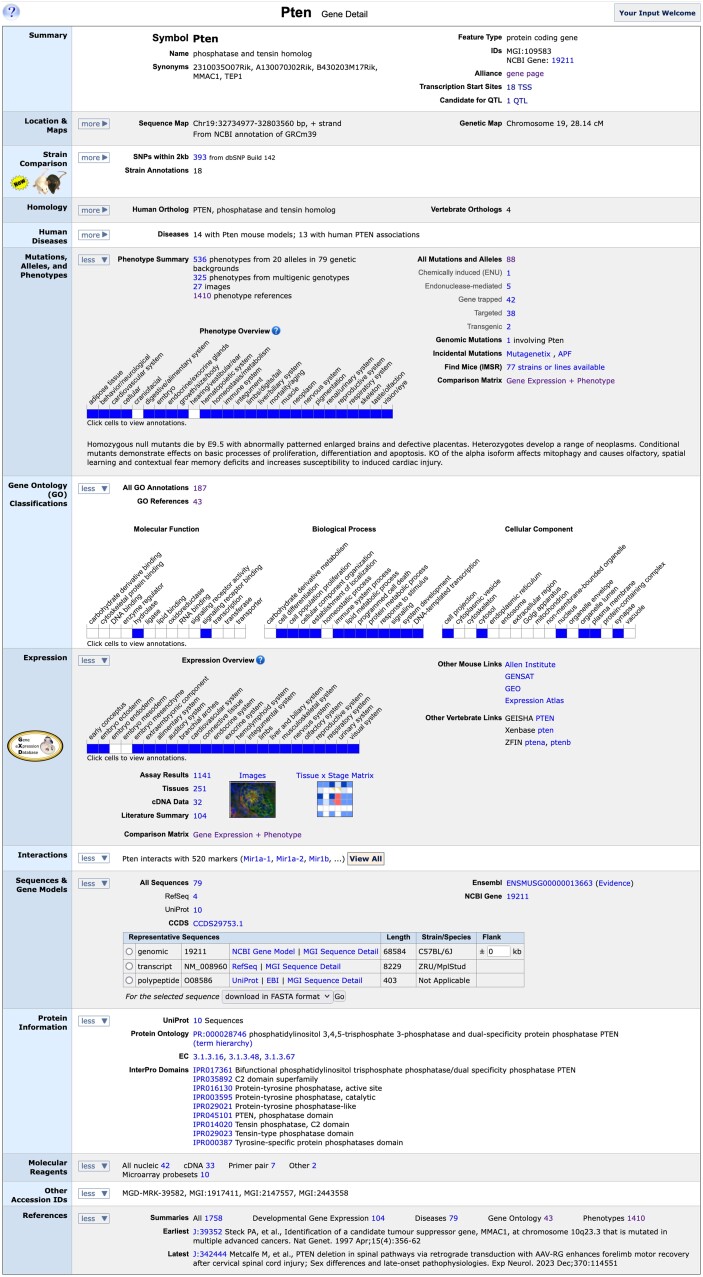
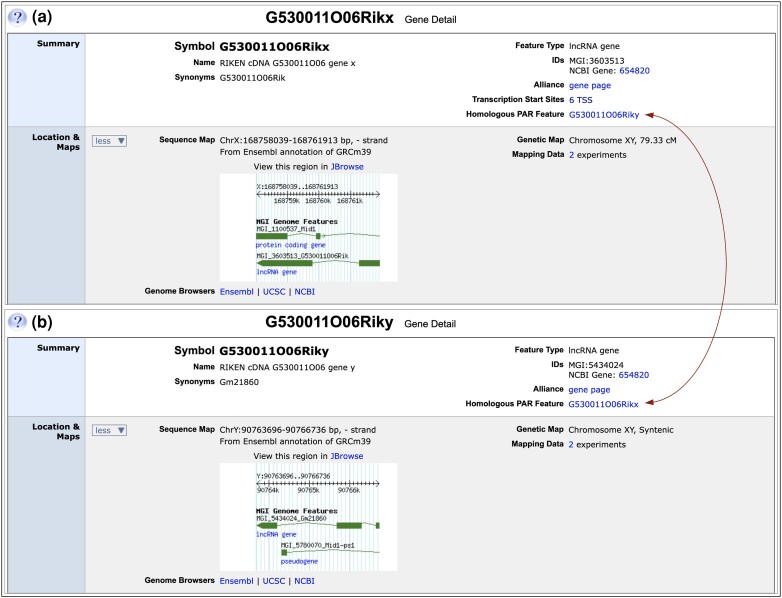
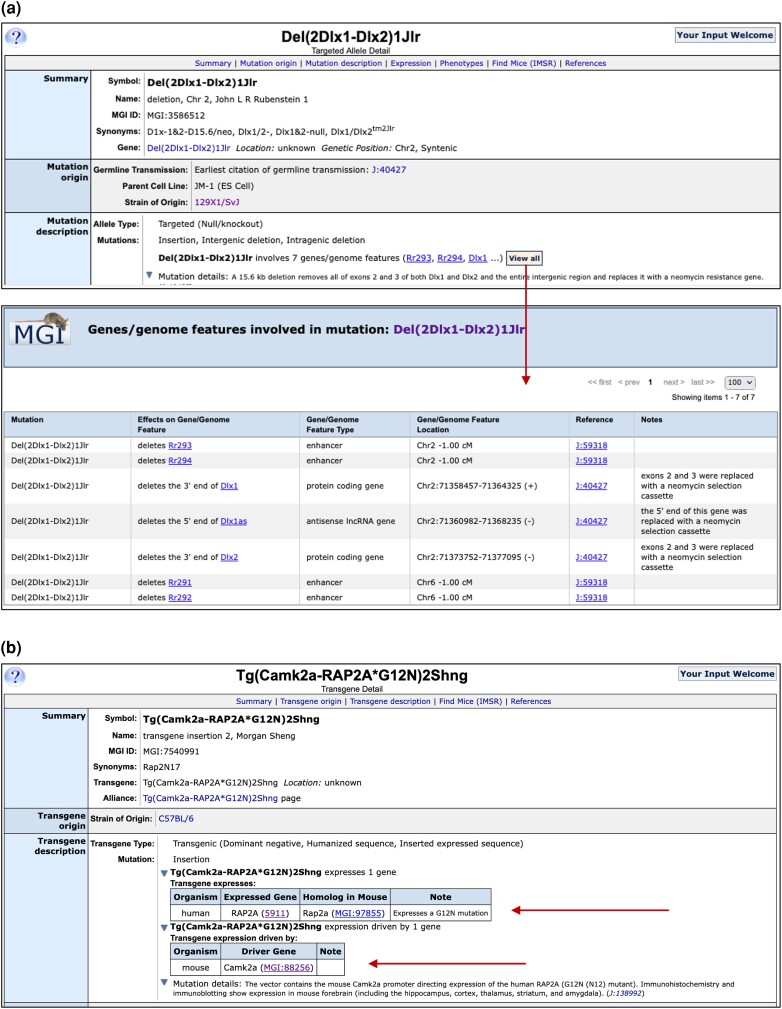
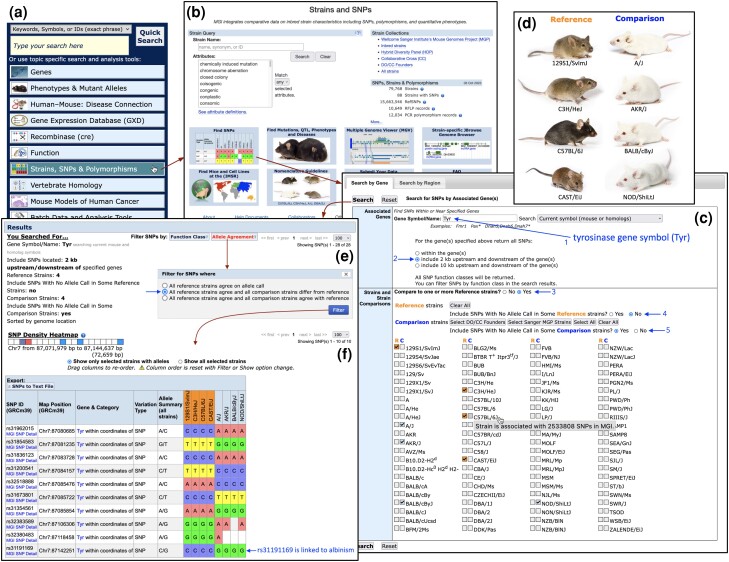
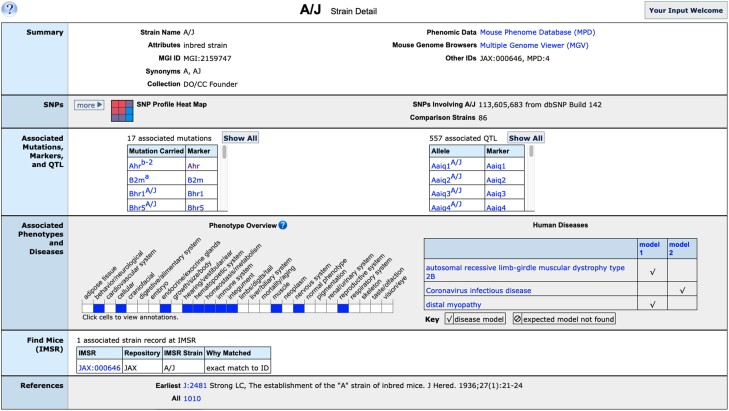
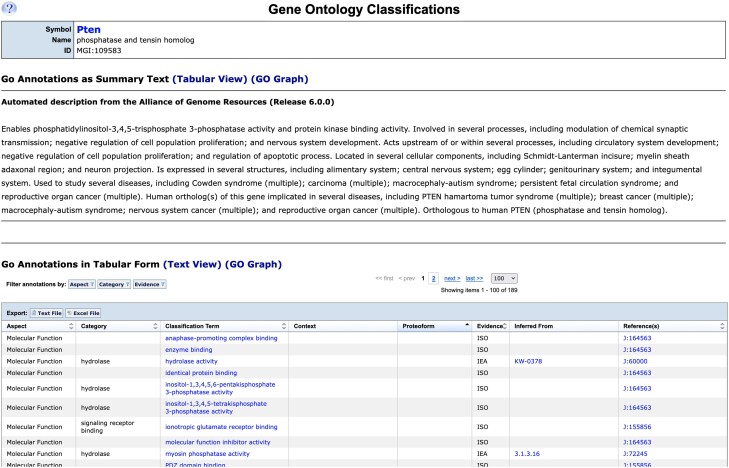
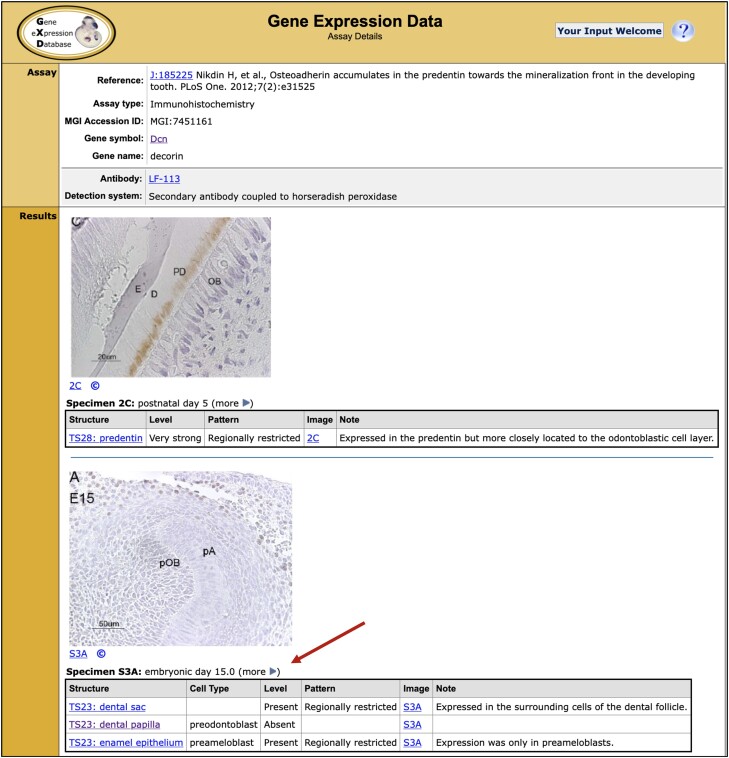
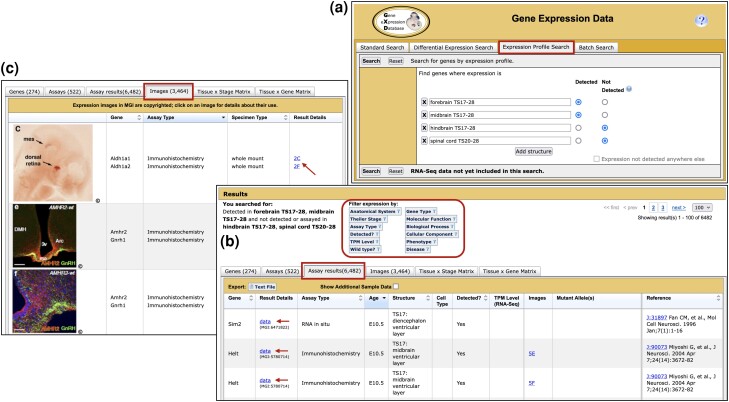
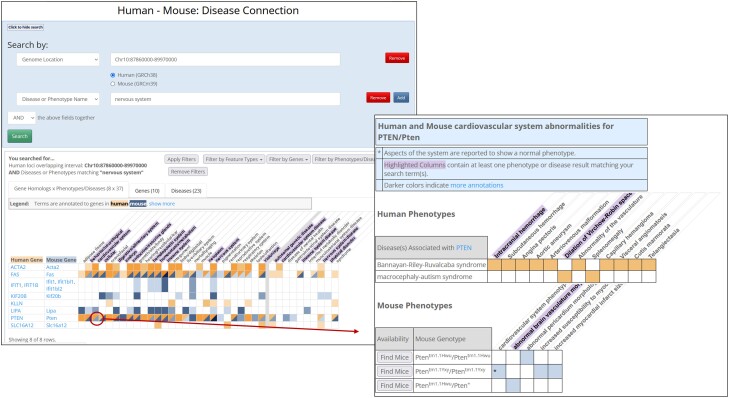
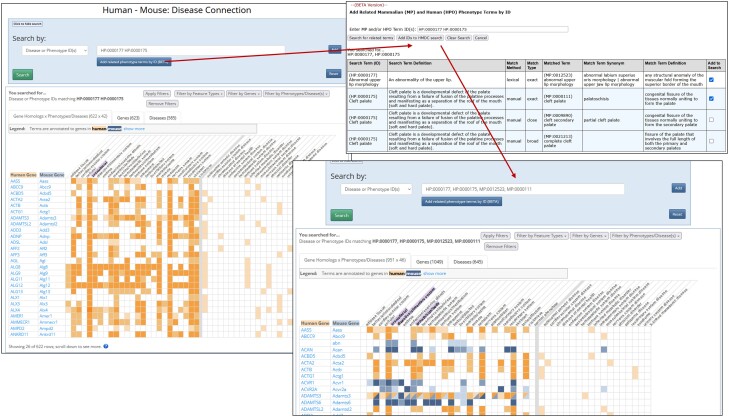
Mouse Genome Informatics (MGI) is a federation of expertly curated information resources designed to support experimental and computational investigations into genetic and genomic aspects of human biology and disease using the laboratory mouse as a model system. The Mouse Genome Database (MGD) and the Gene Expression Database (GXD) are core MGI databases that share data and system architecture. MGI serves as the central community resource of integrated information about mouse genome features, variation, expression, gene function, phenotype, and human disease models acquired from peer-reviewed publications, author submissions, and major bioinformatics resources. To facilitate integration and standardization of data, biocuration scientists annotate using terms from controlled metadata vocabularies and biological ontologies (e.g. Mammalian Phenotype Ontology, Mouse Developmental Anatomy, Disease Ontology, Gene Ontology, etc.), and by applying international community standards for gene, allele, and mouse strain nomenclature. MGI serves basic scientists, translational researchers, and data scientists by providing access to FAIR-compliant data in both human-readable and compute-ready formats. The MGI resource is accessible at https://informatics.jax.org. Here, we present an overview of the core data types represented in MGI and highlight recent enhancements to the resource with a focus on new data and functionality for MGD and GXD.

Keywords: gene expression; genetics; genome informatics; model organism; mouse models; phenotypes.


Conflict of interest statement

Conflicts of interest: The author(s) declare no conflicts of interest.

Figures

Fig. 1.
Fig. 1.
The Quick Search Tool runs five simultaneous searches that provide an onramp to MGI data. a) All MGI pages display the Quick Search input box at top-right of the page. Three search modes are available: search for Keywords/Symbols/IDs that contain the exact phrase of the query (first option, default) or that contain any word of the query (second option), and two location modes that search MGI by genome coordinates (mouse or human). The exact phrase mode is also triggered by enclosing a search string in quotes. The tool reverts to Mouse Location mode automatically if coordinates are entered, unless Human Location mode is selected (not shown). b) Results from an exact phrase search for phrase: fatty liver are shown. The first tab containing at least one search result is opened by default (the Genome Features tab in this case). Type, nomenclature, and location for each matching genome feature are provided along with the item associated with the feature that best matches the query (last column) and the score of the match (first column). Star tiers are defined in the Score popup (arrow). Results are sorted first by score, then by the weight of the type of item best matched (current nomenclature > old nomenclature > vocabulary terms) and finally by Symbol, which also links to the corresponding gene detail page. All five tabs are shown, even if no results are returned for a given tab, and result counts from each of the five data area searches are shown in the tabs for those results [Genome Features (38), Alleles (532), Vocabulary Terms (18), Strains and Stocks (2), and Other Results by ID (0)]. Each tab has its own table columns, links to relevant MGI pages, pagination controls and set of biological domain filters. Results from each tab can be exported as plain text or spreadsheet or forwarded in batch to MGI resources for additional information on the whole result set. The Genome Features tab offers the most extensive filter set, including Feature Type, Gene Function, Expression, Phenotype, and Disease options. c) The same search in panel b showing the Alleles tab with filtered results. Filtered tabs are indicated and display the count of filtered results. The original set of 532 alleles from the search for fatty liver were restricted to 15 alleles by applying three filters: Feature Types (options shown, execution path shown with arrows), Phenotype (high-level terms of the MP Ontology, options shown), and Disease (high-level terms of the DO, options not shown). Note the filter options for the Alleles and Genome Features tabs are different. The resulting alleles are of protein-coding genes and are associated with neoplasm phenotypes and one or more metabolic diseases (two alleles of the Pten gene satisfy these conditions). The Allele tab displays allele type and nomenclature, and allele symbols link to MGI Allele Detail pages. Location information is for associated genes. Score and best match are as described in panel b.
Fig. 2.
Fig. 2.
Pseudoautosomal Region (PAR) features in GRCm39. MGV view of the PARX region, comparing GRCm39 vs GRCm38 assembly representations of PARX annotations. a) MGV Zoom View showing distal ends of Chr X in the C57BL/6J (GRCm39) (top) and C57BL/6J (GRCm38) (bottom) genomes. PARX features in the C57BL/6J (GRCm39) genome are boxed with connectors shown to corresponding features annotated in the GRCm38 genome. Annotations for Erdr1x, Sts, Nlgn4l, 2510022D24Rik and Akap17a are only present in GRCm39. A display limit truncates the “No homologs for:” section, but users can scroll through that section in the MGV to see the full list. A vertical line marks the approximate PAR boundary in the Build 39 genome at position chrX:168752755, which falls within the Mid1 gene in strain C57BL/6J. Although transcription direction arrows in the glyphs for some PARX features cross the PAR boundary in the figure (G530011O06Rikx and Gm15726), Build 39 coordinates for those features are inside the PAR region. b) Feature Details view showing new GFF3 file information for the first 10 rows in the table. The Feature Details table displays all features selected in the Zoom View and their counterparts in other genomes open, sorted by Genome/start coordinate. Mouseover on any row in the table accents in bold the corresponding feature and its counterparts in the Zoom View (mouseover effect on GRCm38 feature G530011O06Rik shown). Also shown is expansion of the new Attributes column for row 2 (GRCm38 feature G530011O06Rik). Transcripts and exons can be included in the table using the “Show transcript:” and “Show exons:” options above the table.
Fig. 3.
Fig. 3.
The MGI mouse Pten gene detail page. The mouse gene detail page for Pten shows the integrated at-a-glance summary information associated with the gene in MGI. Summary data shown here is from MGI's curation pipelines, direct data submissions from researchers and integration of data from a large number of external resources. The page is divided into multiple data type sections with links into more detailed information within MGI and to data details at external sites.
Fig. 4.
Fig. 4.
Representation of PARX/PARY partners in MGI. The first two sections of the gene detail pages for PARX/PARY partners, G530011O06Rikx and G530011O06Riky are shown. a) Partial gene detail page for G530011O06Rikx. In the Summary section, gene nomenclature has suffix “x”, indicating the feature is a PARX partner (X chromosome homolog). Synonyms show gene nomenclature from Build 38 annotation. In the right column of the Summary section, the NCBI Gene ID links to the corresponding NCBI Gene record that represents both PARX and PARY homologs. In the new “Homologous PAR Feature” subsection, a reciprocal link is provided to the gene detail page for the PARY partner (G530011O06Riky) shown in panel b (arrows). The Location & Maps section shows genome coordinates on the X chromosome in the Sequence Map subsection and chr XY as the chromosome in the Genetic Map subsection. Links are provided to corresponding X chromosome regions in various genome browsers and a thumbnail view of the region is shown that links to JBrowse. The Genetic Map subsection has links to legacy mapping experiments for this gene, which are the source of its cM position. b) Similar view of the gene detail page for G530011O06Riky. The “y” suffix in gene nomenclature indicates the feature is a PARY partner (Y chromosome homolog), and previous (Build 38) gene nomenclature is shown under Synonyms. G530011O06Riky links to the same NCBI Gene record as does G530011O06Rikx (654820), and a reciprocal link to the PARX partner (G530011O06Rikx) is provided in the Homologous PAR Feature subsection (arrows). The Sequence Map subsection of G530011O06Riky shows genome coordinates from the Y chromosome, and chr XY as the Genetic Map chromosome.
Fig. 5.
Fig. 5.
MGI allele detail age for Ptentm1.1Gle. Information available about the allele includes nomenclature, mutation origin, project collection, and molecular details, when available, phenotype data, IMSR data for location of this mutation in a public repository, references. The phenotype details can be viewed by clicking on the toggles next to the high-level phenotype terms. Shown is the open toggle for “neoplasm.” Checkmarks for annotations to that term are provided to show easy comparison among the different genotypes involving the allele. Clicking the checkmarks will open a popup that shows the term, supporting references and annotation details including sex and genetic background effects if any.
Fig. 6.
Fig. 6.
MGI allele relationships to genetic markers. a) Marker relationships are shown in the Mutation Description section of allele detail pages and on allele summary pages. Shown are the Markers related to the deletion mutation Del(2Dlx1-Dlx2)1Jlr curated in MGI. Clicking the “View All” link will open a popup box showing details of the relationship of an MGI marker to the genetic mutation along with supporting references and curator notes. b) Exogenous genes and regulatory elements contained in inserted constructs in Tg(Camk2a-RAP2A*G12N)2Shng mice are shown in the Mutation Description section of allele detail pages. The human RAP2A mutant expressed gene and the mouse Camk2a driver are listed (arrows) and linked to the human gene record at NCBI and to MGI, respectively.
Fig. 7.
Fig. 7.
Connecting phenotypes and genotypes with the MGI SNP Query Form. A common path to the SNP Query Form starts by selecting the Strains, SNPs & Polymorphisms option on the MGI Home Page a), which leads to the Strains and SNPs landing page b), which includes the Strain Query form and various strain-related links. Selecting the Find SNPs option leads to the SNP Query Form, with the Search by Gene tab open by default c). The SNP search by gene begins by entering the gene or genes of interest into the Associated Genes section (1st arrow). Gene-based queries provide the option to extend the SNP search upstream and downstream of the gene(s) entered. The “include 2 kb upstream and downstream of the gene(s)” option is selected (2nd arrow). In the Strains and Strain Comparisons section, the option to Compare with one or more References strains is selected (3rd arrow). This option changes the strain display so users can select any strain as a Reference strain (R) or a Comparison strain (C), and mouseover on each strain opens a tooltip that shows the number of SNPs in MGI that involve that strain (see C57BL/6J in the strain selections area). The search specifies that only SNPs with allele calls in all Reference Strains should be returned (4th arrow), but relaxes this constraint for Comparison strains, allowing SNPs with no allele call in some Comparison strains to be returned (5th arrow). All SNPs returned must have an allele call in at least one Comparison strain with this option. The strain selection area lists available strains alphabetically, and when in comparison mode, displays Reference strain (R) and Comparison strain (C) options for each strain. Any number of strains can be selected as Reference or Comparison strains, but a selected strain can only be one or the other. To search for SNPs related to the albino phenotype associated with the tyrosinase gene, the Tyr gene symbol was entered in the Gene Symbol/Name field and Reference and Comparison strains were selected based on their coat color. Strains with black or agouti coat color were designated as Reference strains, while strains with albino (white) coat color were the Comparison strains d) (strain images from Jax Mice). The unfiltered search e) returns 28 SNPs (SNPs not shown). Opening the Allele Agreement filter shows three options, the second of which (arrow) restricts results to SNPs for which the allele in all Reference strains is the same AND the allele in all comparison strains differs from the reference strain allele. Applying this Allele Agreement filter restricts results to 10 SNPs f). An SNP density heatmap (panel f) provides an overview of the distribution of SNP results across the input genome region (the Tyr genomic region in this case). The result table lists the SNP rsID, genome location, category(ies) and associate gene(s), type of variation, and the allele summary across all strains. SNPs are sorted by chromosome and genome coordinates. The SNP allele calls for each strain follow, with Reference strains (orange) grouped together and listed before Comparison strains. Two SNPs have no allele call in some comparison strains, a condition allowed in the search parameters (panel c). The last SNP in the result table (rs31191169) has been linked to albinism (Jackson and Bennett 1990; Yokoyama et al. 1990; Munz et al. 2021).
Fig. 8.
Fig. 8.
MGI strain detail page for A/J mouse strain. The strain detail page for the inbred mouse strain A/J contains summary at a glance information about the strain. Links are provided to additional strain measurement data at Mouse Phenome Database and to comparative genomes at using the MGV tool. Associated SNP, mutations and QTL, phenotypes and disease are shown and clicking links will show mutation and annotation details. Strain availability is shown via links to IMSR.
Fig. 9.
Fig. 9.
MGI Gene Ontology classifications for the mouse Pten gene. The detail page for all GO annotations to the mouse Pten gene found when clicking the “all” annotations link from the gene detail page is shown. The summary functional information provided by the Alliance of Genome Resources is shown at the top of the page and a tabular summary of annotations is shown at the bottom. A graphical view is also available (not shown).
Fig. 10.
Fig. 10.
Assay detail page for an immunohistochemistry experiment. Only the upper part of the entry is shown. Arrow points to the expression results for specimen S3A, which are annotated in a modular way by combining terms from the anatomy and cell ontology.
Fig. 11.
Fig. 11.
GXD Expression Profile Search. a) Expression Profile query form showing a search for genes with expression detected in two structures (forebrain and midbrain) and not detected (or assayed in) two structures (hindbrain and spinal cord). Conditions for each row of the profile are combined with a Boolean AND in the query. b) Assay results tab of resulting search summary, filtering options are encircled in red. c) Images tab from the same search summary, showing the first 3 of 3,464 images. Arrows in panels b and c indicate links from the summaries to Assay Detail pages (such as the one shown on Fig. 10).
Fig. 12.
Fig. 12.
Comparing the expression and phenotype pattern for a specific gene. The Gene Expression + Phenotype Matrix displays the expression and phenotype data for a selected gene in the same anatomical matrix view. The gene Pten is shown as an example, with the “exocrine system” expanded along the anatomy axis. The wild-type expression pattern of Pten is displayed in the first column (gold header). The following columns show the anatomical structures phenotypically affected in different Pten mutant mice (different Pten alleles). The coloring of the matrix cells gets progressively darker as the number of expression and phenotype annotations increases; the conventions are defined in the matrix legend (inset).
Fig. 13.
Fig. 13.
The human–mouse disease connection search and results. a) The upper section of the HMDC search tool allows you to select multiple fields to search using either Boolean AND or OR. Shown are two selected search fields, Human Genome Location and Disease or Phenotype Name. The chromosome 10 region spanning from 87860000 to 89970000 is entered in the search box and human was selected from the radial buttons below the search box. Searching by a human region returns all the human genes included or overlapping that region and all of the mouse orthologs of those human genes. A second search field was selected by using the “Add” button and selecting Disease or Phenotype Name. To search for genes associated with nervous system phenotypes “nervous system” was entered in the search field. Name searches will look for terms in the MP, HP, or DO that contain all of the words entered in the text field. Annotations to the matching term or any descendent of the matching term are included in the results. Thus, the search for nervous system will return phenotypes like tonic–clonic seizures (MP:0003997), Meningioma (HP:0002858), or familial meningioma (DOID:4586) as they are descendants of terms that include the words “nervous system” in each the ontology. b)The lower section shows search results organized into three tabs. The first results tab (shown) is a summary overview grid of gene by phenotype and disease. In the example search, the grid includes for human genes all the phenotypes and diseases for any disease that is associated with at least one phenotype in the nervous system. For the mouse genes the grid includes all phenotypes and diseases for genotypes containing alleles of that gene that have at least one nervous system phenotype. For example, the genotype Ptentm1.1Hwu/Ptentm1.1Hwu is included in the results as it has the phenotype “wavy neural tube” and the human ortholog PTEN is in the chromosome region. However, the genotype Ptentm1.1Hwu/Ptentm1.1Hwu is not included in the results set because it does not have any annotations for nervous system phenotypes. Human data are represented by shades of orange in cells of the summary grid, while mouse data are represented by shades of blue. Darker shades indicate more data. Columns that contain at least one matching term in at least one cell are highlighted in purple. In the figure, the column for “immune system” is highlighted because the term “brain inflammation” (MP:0001847) has parents in both the immune and nervous systems. c) Clicking on a cell in the grid will open a popup that displays the detailed annotations. The popup for the cell “cardiovascular system X PTEN/Pten” shows the set of HP or MP terms in the cardiovascular system for each disease associated with human PTEN or for each genotype for mouse Pten. Clicking on a row with human data will open the term at the HPO website. Clicking on a row with mouse data will open the genotype detail page in MGI.
Fig. 14.
Fig. 14.
The human–mouse disease connection term matching tool. a) When searching the HMDC by IDs, multiple IDs in a single field are connected by Boolean OR in the search. Searching by HP IDs returns only human genes and searching by MP IDs returns only mouse genes as the ID search does not go across ontologies unlike the name search. In the image searching for “HP:0000177, HP:0000175” returns human genes associated with either Cleft palate (HP:0000175) or Abnormal upper lip morphology (HP:0000177) but no mouse genes as seen by the presence of only orange cells in the grid. Clicking the “Add related phenotype terms by ID (BETA)” button opens the MP–HP matching tool and fills in the search box with any IDs already entered in the HMDC search box. b) Multiple IDs can be searched for at the same time. Sets of matched terms are grouped and zebra striping indicates each grouping. The search term and definition of that term in the respective ontology are shown in the first 2 columns. Match Method and Match Type are shown in the next 2 columns. The matched term, synonyms, and definition are in the next 3 columns. Synonyms and definitions are taken from the respective ontology. The final column allows the user to select specific terms for inclusion in the search. Clicking “Add IDs to HMDC search” adds all selected IDs and any IDs entered in the search box to the HMDC search. c)After adding terms from the match tool and running the search again the grid now includes both human and mouse genes that are associated with at least one of the phenotype terms.

References

    1. Gene Ontology Consortium; Aleksander SA, Balhoff J, Carbon S, Cherry JM, Drabkin HJ, Ebert D, Feuermann M, Gaudet P, Harris NL, et al. 2023. The Gene Ontology knowledgebase in 2023. Genetics. 224(1):iyad031. doi: 10.1093/genetics/iyad031. - DOI - PMC - PubMed
    1. Alliance of Genome Resources Consortium . 2019. The alliance of genome resources: building a modern data ecosystem for model organism databases. Genetics. 213(4):1189–1196. doi: 10.1534/genetics.119.302523. - DOI - PMC - PubMed
    1. Alliance of Genome Resources Consortium . 2020. Alliance of Genome Resources Portal: unified model organism research platform. Nucleic Acids Res. 48(D1):D650–D658. doi: 10.1093/nar/gkz813. - DOI - PMC - PubMed
    1. Alliance of Genome Resources Consortium . 2022. Harmonizing model organism data in the Alliance of Genome Resources. Genetics. 220(4):iyac022. doi: 10.1093/genetics/iyac022. - DOI - PMC - PubMed
    1. Antin PB, Yatskievych TA, Davey S, Darnell DK. 2014. GEISHA: an evolving gene expression resource for the chicken embryo. Nucleic Acids Res. 42(D1):D933–D937. doi: 10.1093/nar/gkt962. - DOI - PMC - PubMed

Publication types