. 2024 May 6;59(9):1132-1145.e6.
doi: 10.1016/j.devcel.2024.03.004. Epub 2024 Mar 25.

Spatial patterning controls neuron numbers in the Drosophila visual system

Affiliations

Spatial patterning controls neuron numbers in the Drosophila visual system

Jennifer A Malin et al. Dev Cell. .

Abstract

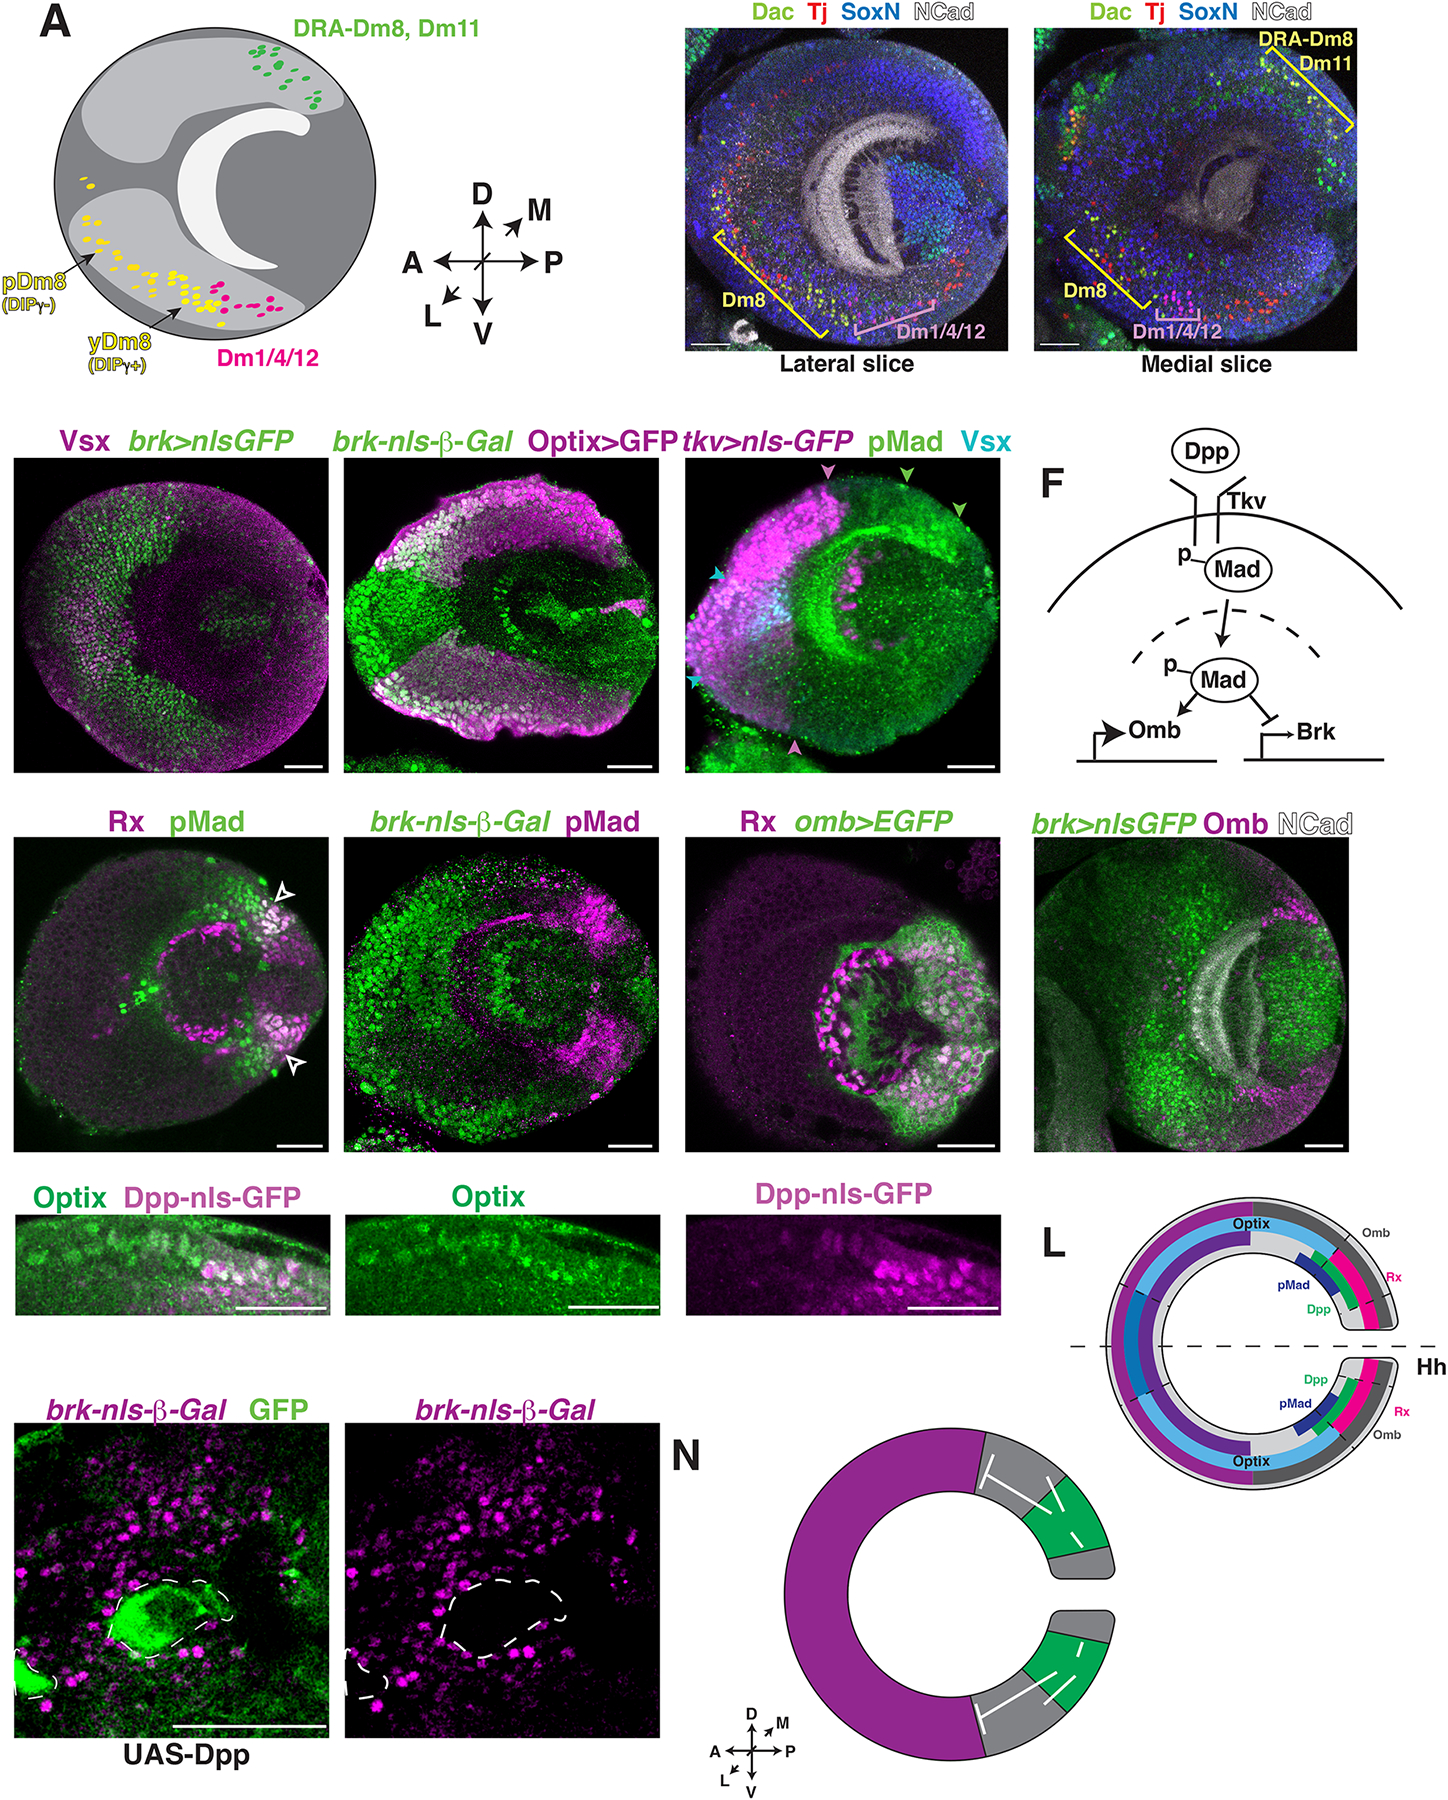
Neurons must be made in the correct proportions to communicate with the appropriate synaptic partners and form functional circuits. In the Drosophila visual system, multiple subtypes of distal medulla (Dm) inhibitory interneurons are made in distinct, reproducible numbers-from 5 to 800 per optic lobe. These neurons are born from a crescent-shaped neuroepithelium called the outer proliferation center (OPC), which can be subdivided into specific domains based on transcription factor and growth factor expression. We fate mapped Dm neurons and found that more abundant neural types are born from larger neuroepithelial subdomains, while less abundant subtypes are born from smaller ones. Additionally, morphogenetic Dpp/BMP signaling provides a second layer of patterning that subdivides the neuroepithelium into smaller domains to provide more granular control of cell proportions. Apoptosis appears to play a minor role in regulating Dm neuron abundance. This work describes an underappreciated mechanism for the regulation of neuronal stoichiometry.

Keywords: BMP signaling; Drosophila; cell number; neural development; optic lobe; spatial patterning.


Conflict of interest statement

Declaration of interests The authors declare no competing interests.

Figures

Figure 1.
Figure 1.. Anatomy and neuronal specification mechanisms of the optic lobe.
(A) Graphical representation of the optic lobe with the retina and four neuropils: the lamina, medulla, lobula and lobula plate. The medulla contains over 100 cell types, roughly 20 of which are Distal medulla neurons. Some, like Dm8 (green), possess many neurons (~550 cells per optic lobe); others, like Dm11 (red), are less numerous (70 cells per optic lobe). Dm4 has 40 neurons per optic lobe (blue), and Dm12 (purple) has 120. A= Anterior, P= Posterior, M= Medial, L= Lateral. (B) 800 photoreceptor ommatidia (stained by Chaoptin) project their axons into the medulla. Scale bar = 10μm. (C) Dm8 possesses roughly ~550 cells per optic lobe. They are labeled by Multicolor Flip Out (MCFO), in which each neuron stochastically expresses a combination of HA, V5, and FLAG tags to individually label each cell type and their morphology. (D) Dm11 (also stained by MCFO) possesses roughly 70 cells per optic lobe. (E) Neural stem cells called neuroblasts express a series of temporal Transcription Factors (tTFs) as they age, the output of which directs neural patterning. Non= NotchON, GMC= ganglion mother cell (design of this panel was inspired by the original authors, see Konstantinides et al., 2022). (F) Medulla neurons are born from the Outer Proliferation Center (OPC), which is spatially subdivided based on the non-overlapping expression of transcription factors and growth factors. D= Dorsal, V= Ventral, A= Anterior, P= Posterior, L= Lateral, M= Medial. Carats indicate the direction of neuroblast-producing neurogenic wave. (G) The OPC is dorsoventrally divided by Spalt and Disco expression. (H) Fate mapping of medulla neurons born from Hth temporal window. Mi1s (gray), present at a 1:1 ratio of neurons to photoreceptor columns, are born from the entire main OPC. Pm2 (green) and Pm3 (blue) are less abundant and are born from neuroblasts derived from smaller OPC domains. Pm1 (not shown) is generated from the ventral OPC.
Figure 2.
Figure 2.. Fate mapping of Distal medulla neurons.
(A) Technical approach for genetic fate mapping cassette: A ubiquitous promoter (actin/ubiquitin) drives an FRT-Stop cassette-FRT-nuclear localized reporter (lacZ or GFP); the stop cassette is excised by expression of Flp recombinase under the control of each spatial factor controlling GAL4. Neurons born from each neuroepithelial domain are thus permanently marked. (B) pxb, Optix, vOptix, dOptix, and hh lines were FACSorted and subjected to scRNAseq to identify the spatial origin for each cell type. Average normalized abundance of the Dm clusters in datasets produced either in the whole optic lobe or from neurons from the FACSed datasets. The error bars represent the minimal and maximal values across all libraries of a dataset. The asterisks indicate when at least 1 library had fewer than 3 cells of a given cell type, or if the annotations were made with low confidence. Below the graph represents the expected cell number and spatial origin of each cell type. This is based on the scRNAseq data as well as inferences made from all other experiments from the paper (see Table S1, Methods). (C-N) Representative example of spatial transcription factor fate mapping experiments. Scale bar = 5μm. Open carat= lack of expression. Filled carat = presence of expression. Animals scored are adults. Dm3 neurons express the Pxb/Vsx lineage trace (C-C’), Optix lineage trace (D-D’) and Hh lineage trace (E-E’). (F) Graphical representation of Dm3 origin (based on information from Fig. 1B–E as well as Table S1). Dm15 neurons express the Pxb/Vsx lineage trace (G-G’), and the Optix lineage trace (H-H’), but not the Hh lineage trace (I-I’). (J) Graphical representation of Dm15 origin (based on information from Fig. 1B, G–I as well as Table S1). Dm4 neurons do not express the Pxb/Vsx lineage trace (K-K’) but do express the Optix (L-L’) and Hh lineage traces (M-M’). (N) Graphical representation of Dm4 origin (based on information from Fig. 1B, K–M as well as Table S1).
Figure 3.
Figure 3.. Apoptosis plays a minor role in regulating Dm neuron number.
(A) Inhibition of apoptosis via elav-GAL4; UAS-p35 transgene expression provides limited increases in cell number. Number within bars= number of animals scored, Error bars: standard deviation, T-test. (B) Apoptosis inhibition via miRNA against rpr/hid/grim, dronc RNAi, dronc-DN, or Optix-GAL4; UAS-p35 mutants leads to significant increases in Dm4 number. Error bars: standard deviation, small number within bars= number of animals scored, T-test. ns = not significant.
Figure 4.
Figure 4.. Mutually exclusive brinker and dpp expression delineates a second spatial patterning axis.
(A) Model for Optix spatial subpatterning of yDm8, pDm8, DRA-Dm8, Dm11, Dm1, Dm4 and Dm12 (See also Table S1. Dm8 data from Courgeon and Desplan, 2019). Lightest gray domain: medulla neuropil; Medium gray domain: Optix region; Darkest gray domain: rest of optic lobe. D= Dorsal, V= Ventral, A= Anterior, P= Posterior, L= Lateral, M= Medial. (B-B’) Dac+Tj+ y/pDm8s are born from the anterior 2/3 of the ventral Optix domain (a few Dac+ Tj+ cell bodies are also found in the medial Vsx domain), while SoxN+Tj+ Dm1/4/12 neurons are born from the posterior 1/3 of the ventral Optix domain. (B) Lateral slice, (B’) Medial slice. (C) Vsx expression sits completely within the brk-GAL4; UAS-nls-sfGFP OPC domain. Carat: border of Vsx OPC domain. (D) brk-nulacZ is expressed within the anterior 2/3 of the Optix region. Carat: border of Brk expression. (E) The Type I Receptor tkv (tkv-GAL4; UAS-nls-GFP) is expressed in a domain similar to brk expression (see Figure 4C). Magenta carat: border of Tkv expression, green carat: border of pMad expression, cyan carat: border of Vsx OPC expression. (F) Graphical representation of the Dpp signaling pathway. (G-J) Immunostaining experiments suggest that Dpp signaling pathway components are expressed in the third larval instar OPC in a manner similar to previously described systems. (G) pMad is expressed at the edge of the Rx domain, and into the Optix domain. Carat: region of overlap. (H) brk-nuLacZ and pMad share mutually exclusive OPC expression patterns. Carat: edge of Brk expression. (I) Omb is expressed within the Rx domain, and slightly outside. Carats: region of Omb/Rx overlap. (J) Omb expression sits adjacent to Brk. (K-K”). Optix protein expression overlaps with dpp-GAL4; UAS-nls-GFP. Carat: cells with overlapping Dpp/Optix expression. (L) Graphical representation of Dpp component expression patterns. (M-M’) brk-nulacZ expression is disrupted in UAS-dpp overexpression Flp-out clones. Dotted lines: region of disrupted brk-nulacZ expression where Dpp is overexpressed. (N) Model for relationship between Dpp and Brk signaling. Scale bar: 30μm.
Figure 5:
Figure 5:. brk or dpp overexpression during larval development impacts Dm neuron number.
(A) Image quantification. Error bars = standard error of the mean. Small number inside bars= number of optic lobes scored. P value calculated using Chi-Square test. (B) Wild-type Dac+Tj+ Dm8 and SoxN+Tj+ Dm1/4/12 neurons. (B’) Graphical representation of (B); Lightest gray domain: medulla neuropil; Medium gray domain: Optix region; Darkest gray domain: rest of optic lobe. (C) Optix-GAL4; UAS-dpp larvae show more Dm/1/4/12 neurons. (C’) Graphical representation of (C). (D) Optix-GAL4; UAS-dpp RNAi larvae show an increase in Dm8 neurons. (D’) Graphical representation of (D). (E) Optix-GAL4; UAS-brk larvae have fewer Dm1/4/12 neurons. (E’) Graphical representation of (E). (F) Optix-GAL4; UAS-brk RNAi larvae have fewer Dm8 neurons. (F’) Graphical representation of (F). Yellow bracket: Dm8, Pink bracket: Dm1/4/12. Scale bar: 30μm. (G) Quantification of Tj+ cells in (B) through (F). Error bars = standard error of the mean. Small number inside bars= number of optic lobes scored. P value calculated using T-test.
Figure 6:
Figure 6:. scRNAseq of fluorescently labeled lineage tracing lines identifies additional spatial patterning required for Dm neuron fate and stoichiometry.
(A) dpp-GAL4; UAS-nls-GFP lines were FACSorted and subjected to scRNAseq to identify the spatial region of origin for each cell type. Average normalized abundance of the Dm clusters in datasets produced either in the whole optic lobe or from neurons from the FACSed datasets. The error bars represent the minimal and maximal values across all libraries of a dataset. The asterisks indicate when at least 1 library had less than 3 cells of a given cell type, or that the annotations were made with low confidence. Below the graph is the expected stoichiometry of each cell type. (B) SoxN+Tj+ (Dm1/4/12) neurons are produced both inside (carat, likely Dm12) and outside (empty carat, likely Dm1/4) the Dpp expression domain. Dotted line: medulla cortex outline. (B’-B”) Inset. Dotted line: region of dpp>>myrGFP expression. (B”’) Graphical representation of B-B” (See Table S1 for Dm1/4/12 positioning). (C) Some dorsal Dac+Tj+ (DRA-Dm8 and/or Dm11) neurons sit outside the Dpp region (empty carat), while other dorsal Dac+Tj+ (Dm11) neurons sit within the Dpp region. (C’-C”) Inset. (C”’) Graphical representation of C-C”. (D) Graphical representation of Dm neuron origins within the OPC (Question mark: Dm9 origin is less clear; see Table S1); temporal windows for each cell type are a rough estimate based on scRNAseq data. (E) Correlation between neuroepithelial domain size and neuron number. GFP-expressing lines for each spatial factor were imaged and each spatial domain was measured at its widest point; its area was then calculated (Table S2). Each neuron was given a spatial identity, the rationale for which is described in Table S1, which was then further characterized if the neuron was born from a smaller spatial subdomain (i.e., Dm4 from 1/6 of the ventral Optix domain). The linear plot of OPC domain of origin vs. number of neurons per optic lobe was plotted for each neuron class (R2= 0.9029, P=<0.0001). For all images, scale bar: 30μm. Dm9 was omitted from the linear model as its spatial origin was uncertain (Table S1).
Figure 7:
Figure 7:. Model: Spatial signaling regulates cell proportions.
Three intersecting spatial patterning mechanisms, one using morphogen signaling (Dpp/Brk) and the other two using transcription factor expression (Vsx/Optix/Rx and Salm/Disco+Hh) act to specify Dm neuron fates in different numbers.

References

    1. Yan W, Laboulaye MA, Tran NM, Whitney IE, Benhar I, and Sanes JR (2020). Mouse Retinal Cell Atlas: Molecular Identification of over Sixty Amacrine Cell Types. Journal of Neuroscience 40, 5177–5195. 10.1523/JNEUROSCI.0471-20.2020. - DOI - PMC - PubMed
    1. Nern A, Pfeiffer BD, and Rubin GM (2015). Optimized tools for multicolor stochastic labeling reveal diverse stereotyped cell arrangements in the fly visual system. Proceedings of the National Academy of Sciences 112, E2967–E2976. 10.1073/pnas.1506763112. - DOI - PMC - PubMed
    1. Sanes JR, and Zipursky SL (2010). Design Principles of Insect and Vertebrate Visual Systems. Neuron 66, 15–36. 10.1016/j.neuron.2010.01.018. - DOI - PMC - PubMed
    1. Morante J, and Desplan C (2008). The color-vision circuit in the medulla of Drosophila. Current biology : CB 18, 553–565. 10.1016/j.cub.2008.02.075. - DOI - PMC - PubMed
    1. Fischbach KF, and Dittrich APM (1989). The optic lobe of Drosophila melanogaster. I. A Golgi analysis of wild-type structure. Cell and Tissue Research 258, 441–475. 10.1007/BF00218858. - DOI

Publication types

MeSH terms

Substances

LinkOut - more resources