. 2024 Mar;21(212):20230730.
doi: 10.1098/rsif.2023.0730. Epub 2024 Mar 27.

Multipad agarose plate: a rapid and high-throughput approach for antibiotic susceptibility testing

Affiliations

Multipad agarose plate: a rapid and high-throughput approach for antibiotic susceptibility testing

Morten Kals et al. J R Soc Interface. 2024 Mar.

Abstract

We describe a phenotypic antibiotic susceptibility testing (AST) method that can provide an eightfold speed-up in turnaround time compared with the current clinical standard by leveraging advances in microscopy and single-cell imaging. A newly developed growth plate containing 96 agarose pads, termed the multipad agarose plate (MAP), can be assembled at low cost. Pads can be prepared with dilution series of antibiotics. Bacteria are seeded on the pads and automatically imaged using brightfield microscopy, with a fully automated segmentation pipeline quantifying microcolony formation and growth rate. Using a test set of nine antibiotics with very different targets, we demonstrate that accurate minimum inhibitory concentration (MIC) measurements can be performed based on the growth rate of microcolonies within 3 h of incubation with the antibiotic when started from exponential phase. Faster, reliable and high-throughput methods for AST, such as MAP, could improve patient care by expediting treatment initiation and alleviating the burden of antimicrobial resistance.

Keywords: antibiotic susceptibility testing; antimicrobial resistance; imaging bacteria.


Conflict of interest statement

A.D. declares to work for a company that operates in the application areas described in this work, but has no direct conflict of interest.

Figures

Figure 1.
Figure 1.
An overview of how to use the MAP for AST. A bacteria culture in the exponential phase is pipetted onto the MAP platform that has been prepared with pads containing eight antibiotic dilution series. The platform is then imaged with brightfield microscopy. The resulting images are processed with a fully automated analysis pipeline that segments the microcolonies and tracks their growth rates. The growth rates are then used to determine the susceptibility and the minimum inhibitory concentration (MIC) of the antibiotics.
Figure 2.
Figure 2.
The MAP platform can be used to measure bacteria growth automatically with high resolution and reproducibility. (a) Schematic of the MAP. The platform features 96 square pads of 4 mm size, arranged in a 12 × 8 grid with 9 mm pitch. The standard well-plate format facilitates compatibility with standard multichannel pipettes and stage holders. (b) A detailed cross-sectional view of the MAP illustrates the path of brightfield illumination. The light traverses through the base plate and agarose pad before intersecting with the imaging plane. Like most biology labs, we use inverted microscopy, where the objective is located below the sample. The acrylic base and well plates are kept together using the same design of adhesive sheet that glues the glass slide to the well plate. The bacteria sample grows in the interface between the agarose pad and the glass slide. (c) Cropped frames with time-series microcolony growth of E. coli on LB broth with 1% w/v agarose at 37°C. This sequence of images illustrates the expansion of a colony-forming unit (CFU) into a microcolony. The border marks the colony segmentation masks. Time is reported as time after imaging is started, which is typically 20 to 30 min after the bacteria are placed on the pads. After 2.5 h of growth, the microcolony is still growing in a single layer, but half an hour later, stacking has started to occur. (d) Varying the agarose concentration does not significantly affect the growth rate between 0.069 to 2% w/v. For low agarose concentrations, growth rates cannot be consistently tracked, leading to very large standard deviations. The data represent 12 replicate pads for two repeat experiments. The arrow indicates how 1% was chosen as optimal. Electronic supplementary material, figure S1. A shows how the MAP platform was set up. (e) Varying the optical density (OD600) of the liquid bacteria samples placed on each pad affects the density of CFUs. Each line represents the average colony area growth rate over time after imaging is started on the microscope. The lines terminate when there are less than four colonies tracked for a given condition. The data represent seven replicate pads per seeding density. The arrow shows that an OD of 0.02 was used for further experiments. Electronic supplementary material, figure S1.B shows how the MAP platform was set up. (f) Frame sections from the first 10 min of imaging illustrate how seeding densities typically look on the pads. Below OD 0.002, most FOVs do not have any bacteria present. (g) An assessment of cross-contamination between adjacent pads on the MAP shows individual pads are unaffected by their neighbours. Test pads containing 0 μg ml−1 of antibiotic were placed around pads containing 50 μg ml−1 of antibiotic, and vice versa. Each data point in the plot represents the growth rate of a single colony within the initial 3 h after imaging was started. Each repeat contains data from about 12 pads per condition. Electronic supplementary material, figure S1.C shows how the MAP platform was set up. (h) The E. coli exhibit little to no variation in growth rate for different wavelengths of brightfield illumination during time-lapse imaging. In total, 395, 450, 530 and 660 nm light was tested, corresponding to ultraviolet, blue, green and red, respectively. The arrow shows that 450 nm was chosen as optimal. The data represent 12 replicate pads per illumination wavelength for three repeat experiments. Electronic supplementary material, figure S1.D shows how the MAP platform was set up. (i) Images are included after 2 h of growth to illustrate how bacteria look when illuminated by the different wavelengths.
Figure 3.
Figure 3.
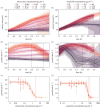
The MAP platform is used to perform AST on monocultures of E. coli using a test set of nine antibiotics. (a) Colony areas develop over time for varying concentrations of tetracycline. The areas in this plot represent standard deviation, and the lines terminate in points where most colonies grow to exceed the FOV and tracking for that pad is stopped. All experiments comprise data from four repeat experiments. (b) Colony growth rates develop over time for varying concentrations of tetracycline. Growth rates are calculated based on the time derivative of the colony area curve for each colony individually (see §2.5 for details). The dashed growth-rate region between 2 and 3 h indicates the time span used for evaluating AST. (c) Growth rates are assessed for different concentrations of tetracycline. Each point in this plot is computed as the average growth rate for that given concentration in the dashed region from b, with error bars corresponding to the standard deviation. In these plots, any negative growth rate is considered spurious and set to zero. Hill curves have been independently fitted for each of four repeats, and the associated IC90 concentration is indicated with a vertical dashed line. For the four repeats, IC90 is computed to be 2.5, 2.4, 2.8 and 2.5 μg ml−1, respectively. (d) Considering ampicillin, we see how colony areas initially develop in a similar fashion regardless of antibiotic concentration. See (a) for details about the plot. (e) We see significant changes in growth rate over time for higher concentrations of ampicillin. (f) There is a high correspondence between the four repeats with ampicillin. For the four repeats, IC90 is computed to be 71, 74, 85 and 110 μg ml−1 respectively.
Figure 4.
Figure 4.
The AST results from the MAP platform correspond well with the results obtained from broth microdilution, ETest and EUCAST tabulated data. (a) Overview of all Hill fits, with each of the nine antibiotics we evaluated. The shaded area corresponds to the standard deviation between the Hill curve fits of the four independent repeats. (b) Comparing MIC obtained from MAP with that obtained from broth microdilution for the set of antibiotics. The dashed line is drawn for x = y. The closer to this line the data points fall, the better they correspond. (c) Comparing MIC measured by MAP with broth microdilution and ETest comparison assays using the same strain of E. coli and LB growth media. Error bars are computed based on the standard deviation between repeats and the factor of two concentration steps. The EUCAST data is based on the EUCAST database of MIC distributions for wild-type E. coli, where the error bars represent the first and third quartile [38]. (d) Lower triangular matrix showing Pearson’s correlation coefficient for the four methods. (e) Lower triangular matrix showing Spearman’s rank correlation coefficient for the four methods.

References

    1. Murray CJL, et al. 2022. Global burden of bacterial antimicrobial resistance in 2019: a systematic analysis. Lancet 399, 629-655. (10.1016/S0140-6736(21)02724-0) - DOI - PMC - PubMed
    1. WHO. 2020. Antibiotic resistance. See https://www.who.int/news-room/fact-sheets/detail/antibiotic-resistance (accessed 28 June 2023).
    1. Ellington MJ, et al. 2017. The role of whole genome sequencing in antimicrobial susceptibility testing of bacteria: report from the EUCAST subcommittee. Clin. Microbiol. Infect. 23, 2-22. (10.1016/j.cmi.2016.11.012) - DOI - PubMed
    1. Adam M, Murali B, Glenn NO, Potter SS. 2008. Epigenetic inheritance based evolution of antibiotic resistance in bacteria. BMC Evol. Biol. 8, 52. (10.1186/1471-2148-8-52) - DOI - PMC - PubMed
    1. Ackermann M. 2015. A functional perspective on phenotypic heterogeneity in microorganisms. Nat. Rev. Microbiol. 13, 497-508. (10.1038/nrmicro3491) - DOI - PubMed

Publication types

LinkOut - more resources