. 2024 Mar 26;15(1):2639.
doi: 10.1038/s41467-024-46784-w.

Using rare genetic mutations to revisit structural brain asymmetry

Affiliations

Using rare genetic mutations to revisit structural brain asymmetry

Jakub Kopal et al. Nat Commun. .

Erratum in

  • Author Correction: Using rare genetic mutations to revisit structural brain asymmetry.
    Kopal J, Kumar K, Shafighi K, Saltoun K, Modenato C, Moreau CA, Huguet G, Jean-Louis M, Martin CO, Saci Z, Younis N, Douard E, Jizi K, Beauchamp-Chatel A, Kushan L, Silva AI, van den Bree MBM, Linden DEJ, Owen MJ, Hall J, Lippé S, Draganski B, Sønderby IE, Andreassen OA, Glahn DC, Thompson PM, Bearden CE, Zatorre R, Jacquemont S, Bzdok D. Kopal J, et al. Nat Commun. 2024 Apr 10;15(1):3098. doi: 10.1038/s41467-024-47545-5. Nat Commun. 2024. PMID: 38600109 Free PMC article. No abstract available.

Abstract

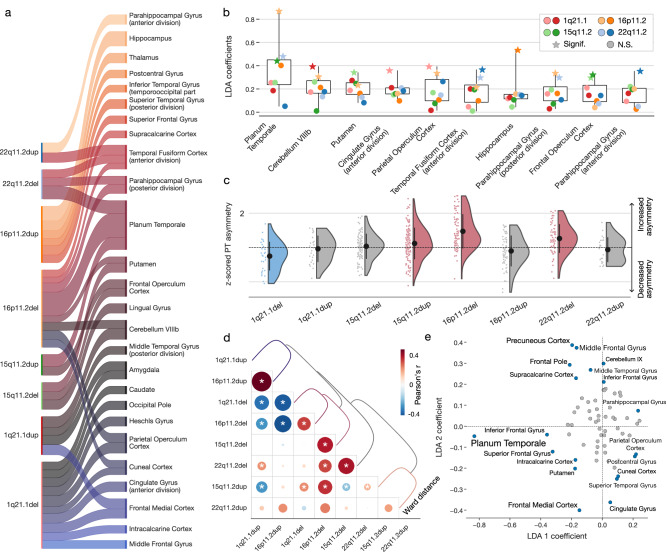
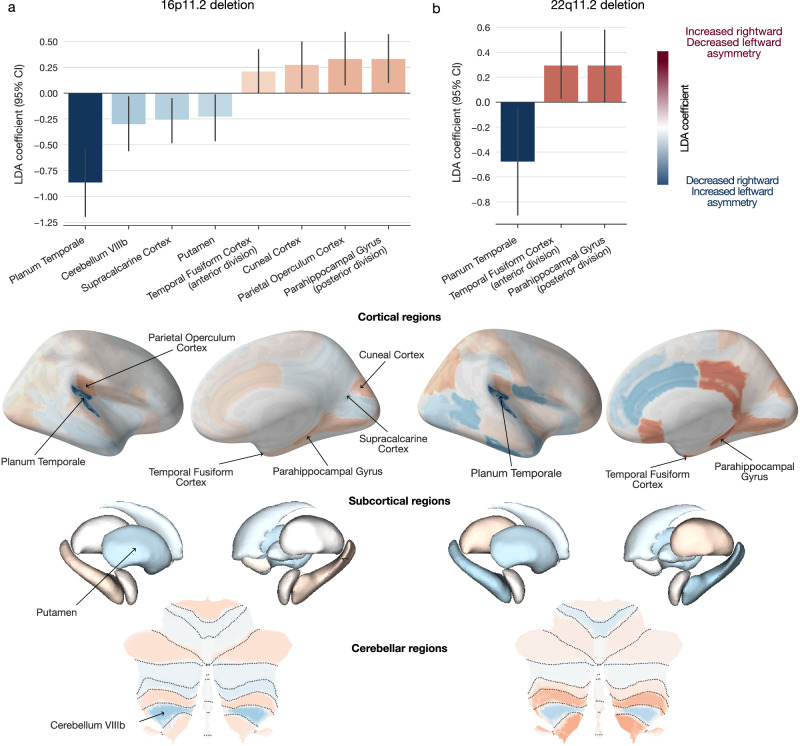
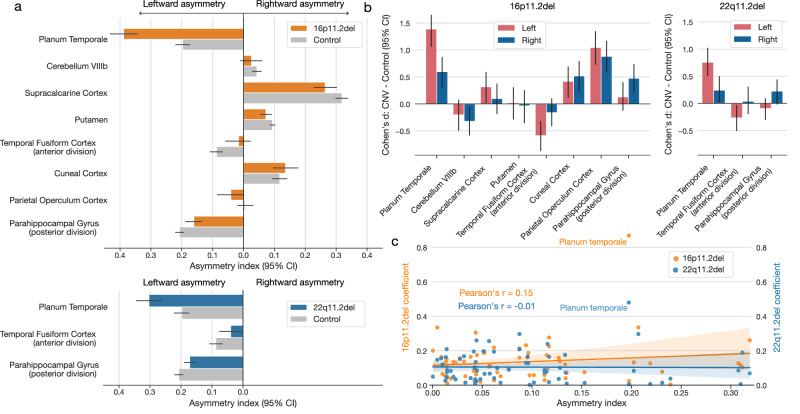
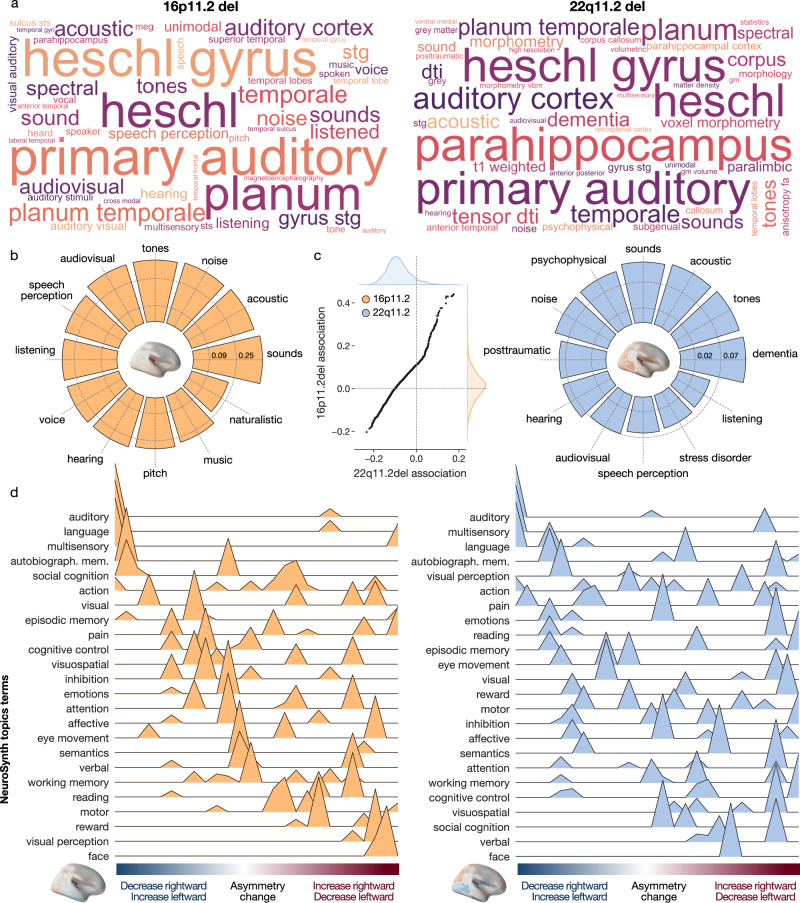
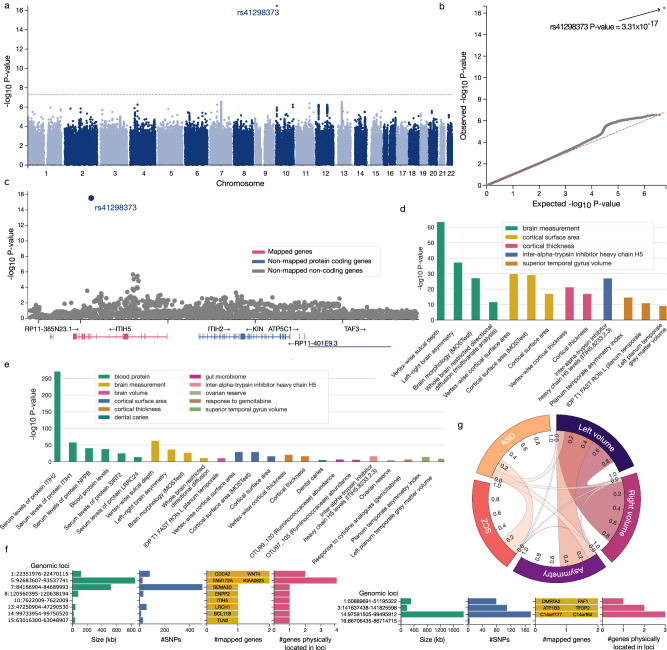
Asymmetry between the left and right hemisphere is a key feature of brain organization. Hemispheric functional specialization underlies some of the most advanced human-defining cognitive operations, such as articulated language, perspective taking, or rapid detection of facial cues. Yet, genetic investigations into brain asymmetry have mostly relied on common variants, which typically exert small effects on brain-related phenotypes. Here, we leverage rare genomic deletions and duplications to study how genetic alterations reverberate in human brain and behavior. We designed a pattern-learning approach to dissect the impact of eight high-effect-size copy number variations (CNVs) on brain asymmetry in a multi-site cohort of 552 CNV carriers and 290 non-carriers. Isolated multivariate brain asymmetry patterns spotlighted regions typically thought to subserve lateralized functions, including language, hearing, as well as visual, face and word recognition. Planum temporale asymmetry emerged as especially susceptible to deletions and duplications of specific gene sets. Targeted analysis of common variants through genome-wide association study (GWAS) consolidated partly diverging genetic influences on the right versus left planum temporale structure. In conclusion, our gene-brain-behavior data fusion highlights the consequences of genetically controlled brain lateralization on uniquely human cognitive capacities.


Conflict of interest statement

DB is a shareholder and advisory board member of MindState Design Labs, USA. OAA is a consultant to Cortechs.ai. PT obtained grant support from Biogen, Inc., for research unrelated to this manuscript. The remaining authors declare no competing interests.

Figures

Fig. 1
Fig. 1. Eight key CNVs lead to unique effects on brain asymmetry that spotlight the planum temporale.
We probed the effects of eight CNVs on brain asymmetry (deletions and duplications at 1q21.1 distal, 15q11.2 BP1-BP2, 16p11.2 proximal, 22q11.2 proximal loci). For that purpose, we estimated eight LDA models encompassing multivariate prediction rules separating respective CNV carriers and healthy controls in terms of regional left-right deviations. a Significant LDA coefficients across eight key CNVs. The sankey plot depicts all LDA coefficients surpassing the bootstrap significance test. The width of the ribbon corresponds to the coefficient magnitude. Planum temporale and fusiform cortex asymmetries are both significantly associated with three CNVs. b Overall strongest coefficients across eight LDA models. The boxplots depict LDA coefficients across the 8 CNVs (the box extends from the first quartile to the third quartile and the whiskers extend to the 1.5x the inter-quartile range). Lighter symbols represent deletions, while darker symbols represent duplications. Star denotes a significant coefficient based on the bootstrap significance test. c Detailing the effects on planum temporale. Rain cloud plots summarize the effects of each CNV on the asymmetry of planum temporale. The y-axis shows raw asymmetry indices (no LDA model), z-scored using control participants. While the 15q11.2 duplication, 16p11.2 deletion, and 22q11.2 deletion increase the asymmetry, 1q21.1 deletion decreases the asymmetry. The color (blue – decrease, red – increase) depicts a significant change in mean asymmetry based on a two-sided t-test with FDR-corrected P < 0.05. d Comparison of brain-wide asymmetry patterns. We calculated Pearson’s correlation to quantify the similarity between every pair of LDA coefficient sets (vectors) from the eight models. Asterisk denotes FDR-corrected P-values obtained from spin permutation. Hierarchical clustering of model-specific coefficients obtained per CNV display distances (similarities) among studied asymmetry patterns based on Ward’s method. Distinct clusters separating deletions and duplications provide further evidence of their opposing effects. e Regions separating different CNVs. Region-wise coefficients are plotted along the two leading components of the multiclass LDA model designed to separate between the eight CNVs. CNVs lead to distinct brain asymmetry patterns in which the planum temporale plays a prominent role.
Fig. 2
Fig. 2. Genomic deletions at 16p11.2 and 22q11.2 loci lead to distinctive brain asymmetry patterns.
For deletions at the 16p11.2 and 22q11.2 loci, we estimated two dedicated LDA models to separate between the carriers of a particular CNV and controls based on 65 left-right asymmetry measures of brain atlas volumes. Each ensuing LDA model encompassed 65 coefficient estimates that pertained to 65 brain regions that quantify the contributions to the separating multivariate asymmetry patterns. a LDA-derived brain asymmetry effects for 16p11.2 deletion. The bar plot depicts the eight high-effect-size regions that display significant LDA coefficients based on bootstrap testing. The negative planum temporale coefficient stands out as the strongest coefficient across cortical, subcortical, and cerebellar structures. b LDA-derived brain asymmetry effects for 22q11.2 deletion. This mutation is associated with several strong LDA coefficients across the brain, with three coefficients passing the bootstrap testing. Positive (red) LDA coefficients represent decreased leftward asymmetry or increased rightward asymmetry, and vice versa for negative (blue) coefficients. Error bars correspond to the 95% confidence interval (CI) based on bootstrap resampling distribution with 1000 iterations. Deletions at 16p11.2 and 22q11.2 loci lead to asymmetry deviation principles involving regions typically associated with higher-order cognitive functions.
Fig. 3
Fig. 3. Zooming in on the left- and right-biased effects to explain asymmetry disbalances in two CNVs.
We detailed the effects of CNV-carriership on asymmetry by examining the raw hemispheric volumes in regions identified as significant (Fig. 2). a Asymmetry index in CNV carriers and controls for deletions at 16p11.2 and 22q11.2 loci. For both loci, CNV carriers show the highest increase in planum temporale asymmetry compared to controls. Both CNVs also show decreased asymmetry for the fusiform cortex and parahippocampal gyrus (error bars denote a 95% confidence interval for the mean asymmetry index). b Disambiguating the direction of left-biased vs right-biased effects. The bar plot depicts differences in regional volumes between CNV carriers and controls in each hemisphere. 16p11.2 deletion displays a similar direction of left- and right-biased effects. In other words, this CNV impacts both hemispheres in the same direction for each regional volume. However, the magnitudes of volumetric changes differ between each hemisphere. 22q11.2 deletion leads to significant effects in a single hemisphere. Specifically, this CNV decreases volume in the left fusiform cortex and increases the volume in the right parahippocampal gyrus. c Association between regional asymmetry and CNV effects. The scatterplot depicts the relationship between the coefficients of CNV-specific models and regional asymmetry in controls. Both 16p11.2 and 22q11.2 deletions effects do not significantly correlate with regional asymmetry (Pearson’s correlation P > 0.05). Planum temporale stands out as the most affected region in both CNVs. Volumetric effects leading to asymmetry alteration depend on brain region and type of genetic mutation.
Fig. 4
Fig. 4. Functional decoding of derived asymmetry patterns spotlights language and hearing.
We performed a functional profiling assay based on the obtained LDA asymmetry patterns using the NeuroSynth resource. To that end, we first map the 16p11.2 and 22q11.2 deletion LDA coefficients on the brain. Resulting whole-brain signatures summarize the asymmetry differences between controls and respective CNV carriers. We then contextualized the whole-brain asymmetry signatures by means of curated NeuroSynth activation maps. a Top associated NeuroSynth keywords. Word cloud plot depicts the 50 most strongly associated NeuroSynth keywords for each of the two CNVs. b Functional associations with LDA patterns. Circular bar plots display the 12 most strongly associated keywords after filtering out terms related to brain anatomy. Y-axis corresponds to the similarity (Pearson’s correlation) between the brain map of LDA coefficients and the respective NeuroSynth activation map. c Similarity in functional profiles of both CNVs. Each axis shows the correlation between the 3228 term-specific NeuroSynth activation maps and a given CNV-specific asymmetry pattern. The strong linear relationship demonstrates that both CNVs are associated with similar functions. d NeuroSynth meta-analysis along ranked LDA coefficients using 24 topic terms. We calculated the weighted score of activation maps and ranked LDA asymmetry patterns. Terms are ordered by the weighted mean of their location along the LDA coefficient spectrum. Negative LDA coefficients (blue) correspond to decreased leftward or increased rightward asymmetry, and vice versa for positive coefficients (red). The negative coefficients are associated with language and hearing for both CNVs. The positive coefficients are associated with face processing and visual perception. 16p11.2 and 22q11.2 deletion impact the laterality of higher-order functional systems, including language, hearing, and visual perception.
Fig. 5
Fig. 5. Single common variant significantly associated with planum temporale asymmetry in genome-wide scanning.
We performed a genome-wide association study (GWAS) based on 29,470 UK Biobank subjects to find associations between common single nucleotide polymorphisms (SNP) and planum temporale asymmetry. a GWAS of planum temporale asymmetry spotlights single SNP. The Manhattan plot depicts the single significantly associated SNP rs41298373 at locus 10p14. b Quantile-Quantile plot for the performed GWAS. The P-value associated with rs41298373 clearly exceeds the expected P-values from the corresponding reference distribution. c Regional plot to zoom in on the identified genomic locus rs41298373. The identified SNP locus lies within exon 9 of the gene ITIH5 (ENSG00000123243). d GWAS associations with rs41298373 based on the GWAS Catalog. This SNP was further associated with several measurements of brain morphology or cortical surface and thickness. In total, previous GWAS associated rs41298373 with 13 phenotypes, including the here observed planum temporale asymmetry (i.e., second bar). e GWAS associations with ITIH5 based on the GWAS Catalog. The identified gene ITIH5 was further associated with a total of 24 phenotypes spanning measurements of blood proteins, brain morphology, gut microbiome, or ovarian reserve. f Summary of GWAS based on left, respectively right, planum temporale volume. GWAS of left planum temporale identified significantly associated SNPs influencing the expression of 10 genes, including the ITIH5 gene. GWAS of right planum temporale volume identified SNPs associated with the expression of six genes. Notably, ITIH5 was not absent among these genes. g Genetic correlation between genetic basis (GWAS summary statistics) underlying left and right planum temporale volume, planum temporale asymmetry, as well as ASD and SCZ. The left and right planum temporale volumes were significantly, yet imperfectly correlated. The remaining unexplained residual variance suggests a partly diverging genetic architecture. The genetic architecture underlying planum temporale asymmetry was significantly correlated only with the volume in the left hemisphere but not that of the right one. We did not find a significant correlation with any of the disorders. Plots were generated using FUMA software. We isolated a specific genetic locus that may mediate genetically controlled brain asymmetry. In addition, we quantified the different genetic control of left and right planum temporale volume.

Update of

References

    1. Corballis MC, Morgan MJ. On the biological basis of human laterality: I. Evidence for a maturational left–right gradient. Behav. Brain Sci. 1978;1:261–269. doi: 10.1017/S0140525X00074471. - DOI
    1. Hartwigsen G, Bengio Y, Bzdok D. How does hemispheric specialization contribute to human-defining cognition? Neuron. 2021;109:2075–2090. doi: 10.1016/j.neuron.2021.04.024. - DOI - PMC - PubMed
    1. Toga AW, Thompson PM. Mapping brain asymmetry. Nat. Rev. Neurosci. 2003;4:37–48. doi: 10.1038/nrn1009. - DOI - PubMed
    1. Chomsky, N. Cartesian Linguistics: A Chapter in the History of Rationalist Thought. 78–93. (Cambridge University Press, 2009).
    1. Hauser MD, Chomsky N, Fitch WT. The faculty of language: what is it, who has it, and how did it evolve? Science. 2002;298:1569–1579. doi: 10.1126/science.298.5598.1569. - DOI - PubMed