. 2024 Mar 26;10(1):33.
doi: 10.1038/s41421-023-00642-z.

Fast and flexible profiling of chromatin accessibility and total RNA expression in single nuclei using Microwell-seq3

Affiliations

Fast and flexible profiling of chromatin accessibility and total RNA expression in single nuclei using Microwell-seq3

Fang Ye et al. Cell Discov. .

Abstract

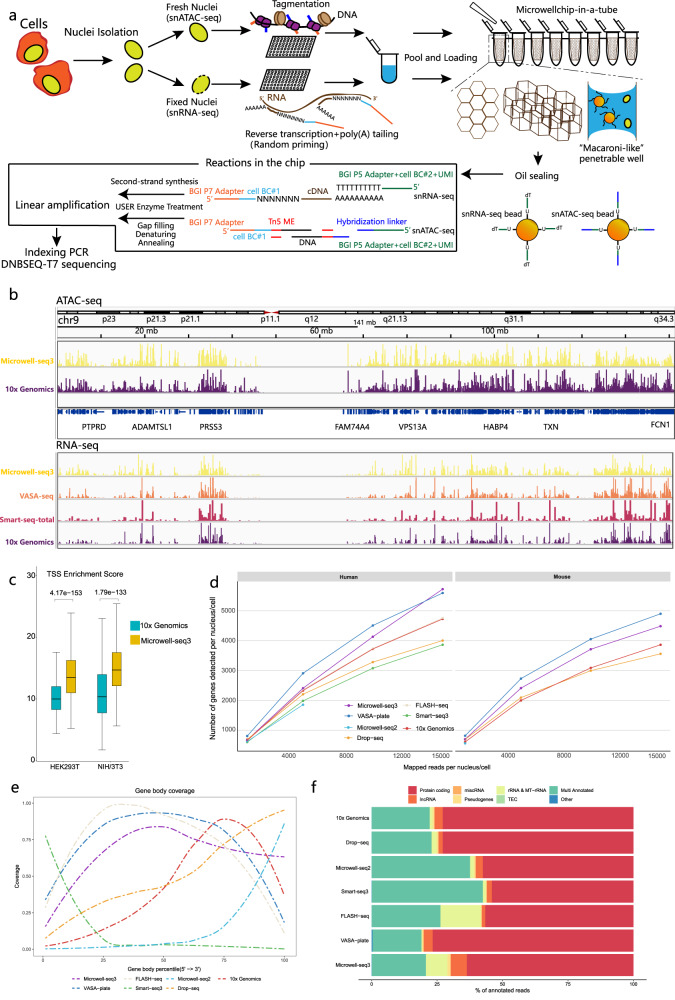
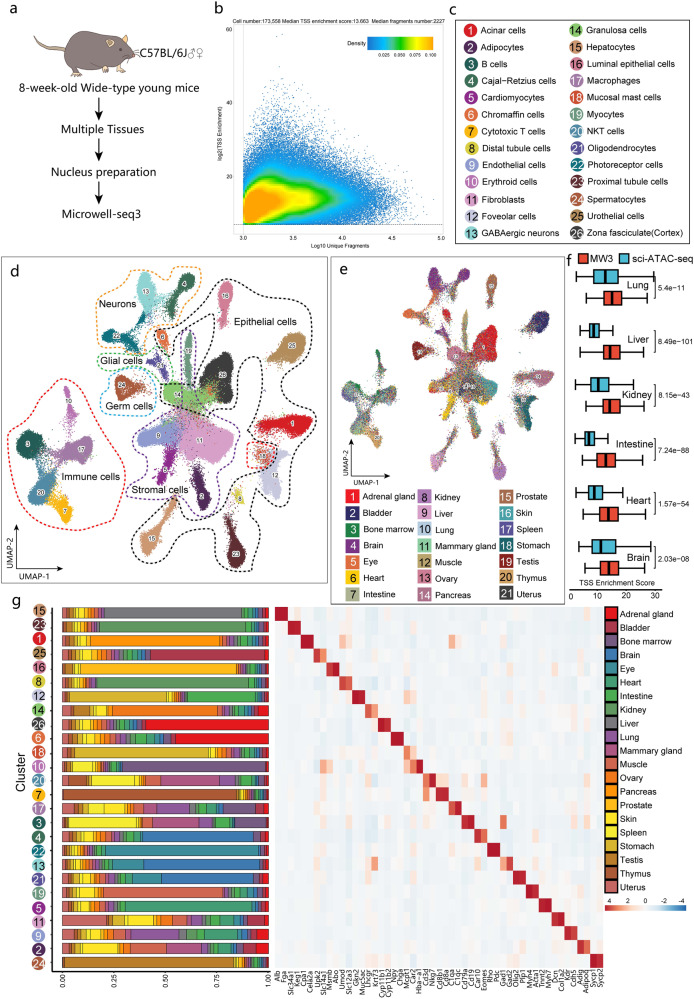
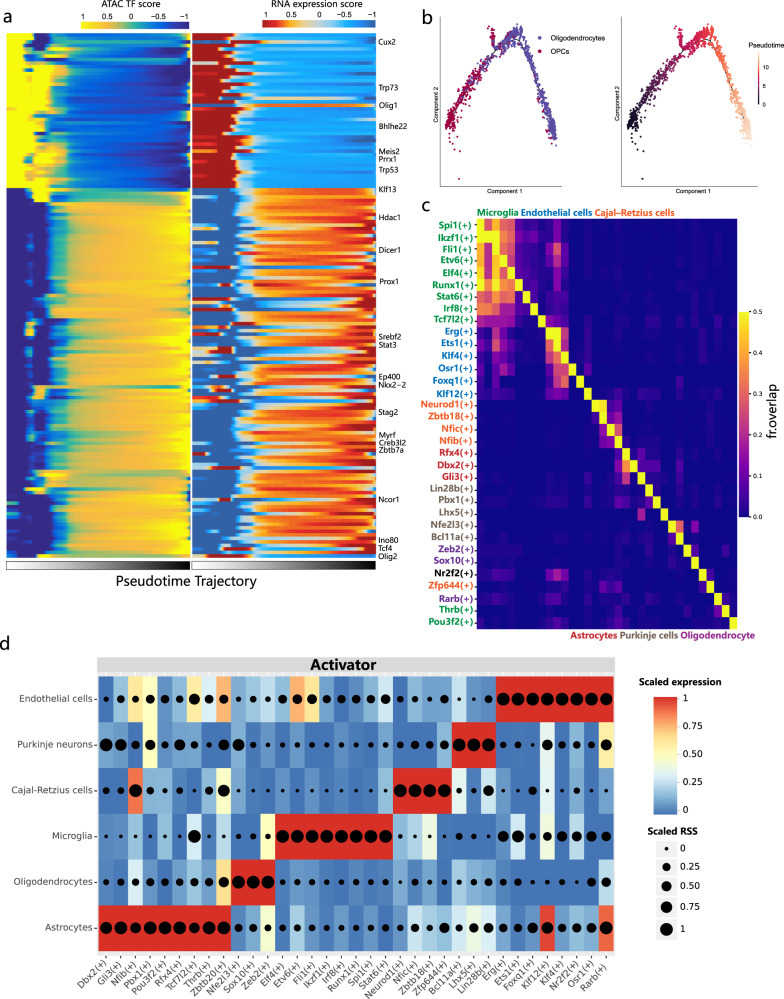
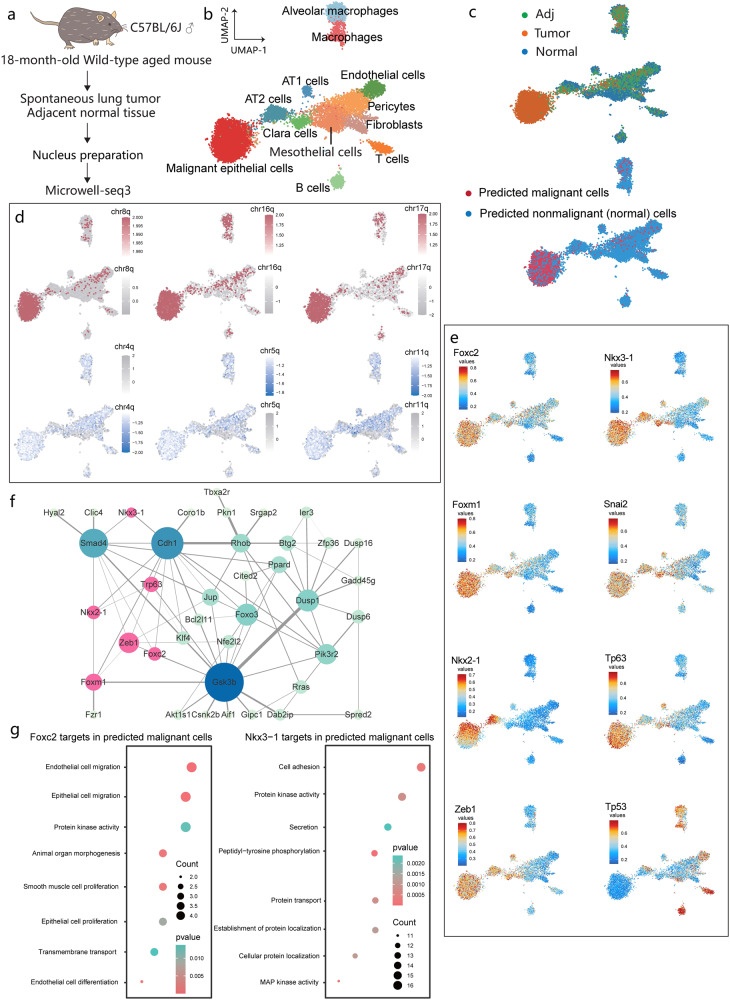
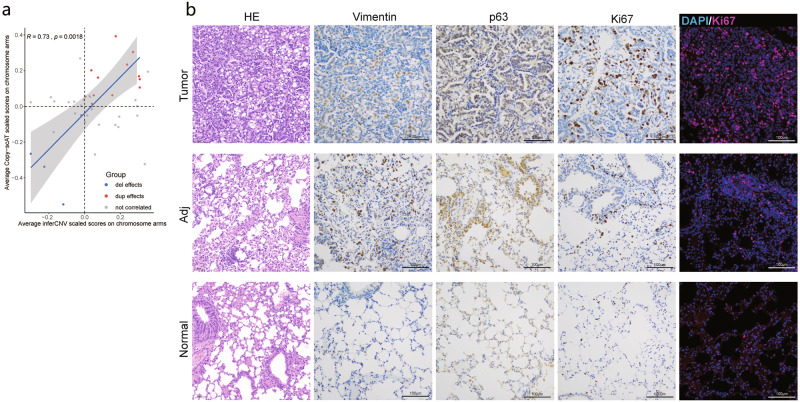
Single cell chromatin accessibility profiling and transcriptome sequencing are the most widely used technologies for single-cell genomics. Here, we present Microwell-seq3, a high-throughput and facile platform for high-sensitivity single-nucleus chromatin accessibility or full-length transcriptome profiling. The method combines a preindexing strategy and a penetrable chip-in-a-tube for single nucleus loading and DNA amplification and therefore does not require specialized equipment. We used Microwell-seq3 to profile chromatin accessibility in more than 200,000 single nuclei and the full-length transcriptome in ~50,000 nuclei from multiple adult mouse tissues. Compared with the existing polyadenylated transcript capture methods, integrative analysis of cell type-specific regulatory elements and total RNA expression uncovered comprehensive cell type heterogeneity in the brain. Gene regulatory networks based on chromatin accessibility profiling provided an improved cell type communication model. Finally, we demonstrated that Microwell-seq3 can identify malignant cells and their specific regulons in spontaneous lung tumors of aged mice. We envision a broad application of Microwell-seq3 in many areas of research.


Conflict of interest statement

G.G., F.Y., G.Z., L.Y. and X.H. have filed a patent application related to this work. The remaining authors declare no competing interests.

Figures

Fig. 1
Fig. 1. Overview of the microwell-seq3 workflow.
a Schematic view of the Microwell-seq3 workflow. Single nuclei are extracted from fresh or frozen tissues. DNA or RNA in nuclei is tagged with the first part of the cell barcode (BC#1) in multiple 96-well plates. Labeled nuclei and barcoded magnetic beads are pooled and evenly loaded into Microwell chips. Oligos are released from the beads and linear preamplification is performed in the chips. Preamplified DNA or RNA fragments are collected from the chips for final library preparation and sequencing. b Representative University of California Santa Cruz (UCSC) Genome Browser view of ATAC-seq and RNA-seq signal tracks (HEK293T cells) from Microwell-seq3, 10X Genomics, VASA-seq and Smart-seq-total data. c Distribution of TSS enrichment scores from Microwell-seq3 and 10X Genomics ATAC-seq data in the indicated cell lines, reads (fragments) are down sampled to 2000 fragments per nucleus. The statistical test used is a two-sided Student’s t-test. d Number of the detected annotated genes in human and mouse cell lines (HEK293T, mouse NIH/3T3 and embryonic stem cells (mESCs)) in each method is plotted against the number of unique mapped reads per cell in different down-sampling thresholds. All the reads are remapped with the same pipeline after adapter filtering and trimming. Data of mESCs were generated by VASA-seq. e Comparison of mean ± standard deviation (SD) gene body coverage in protein-coding genes in cell lines across the different methods. Microwell-seq3, FLASH-seq and VASA-seq show even coverage across the length of the genes. Other methods show bias toward the 5′ and 3′ ends of transcripts, respectively. Reads in each method are trimmed to 500,000 per sample. f Proportions of the reads mapped to all annotated genes for each biotype in cell lines across the different methods. Microwell-seq3 detects proportionally higher levels of lncRNAs. Reads in each method are trimmed to 5000 per cell.
Fig. 2
Fig. 2. Analysis of chromatin accessibility in multiple mouse tissues.
a Schematic view of the workflow. b Quality control plots generated with ArchR for all cells in the Microwell-seq3 ATAC-seq data from wild-type mice showing the TSS enrichment score and number of unique nuclear DNA fragments per cell. The dot color represents the density (in arbitrary units) of the point in the plot. c Annotations of major snATAC-seq clusters in 8-week-old wild-type mice. d UMAP plot of all major cell types from 8-week-old wild-type mice in ATAC-seq. e UMAP plot of all cell clusters from 8-week-old wild-type mice colored by tissue. f Distribution of TSS enrichment scores from Microwell-seq3 and sci-ATAC-seq data in different tissues, reads (fragments) are down sampled to 2000 fragments per nucleus. The statistical test used is a two-sided Student’s t-test. g Heatmap of differential accessibility relative to the annotated cell type. Significant highly accessible sites in relevant genes are highlighted along the bottom. The proportion of each cluster originating from each tissue is shown alongside the heatmap.
Fig. 3
Fig. 3. GRN analysis of normal mouse brain.
a Heatmap of scaled expression scores and chromatin accessibility of representative TFs along the oligodendrocyte pseudotime trajectory. b Pseudotime analyses of the oligodendrocytes and OPCs. c Heatmap showing the overlap between target regions of cell type-specific regulons. The overlap is divided by the number of target regions of each regulon (row). The TF overlap is evaluated by calculating the Jaccard index. d Heatmap and dot plot showing the expression of the inferred activator regulons. The expression level is color-coded. The cell type specificity (RSS) of the regulons is coded by dot size.
Fig. 4
Fig. 4. Analysis of spontaneous lung tumors in aged mice.
a Workflow for analysis of spontaneous lung tumors in mouse using Microwell-seq3. b UMAP plot of cell types from paired normal lung tissue, spontaneous lung tumor tissue and tumor-adjacent tissue. c UMAP plot showing the distributions of tissue type (upper) and predicted malignant cells. d UMAP plot showing the gain and loss of specific chromosomes in tumor tissues. The gray bar represents the nonsignificant range. e UMAP plot of the enrichment scores for the most specific TFs in tumor tissues. f Network showing the correlations between the most specific TFs and their target genes. Selected TFs are labeled pink. The color depth of the target genes represents the node degree. The node size represents the number of the connected genes. g Gene ontology enrichment analysis of the target genes of Foxc2 and Nkx3.1 in the predicted malignant cells.
Fig. 5
Fig. 5. CNV correlation analysis and validation of the malignant signatures.
a Correlation analysis of chromosome level CNV results between RNA-seq and ATAC-seq data. Only duplication effects (dup effect) and deletion effects (del effect) in overlapped the cytobands (chromosome region, see Materials and methods) were included for correlation analysis. Cytobands with inconsistent trend across different methods were labeled as “not correlated”. b Representative images of HE, IHC and IF staining results of tumor specific markers in tumor, tumor-adjacent tissue (Adj) and normal tissue sections. Scale bars, 100 μm.

Similar articles

Cited by

References

    1. Armand EJ, Li J, Xie F, Luo C, Mukamel EA. Single-cell sequencing of brain cell transcriptomes and epigenomes. Neuron. 2021;109:11–26. doi: 10.1016/j.neuron.2020.12.010. - DOI - PMC - PubMed
    1. Nam AS, Chaligne R, Landau DA. Integrating genetic and non-genetic determinants of cancer evolution by single-cell multi-omics. Nat. Rev. Genet. 2021;22:3–18. doi: 10.1038/s41576-020-0265-5. - DOI - PMC - PubMed
    1. Uyar B, et al. Single-cell analyses of aging, inflammation and senescence. Ageing Res. Rev. 2020;64:101156. doi: 10.1016/j.arr.2020.101156. - DOI - PMC - PubMed
    1. Xu X, et al. Single-cell exome sequencing reveals single-nucleotide mutation characteristics of a kidney tumor. Cell. 2012;148:886–895. doi: 10.1016/j.cell.2012.02.025. - DOI - PMC - PubMed
    1. Zong C, Lu S, Chapman AR, Xie XS. Genome-wide detection of single-nucleotide and copy-number variations of a single human cell. Science. 2012;338:1622–1626. doi: 10.1126/science.1229164. - DOI - PMC - PubMed