. 2024 Mar 26;15(1):2662.
doi: 10.1038/s41467-024-46901-9.

Precise prediction of phase-separation key residues by machine learning

Affiliations

Precise prediction of phase-separation key residues by machine learning

Jun Sun et al. Nat Commun. .

Abstract

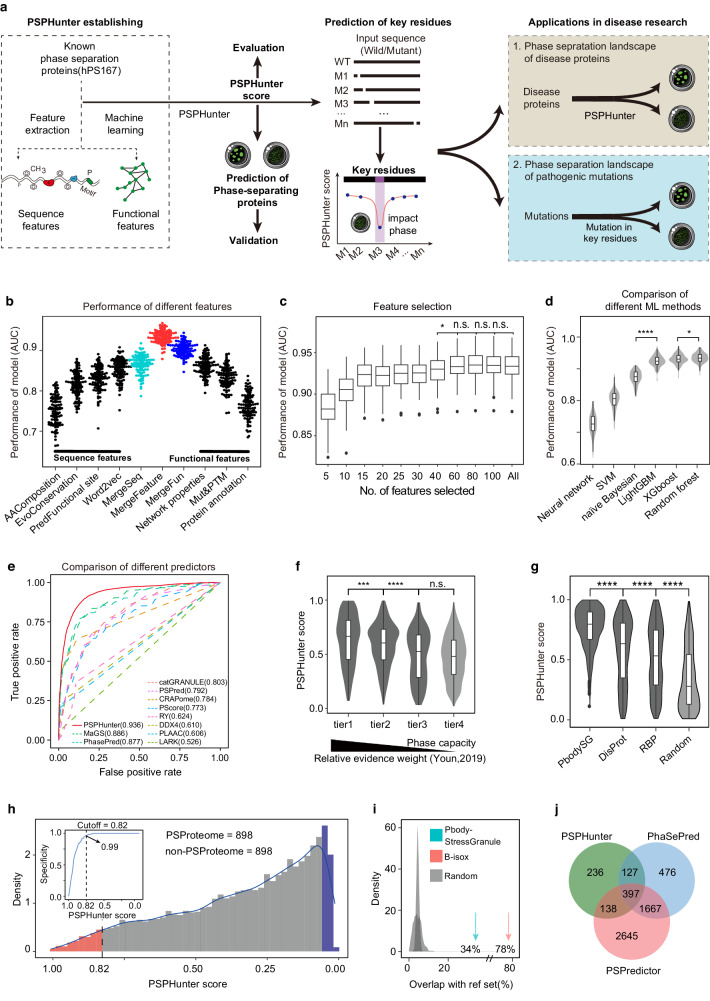
Understanding intracellular phase separation is crucial for deciphering transcriptional control, cell fate transitions, and disease mechanisms. However, the key residues, which impact phase separation the most for protein phase separation function have remained elusive. We develop PSPHunter, which can precisely predict these key residues based on machine learning scheme. In vivo and in vitro validations demonstrate that truncating just 6 key residues in GATA3 disrupts phase separation, enhancing tumor cell migration and inhibiting growth. Glycine and its motifs are enriched in spacer and key residues, as revealed by our comprehensive analysis. PSPHunter identifies nearly 80% of disease-associated phase-separating proteins, with frequent mutated pathological residues like glycine and proline often residing in these key residues. PSPHunter thus emerges as a crucial tool to uncover key residues, facilitating insights into phase separation mechanisms governing transcriptional control, cell fate transitions, and disease development.


Conflict of interest statement

J.D., J.S., J.Q. and C.Z. are listed as inventors of a patent applications titled ‘A machine learning method for predicting phase separation driving residues’, the remaining authors declare no competing interests.

Figures

Fig. 1
Fig. 1. Establishment of PSPHunter for predicting phase-separating proteins.
a Scheme of the research route and methods. PSPHunter incorporates sequence and functional features for phase-separating protein prediction and key residue identification, enabling exploration of the link between phase separation and diseases. b Feature performance comparison: Sequence and functional features (cyan and blue, respectively) are compared. Combining these features significantly improves prediction accuracy (n = 100 datasets). c Model performance evaluation based on feature importance (n = 100 datasets), considering varying numbers of selected features. d Violin plots comparing the performance among different machine learning methods (n = 100 datasets), including support vector machine (SVM), naïve Bayesian classifier (NB), neural network (NN), random forest (RF), light gradient boosting machine (LightGBM), and extreme gradient boosting (XGBoost). e Comparison of PSPHunter with other representative phase-separating protein predictors. We randomly extracted 30% of data from the positive samples, and an equally sized set of negative samples was selected to form the independent test dataset. Employing this selection strategy, we created 100 distinct independent test sets. The final evaluation represents the average performance across all sets. f Violin plots illustrating PSPHunter scores of four-tier protein datasets ranked based on weighted experimental evidence according to Youn et al., tier1 = 367, tier2 = 473, tier3 = 426, tier4 = 3111. g PSPHunter score distribution in different phase separation-related datasets, processing bodies and stress granules (from Wikipedia, n = 591), disordered proteins (from DisProt, n = 568), and RNA binding proteins (from EuRBPDB, n = 1784). h PSPHunter scores in the proteome: Candidate phase-separating proteins (PSProteome, red) and non-phase-separating proteins (blue) are identified based on a sequence identity cutoff (n = 898 each). i Overlap with reference datasets: Overlap between the PSProteome and datasets identified by the b-isox method (red) and processing bodies/stress granules (cyan) is shown. j Overlap between the PSProteome and the latest two-phase separation predictors. Note: All statistical tests used one-sided Wilcoxon tests. Significance levels are: *P < 0.05, **P < 0.01, ***P < 0.001, ****P < 0.0001 (n.s. = not significant). Boxplots represent the interquartile range (IQR) from Q1 to Q3, with the median as the middle line. Whiskers extend up to 1.5 times the IQR. Outliers are not shown.
Fig. 2
Fig. 2. PSPHunter can predict reliable phase-separating proteome.
a Evaluation of PSPHunter model performance across different independent test sets. Among these, ‘Independent_Test_I’ and ‘Independent_Test_II’ represent test sets comprising a mixture of species sourced from ‘MixPS488’ and ‘MixPS237’, respectively. Additionally, ‘Independent_Test_III’ encompasses a human-specific dataset obtained from ‘hPS167’. For further details, refer to the methodology section. b in vitro and in vivo validation of potential phase-separating proteins. Red denotes top-ranked proteins with high PSPHunter scores, indicating their potential as phase-separating proteins, while blue denotes bottom-ranked proteins with low PSPHunter scores, serving as negative controls. c, d in vitro (c) and in vivo (d) FRAP analysis of potential phase- separating proteins. For each protein, we quenched three spots for statistical analysis of droplet properties (The error bars represent the standard deviation). The droplets formed by potential phase-separating proteins exhibit rapid recovery from photobleaching, while the negative controls display limited recovery. e Quantification of puncta for potential phase-separating and non-phase-separating proteins in vitro and in vivo, n = 3, the boxplots were drawn from lower quartile (Q1) to upper quartile (Q3), with the middle line denoting the median, whiskers with maximum 1.5 interquartile range (IQR) and outliers were not indicated. f Correlation between PSPHunter scores and the number of puncta in vitro and in vivo experiments, Pearson’s product-moment correlation coefficient, two-sided.
Fig. 3
Fig. 3. PSPHunter can accurately predict key residues of phase-separating proteins.
a Strategy for identifying key residues. Mutation impact on phase separation is measured by changes in probability upon truncating specific units. b Venn diagrams showcasing the overlap between known phase-separation regions sourced and benchmarked from the PhaSePro database (pink) and the key regions predicted by PSPHunter (purple). c Distance comparison between the key region and an equal-length random region to the known phase-separating related region (one-sided Wilcoxon test, ****P < 0.0001, the bar denotes the average distance, Key region = 121; Random region = 121,000). Key regions are either within or near known regions. d Detailed comparison between known phase separation related region and key region predicted by PSPHunter. NTF2L, NTF2-like; RG, arginine-glycine rich; RRM, RNA recognition motif, CC, coiled-coil region; linker, inker between the first two SH3 domains. e Schematic representation of key residue validation, where the purple region represents the predicted key residue, expected to impact phase separation, while the blue region denotes the control residue with minimal effect on phase separation. f Identification of key residues and non-key residues for GATA3 as defined by PSPHunter. Specifically, the key residues for GATA3 are located at amino acid positions 322–327, while the non-key residues are located at positions 88–93. gh FRAP analysis of GATA3-GFP. Representative imaging (left) and GFP fluorescence intensity curve (right) demonstrate that the droplets formed by wild-type GATA3 and control residue-truncated GATA3 rapidly recover from photobleaching, whereas the droplets formed by key residue-truncated GATA3 exhibit limited recovery, n = 3, the error bars represent the standard deviation. i Quantification of puncta numbers for GATA3 and its mutants. The number of puncta of GATA3 per cell indicates that truncation of control residues has no significant reduction in puncta, whereas truncation of key residues significantly decreases. The boxplots were drawn from the lower quartile (Q1) to the upper quartile (Q3), with the middle line denoting the median, whiskers with a maximum 1.5 interquartile range (IQR), and outliers did not indicate the number of puncta (one-sided Wilcoxon test, ****P < 0.0001, not significant, denoted as n.s., n = 3).
Fig. 4
Fig. 4. Glycine and its motifs are enriched in spacer and key residues.
a Total counts of phase-separating proteins and their corresponding key regions. b Distribution of the number of the key regions shows that most phase-separating proteins have three or four key regions. c Overlap between key region and IDR region, RNA binding region and DNA binding region. d PSPHunter score of IDR region and folded domain (one-sided Wilcoxon test, ****P < 0.0001, Folded domain = 3395, IDR = 3450). ef Residue propensity shows that key regions located in different areas tend to be GP-rich (red denoted glycine and proline, pink denoted charged residues such as DREK, cyan denoted polar residues such as VQTS, the remaining residues in grey are hydrophobic residues). g Representative motifs of phase-separating proteins and key regions. h Proportions of spacer amino acids in different protein types and sequence regions: Folded domain (representing nucleic acid binding regions predicted by SNBRFinder), IDR (Intrinsically disordered region), and key region. The number of All = 20,420, Phase = 889, Folded domain = 4557, IDR = 2044, Key region = 3459. i Proportions of sticker amino acids in different protein types and sequence regions. Same number as h. j, Sequence distances of specific amino acid types in key amino acids. The number of Sticke = 18,869, Spacer = 17,439. k Model showing spacer residues GP tends to exhibit a contiguous pattern, while sticker residues prefer a dispersed distribution within phase-separating proteins. Note: All statistical tests were one-sided Wilcoxon tests. Significance levels are indicated by asterisks: *, P < 0.05; **, P < 0.01; ***, P < 0.001; ****, P < 0.0001 (not significant, denoted as n.s.). The boxplots were drawn from the lower quartile (Q1) to the upper quartile (Q3), with the middle line denoting the median, and whiskers with a maximum 1.5 interquartile range (IQR).
Fig. 5
Fig. 5. The pathogenic mutations glycine and proline disrupt phase separation more significantly than other mutations.
a Proteins associated with cancer and Mendelian diseases tend to have higher PSPHunter scores (one-sided Wilcoxon test, ****P < 0.0001, Cancer = 3999, Mendelian disease = 4498, Random = 3000, All = 20,150). b Overlap between phase-separating proteins and different types of diseases. c Nearly 80% of phase-separating proteins are disease-related (one-sided Student’s t-test, ***P < 0.001; Random, n = 1000). d Phase-separating proteins have significantly more missense mutations (one-sided Wilcoxon test, ****P < 0.0001; PSProteome = 871; NonPS = 801;). e Phase-separating proteins have significantly more pathogenic mutations compared to the NonPS, with no differences in neutral mutations (one-sided Wilcoxon test, n.s. no significance, ****P < 0.0001; PSProteome = 891; NonPS = 891). f Pathogenic mutations have more impact on phase separation capacity than neutral mutations (one-sided Wilcoxon test, ****P < 0.0001; pathogenic = 684; neutral = 2684). g Heatmap showing that the mutations from GP to hydrophobic are the most frequent mutations in phase-separating proteins. h Bar plot showing that GP is more likely to locate at key region (average mutations per residue). i Compare to the random regions which have the same length as the corresponding key region, the pathogenic mutations of GP are preferentially located at the key residues. j Boxplot showing that mutations in the key region have more impact on protein phase separation capacity (one-sided Wilcoxon test, ****P < 0.0001; KeyRegion = 4737; NotKeyRegion = 28,992). k Pathogenic mutations of GP in key residues have more impact on phase separation capacity than other mutations also within key residues (one-sided Wilcoxon test, ****P < 0.0001; GlyPro = 1207; NotGlyPro = 3530). l Model showing that pathogenic mutations of GP occurred in key region are more deleterious to protein phase separation capacity. Note: The boxplots depict the interquartile range (IQR) from the lower quartile (Q1) to the upper quartile (Q3). The median is indicated by the middle line within the box and Whiskers extend up to 1.5 times the IQR from the box.
Fig. 6
Fig. 6. Deletion of key residues disrupt the phase separation of GATA3 and promotes the migration and suppresses the growth of tumor cells.
a Pathogenic probability of GATA3 defined by PolyPhen2, a sequence-based method used to predict the functional effects of mutations. It shows that the key regions of GATA3 tend to possess higher pathogenicity. b Bar plot showing that most of the mutations occur in the end of the GATA3. c Most of the high-frequent mutations are involved in breast cancer. d Cell viability was reduced by overexpression of key residues truncated-GATA3 in MCF7 cells (n = 3 biologically independent experiments, same as f, h). Line in purple denotes overexpression key residues truncated GATA3, line in blue denotes overexpression the control residues truncated GATA3, line in yellow denotes the the overexpression of the phase separation-rescued variant of GATA3, and line in grey denotes overexpression the wild type GATA3. e, f Effect of GATA3 on MCF7 cell migration. Representative result of scratch healing assay (e) and statistical analysis of scratch healing assay (f). g, h Illustrative outcomes of cell cycle analysis (g) and the corresponding distribution (h) of MCF7 cells across the G1, S, and G2/M phases. Note: All statistical tests were one-sided Wilcoxon tests. Significance levels are indicated by asterisks: *P < 0.05; **P < 0.01; ***P < 0.001; ****P < 0.0001 (not significant, denoted as n.s.). The error bars represent the standard deviation.
Fig. 7
Fig. 7. Webservices provide tools for prediction of phase-separating proteins, key residues and impact of pathogenic mutations on phase separation.
a Homepage of PSPHunter. b Function of PSPHunter services. PSPHunter provides features to identify putative key residues, predict protein phase separation ability and evaluate the phase separation effect of mutations.

References

    1. Alberti S, Gladfelter A, Mittag T. Considerations and challenges in studying liquid-liquid phase separation and biomolecular condensates. Cell. 2019;176:419–434. doi: 10.1016/j.cell.2018.12.035. - DOI - PMC - PubMed
    1. Boija A, et al. Transcription factors activate genes through the phase-separation capacity of their activation domains. Cell. 2018;13:1842–1855. doi: 10.1016/j.cell.2018.10.042. - DOI - PMC - PubMed
    1. Brangwynne CP, et al. Germline P granules are liquid droplets that localize by controlled dissolution/condensation. Science. 2009;324:1729–1732. doi: 10.1126/science.1172046. - DOI - PubMed
    1. Brangwynne CP, Mitchison TJ, Hyman AA. Active liquid-like behavior of nucleoli determines their size and shape in Xenopus laevis oocytes. Proc. Natl. Acad. Sci. 2011;108:4334–4339. doi: 10.1073/pnas.1017150108. - DOI - PMC - PubMed
    1. Yamasaki A, et al. Liquidity is a critical determinant for selective autophagy of protein condensates. Mol. Cell. 2020;77:1163–1175. doi: 10.1016/j.molcel.2019.12.026. - DOI - PubMed