. 2024 Mar 26;15(1):2368.
doi: 10.1038/s41467-024-46346-0.

Predicting and improving complex beer flavor through machine learning

Affiliations

Predicting and improving complex beer flavor through machine learning

Michiel Schreurs et al. Nat Commun. .

Abstract

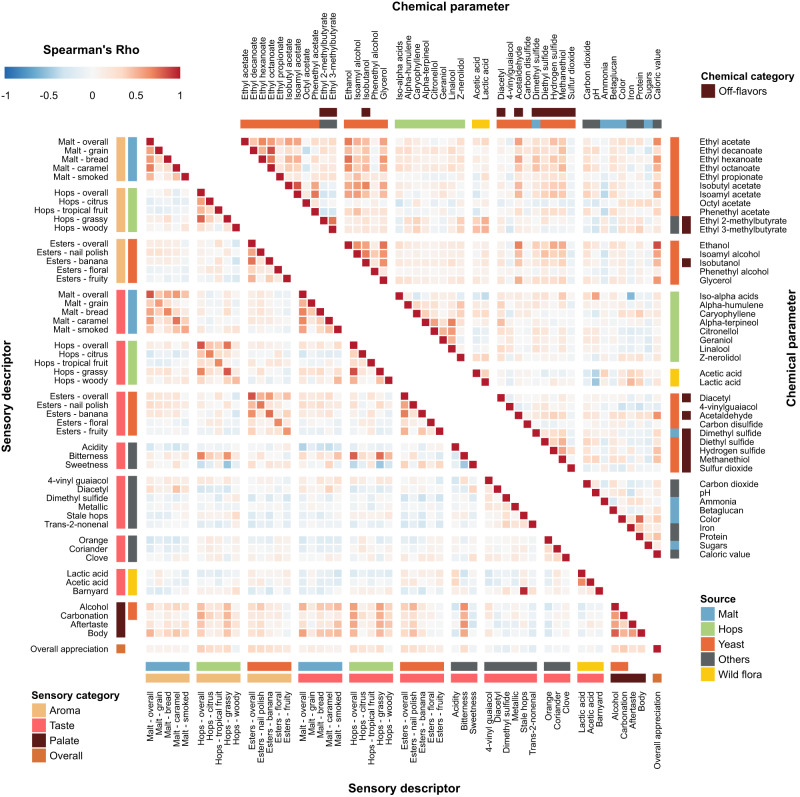
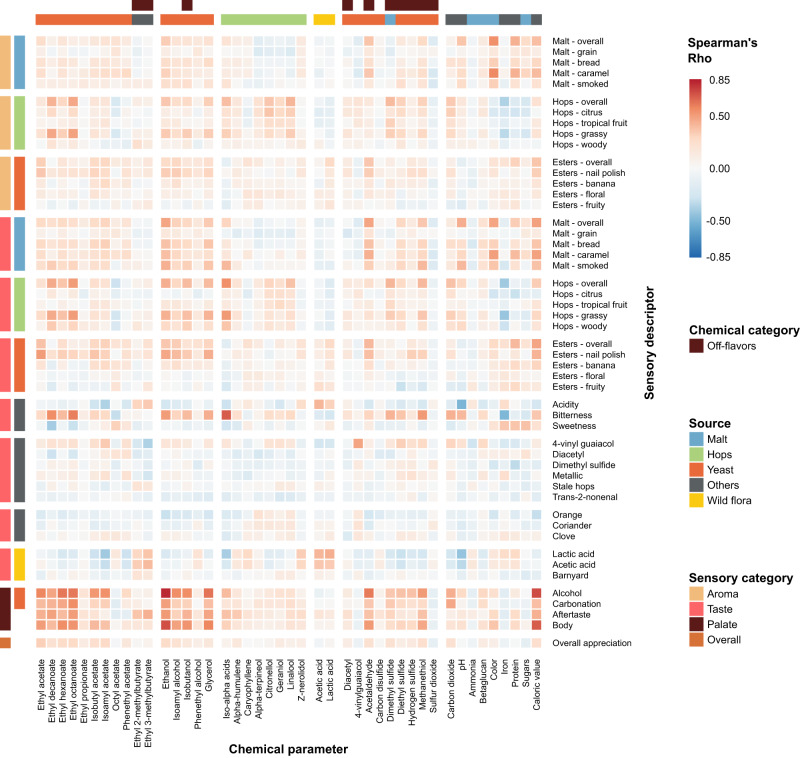
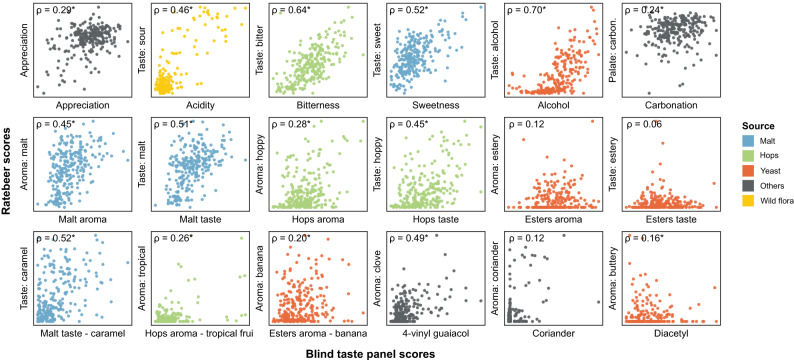
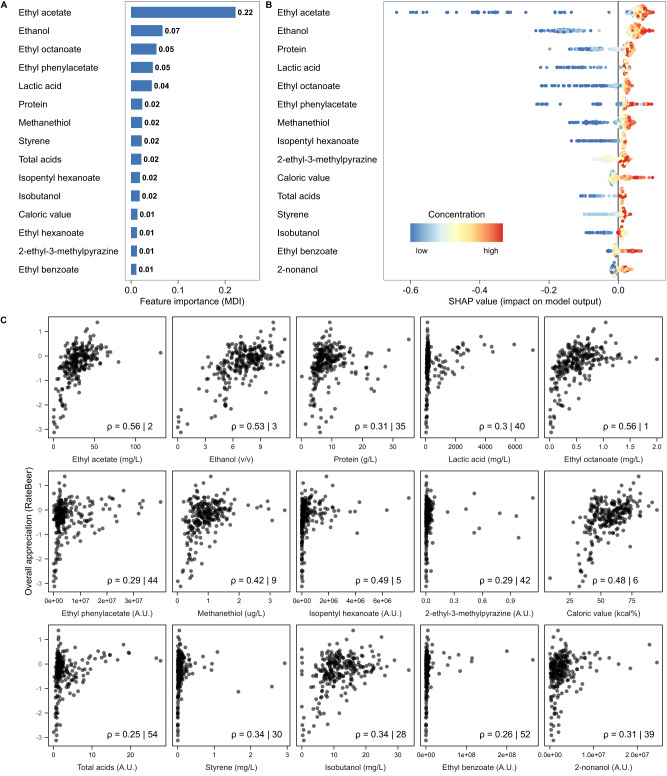
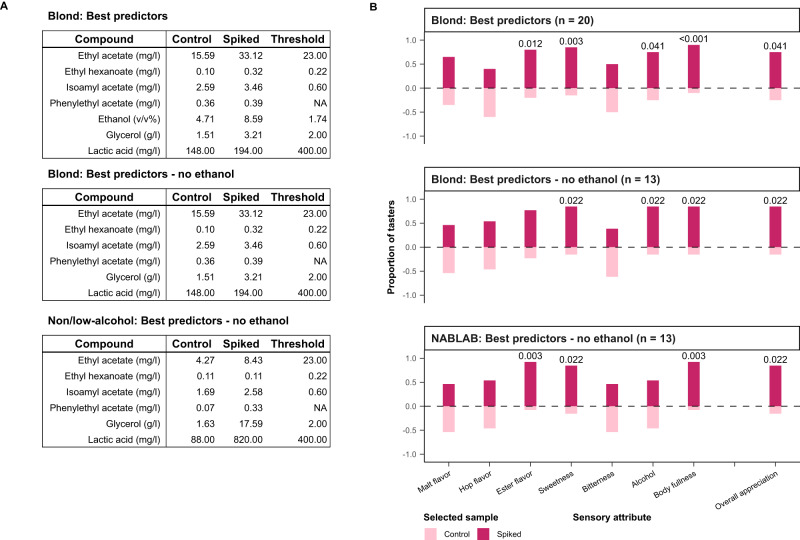
The perception and appreciation of food flavor depends on many interacting chemical compounds and external factors, and therefore proves challenging to understand and predict. Here, we combine extensive chemical and sensory analyses of 250 different beers to train machine learning models that allow predicting flavor and consumer appreciation. For each beer, we measure over 200 chemical properties, perform quantitative descriptive sensory analysis with a trained tasting panel and map data from over 180,000 consumer reviews to train 10 different machine learning models. The best-performing algorithm, Gradient Boosting, yields models that significantly outperform predictions based on conventional statistics and accurately predict complex food features and consumer appreciation from chemical profiles. Model dissection allows identifying specific and unexpected compounds as drivers of beer flavor and appreciation. Adding these compounds results in variants of commercial alcoholic and non-alcoholic beers with improved consumer appreciation. Together, our study reveals how big data and machine learning uncover complex links between food chemistry, flavor and consumer perception, and lays the foundation to develop novel, tailored foods with superior flavors.


Conflict of interest statement

K.J.V. is affiliated with bar.on. The other authors declare no competing interests.

Figures

Fig. 1
Fig. 1. Correlations between selected chemical parameters (upper right panel) and sensory descriptors used by the tasting panel (bottom left panel).
Spearman rank correlations are shown. Descriptors are grouped according to their origin (malt (blue), hops (green), yeast (red), wild flora (yellow), Others (black)), and sensory aspect (aroma, taste, palate, and overall appreciation). Please note that for the chemical compounds, for the sake of clarity, only a subset of the total number of measured compounds is shown, with an emphasis on the key compounds for each source. For more details, see the main text and Methods section. Chemical data can be found in Supplementary Data 1, correlations between all chemical compounds are depicted in Supplementary Fig. S2 and correlation values can be found in Supplementary Data 2. See Supplementary Data 4 for sensory panel assessments and Supplementary Data 5 for correlation values between all sensory descriptors.
Fig. 2
Fig. 2. Pairwise Spearman Rank correlations between chemical data and sensorial data from the trained panel.
Heatmap colors indicate Spearman’s Rho. Axes are organized according to sensory categories (aroma, taste, mouthfeel, overall), chemical categories and chemical sources in beer (malt (blue), hops (green), yeast (red), wild flora (yellow), Others (black)). See Supplementary Data 6 for all correlation values.
Fig. 3
Fig. 3. Correlations between online reviews and trained tasting panel scores.
RateBeer text mining results can be found in Supplementary Data 7. Rho values shown are Spearman correlation values, with asterisks indicating significant correlations (p < 0.05, two-sided). All p values were smaller than 0.001, except for Esters aroma (0.0553), Esters taste (0.3275), Esters aroma—banana (0.0019), Coriander (0.0508) and Diacetyl (0.0134).
Fig. 4
Fig. 4. Most important chemical parameters.
A The impurity-based feature importance (mean deviance in impurity, MDI) calculated from the Gradient Boosting Regression (GBR) model predicting RateBeer appreciation scores. The top 15 highest ranked chemical properties are shown. B SHAP summary plot for the top 15 parameters contributing to our GBR model. Each point on the graph represents a sample from our dataset. The color represents the concentration of that parameter, with bluer colors representing low values and redder colors representing higher values. Greater absolute values on the horizontal axis indicate a higher impact of the parameter on the prediction of the model. C Spearman correlations between the 15 most important chemical properties and consumer overall appreciation. Numbers indicate the Spearman Rho correlation coefficient, and the rank of this correlation compared to all other correlations. The top 15 important compounds were determined using SHAP (panel B).
Fig. 5
Fig. 5. Model validation by a beer supplemented with the top predicted chemical compounds.
Adding the top chemical compounds, identified as best predictors of appreciation by our model, into poorly appreciated beers results in increased appreciation from our trained panel. Results of sensory tests between base beers and those spiked with compounds identified as the best predictors by the model. A Blond and Non/Low-alcohol (0.0% ABV) base beers were brought up to 95th-percentile ethanol-normalized concentrations within each style. B For each sensory attribute, tasters indicated the more intense sample and selected the sample they preferred. The numbers above the bars correspond to the p values that indicate significant changes in perceived flavor (two-sided binomial test: alpha 0.05, n = 20 or 13).

References

    1. Tieman D, et al. A chemical genetic roadmap to improved tomato flavor. Science. 2017;355:391–394. doi: 10.1126/science.aal1556. - DOI - PubMed
    1. Plutowska B, Wardencki W. Application of gas chromatography–olfactometry (GC–O) in analysis and quality assessment of alcoholic beverages – A review. Food Chem. 2008;107:449–463. doi: 10.1016/j.foodchem.2007.08.058. - DOI
    1. Legin A, Rudnitskaya A, Seleznev B, Vlasov Y. Electronic tongue for quality assessment of ethanol, vodka and eau-de-vie. Anal. Chim. Acta. 2005;534:129–135. doi: 10.1016/j.aca.2004.11.027. - DOI
    1. Loutfi A, Coradeschi S, Mani GK, Shankar P, Rayappan JBB. Electronic noses for food quality: A review. J. Food Eng. 2015;144:103–111. doi: 10.1016/j.jfoodeng.2014.07.019. - DOI
    1. Ahn Y-Y, Ahnert SE, Bagrow JP, Barabási A-L. Flavor network and the principles of food pairing. Sci. Rep. 2011;1:196. doi: 10.1038/srep00196. - DOI - PMC - PubMed