. 2024 Mar 26;15(1):2645.
doi: 10.1038/s41467-024-46983-5.

Profiling the colonic mucosal response to fecal microbiota transplantation identifies a role for GBP5 in colitis in humans and mice

Affiliations

Profiling the colonic mucosal response to fecal microbiota transplantation identifies a role for GBP5 in colitis in humans and mice

Laurence D W Luu et al. Nat Commun. .

Abstract

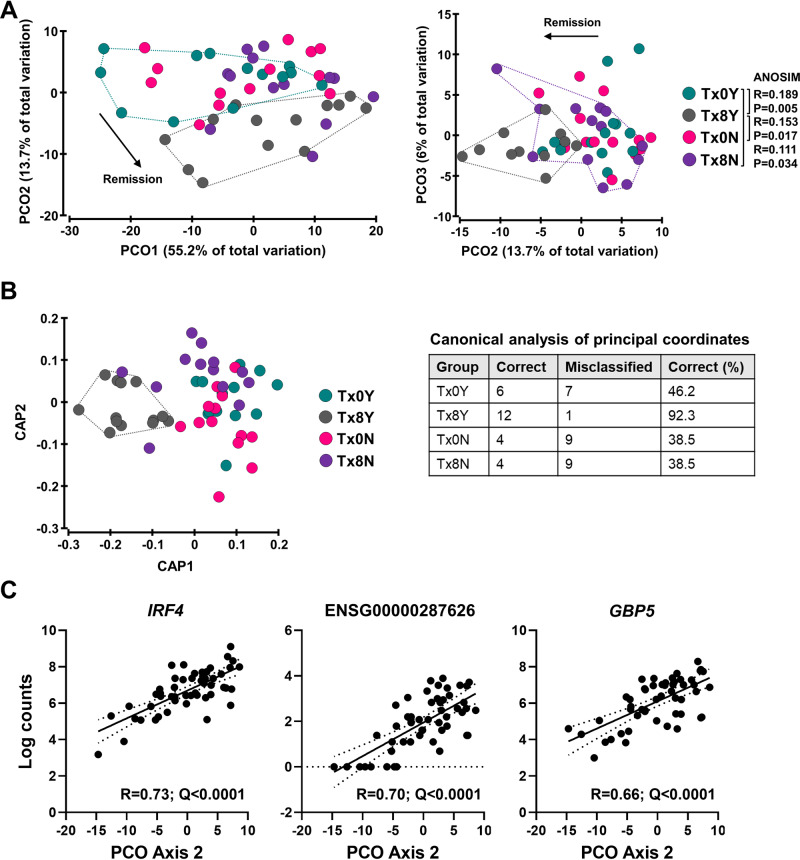
Host molecular responses to fecal microbiota transplantation (FMT) in ulcerative colitis are not well understood. Here, we profile the human colonic mucosal transcriptome prior to and following FMT or placebo to identify molecules regulated during disease remission. FMT alters the transcriptome above the effect of placebo (n = 75 vs 3 genes, q < 0.05), including modulation of structural, metabolic and inflammatory pathways. This response is attributed to responders with no consistency observed in non-responders. Regulated pathways in responders include tight junctions, calcium signalling and xenobiotic metabolism. Genes significantly regulated longitudinally in responders post-FMT could discriminate them from responders and non-responders at baseline and non-responders post-FMT, with GBP5 and IRF4 downregulation being associated with remission. Female mice with a deletion of GBP5 are more resistant to developing colitis than their wild-type littermates, showing higher colonic IRF4 phosphorylation. The colonic mucosal response discriminates UC remission following FMT, with GBP5 playing a detrimental role in colitis.


Conflict of interest statement

S.P. has served as a consultant for Finch Therapeutics and has received speaker fees from Ferring, Janssen and Takeda. T.J.B. has a pecuniary interest in the Centre for Digestive Diseases, is a medical advisor to Finch Therapeutics, RedHill Bio and Topelia Aust, and holds patents in FMT treatment. All other authors have no conflicts of interest to declare.

Figures

Fig. 1
Fig. 1. Fecal microbiota transplantation (FMT) has a substantial effect on host colonic mucosal responses.
A Sampling schema of human cohort. Tx0, baseline; Tx8, post FMT; P8, post placebo; Y, yes; N, no. B Volcano plot of differential gene expression following treatment with FMT for 8 weeks. Total genes identified by DESeq2 to be significantly regulated n = 75 (q < 0.05). Red, significantly upregulated; Green, significantly downregulated. C Significantly regulated pathways (q < 0.05) following FMT treatment for 8 weeks. Regulated pathways were identified using GAGE. D Volcano plot of differential gene expression following treatment with placebo for 8 weeks. Total genes identified by DESeq2 to be significantly regulated n = 3 (q < 0.05). E Significantly regulated pathways (q < 0.05) following placebo treatment for 8 weeks. F Genes identified to be differentially expressed (q < 0.2) within significantly regulated pathways of interest.
Fig. 2
Fig. 2. Responders to fecal microbiota transplantation (FMT) have pronounced effect on differential gene expression in their colonic mucosa that is not present in non-responders.
A Volcano plot of differential gene expression in responders following treatment with FMT for 8 weeks. Total genes identified by DESeq2 to be significantly regulated n = 78 (q < 0.05). Tx0Y, responder baseline; Tx8Y, responder post-FMT. Red, significantly upregulated; Green, significantly downregulated. B Volcano plot of differential gene expression in non-responders following treatment with FMT for 8 weeks. Total genes identified by DESeq2 to be significantly regulated n = 0 (q < 0.05). Tx0N, non-responder baseline; Tx8N, non-responder post-FMT. C Significantly regulated pathways (q < 0.05) in responders following FMT treatment for 8 weeks. Regulated pathways were identified using GAGE. D Significantly regulated pathways (q < 0.05) in non-responders following FMT treatment for 8 weeks as identified by GAGE. E Top regulated genes (n = 60) in pathways comprising the largest number of genes (tight junctions; calcium signaling). Genes were classified by q value and selection corresponded to q < 0.5.
Fig. 3
Fig. 3. Molecular mucosal changes in responders following fecal microbiota transplantation (FMT) differentiate them from non-responders cross-sectionally.
A Principal coordinate analysis (PCO) of differentially expressed genes in responders (n = 78 genes). Bray-Curtis similarities were calculated on log(x + 1) transformed normalized counts of host genes. Inter-group differences were tested using One-Way ANOSIM, with one-tailed significance computed by permutation, and only pair-wise differences with Tx8Y are shown. Tx0N, non-responder baseline (pink); Tx0Y, responder baseline (light blue); Tx8N, non-responder post-FMT (purple); Tx8Y, responder post-FMT (gray). B Constrained ordination using Canonical Analysis of Principal coordinates (CAP). Classification of samples according to group is presented in the table. C Top three genes significantly (q < 0.05) correlated with PCO axis 2. PCO axis 2 was chosen because the majority of variation between responders and non-responders post-FMT was observed on that axis. Pearson correlations were performed, and p values were corrected for false discovery rate (q value) using the Benjamini–Hochberg method. Source data are provided as a Source Data file.
Fig. 4
Fig. 4. Gbp5–/– mice are more resistant to colitis than wild-type littermates.
A Schema of experimental colitis model using littermate wild-type (WT) and Gbp5–/– mice. Mice were cohoused until 24 h prior to exposure to dextran sulfate sodium (DSS). B Change in body weight of mice throughout the 10 days of the model. Differences between groups were tested using Two-Way ANOVA with Šídák’s multiple comparisons test. Days 0–7 p > 0.8; Day 8: p = 0.044; Day 9: p = 0.0103; Day 10: p = 0.0065. Data are presented as mean ± SEM. *p < 0.05; **p < 0.01. C Representative images of colon lengths for littermate WT and Gbp5–/– mice. D Differences in colon lengths between littermate WT (n = 12) and Gbp5–/– (n = 14) mice at day 10. Data distribution was assessed using the Shapiro-Wilk test and differences were tested using a two-tailed unpaired t test (t = 2.86, p = 0.0087). Data are presented as mean ± SEM. **p < 0.01 E Haematoxylin and eosin staining of the colonic tissue of mice on day 10. Data are representative of three independent experiments. Scale bars, 1000 μm (top), 100 μm (bottom). Arrowheads indicate histological damage including inflammation, ulceration and hyperplasia. F Histological score of the colonic tissue of WT (n = 12) and Gbp5–/– (n = 14) mice on day 10 presented as mean ± SEM. Each symbol represents an individual mouse. Data distribution was assessed using the Shapiro-Wilk test and differences were tested using a two-tailed unpaired t test (t = 1.64, p = 0.11). G Histological scores of the colonic tissue of WT (n = 12) and Gbp5–/– (n = 14) mice on day 10 stratified by region and presented as mean ± SEM. Each symbol represents an individual mouse. Differences were tested using a two-way ANOVA with Šídák’s multiple comparisons test and statistical significance in the middle region was validated with a two-sided Mann-Whitney test (U = 41.5, p = 0.024). ns, not significant; *p < 0.05. Source data are provided as a Source Data file.
Fig. 5
Fig. 5. Differential protein regulation between Gbp5–/– and WT littermates.
A Expression and phosphorylation of proteins of interest in littermate WT (n = 5) and Gbp5–/– (n = 5) mice at day 10. Band volume was employed for densitometry and differences were tested using two-tailed unpaired t-tests following assessment of data distribution by the Shapiro-Wilk test. All p > 0.22 except P-IRF4/T-IRF4 p = 0.0004. Data are presented as mean ± SEM. NS, not significant; ***p < 0.001. B Quantification of claudin 2-positive area over total colon tissue area in littermate WT (n = 6) and Gbp5–/– (n = 6) mice at day 10. Each symbol represents an individual mouse. NS, not statistically significant; **p < 0.01 (p = 0.0018) by two-way ANOVA with Šídák’s multiple comparisons test following confirmation of data distribution by the Shapiro-Wilk test. Data are presented as mean ± SEM. C Immunohistochemical staining of claudin 2, β-Actin and 4′,6-diamidino-2-phenylindole (DAPI) in the colon tissue of littermate WT and Gbp5–/– mice on day 10. Scale bar, 50 μm. Source data are provided as a Source Data file.

References

    1. Sartor RB. Therapeutic manipulation of the enteric microflora in inflammatory bowel diseases: antibiotics, probiotics, and prebiotics. Gastroenterology. 2004;126:1620–1633. doi: 10.1053/j.gastro.2004.03.024. - DOI - PubMed
    1. Frolkis AD, et al. Risk of surgery for inflammatory bowel diseases has decreased over time: a systematic review and meta-analysis of population-based studies. Gastroenterology. 2013;145:996–1006. doi: 10.1053/j.gastro.2013.07.041. - DOI - PubMed
    1. Lemaitre M, et al. Association between use of thiopurines or tumor necrosis factor antagonists alone or in combination and risk of lymphoma in patients with inflammatory bowel disease. JAMA. 2017;318:1679–1686. doi: 10.1001/jama.2017.16071. - DOI - PMC - PubMed
    1. Costello SP, et al. Effect of fecal microbiota transplantation on 8-week remission in patients with ulcerative colitis: a randomized clinical trial. JAMA. 2019;321:156–164. doi: 10.1001/jama.2018.20046. - DOI - PMC - PubMed
    1. Haifer C, et al. Lyophilised oral faecal microbiota transplantation for ulcerative colitis (LOTUS): a randomised, double-blind, placebo-controlled trial. Lancet Gastroenterol. Hepatol. 2022;7:141–151. doi: 10.1016/S2468-1253(21)00400-3. - DOI - PubMed