. 2024 Mar 26;14(1):7151.
doi: 10.1038/s41598-024-57750-3.

Homocysteine metabolites inhibit autophagy by upregulating miR-21-5p, miR-155-5p, miR-216-5p, and miR-320c-3p in human vascular endothelial cells

Affiliations

Homocysteine metabolites inhibit autophagy by upregulating miR-21-5p, miR-155-5p, miR-216-5p, and miR-320c-3p in human vascular endothelial cells

Łukasz Witucki et al. Sci Rep. .

Abstract

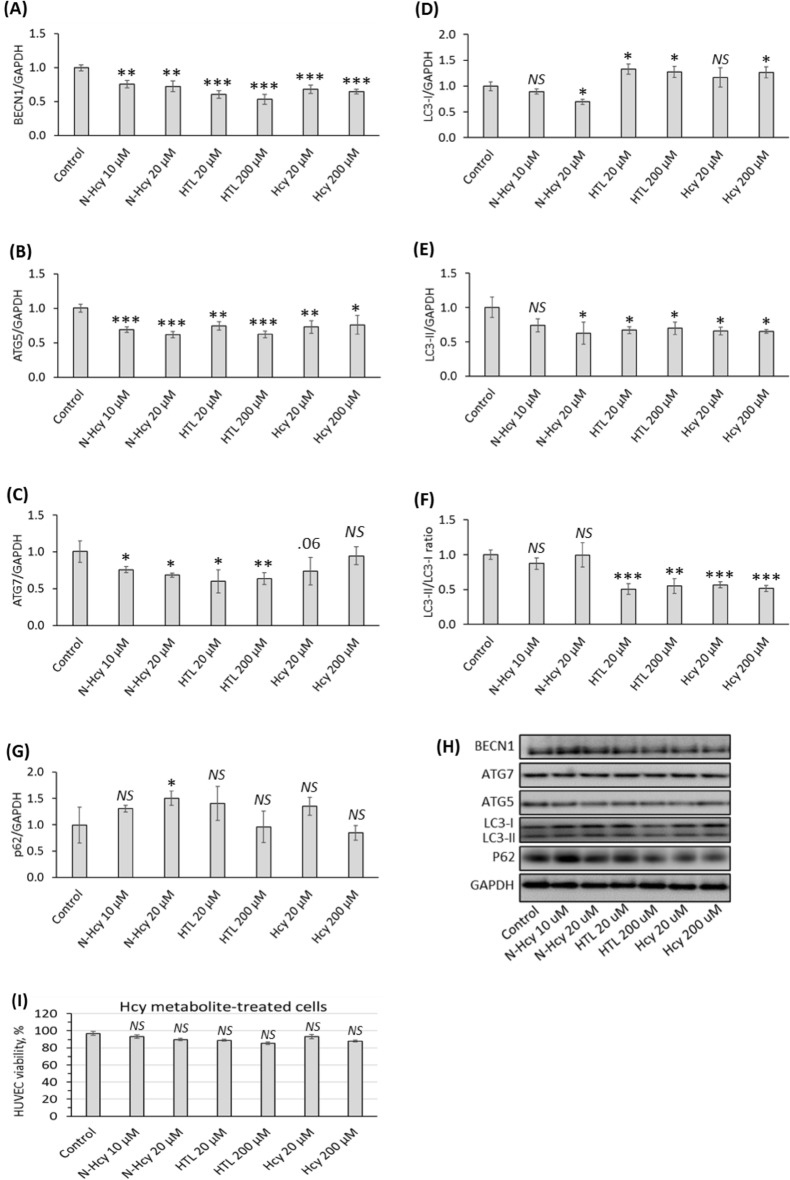
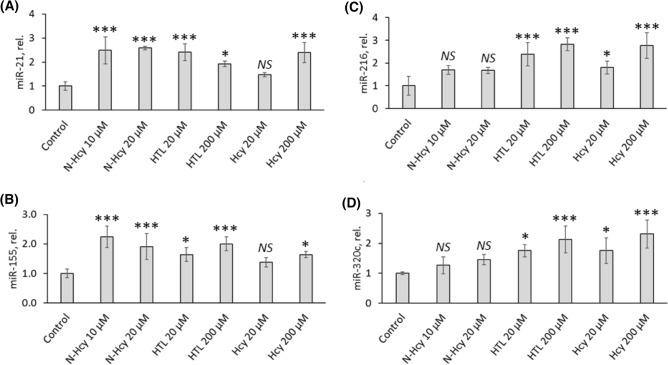
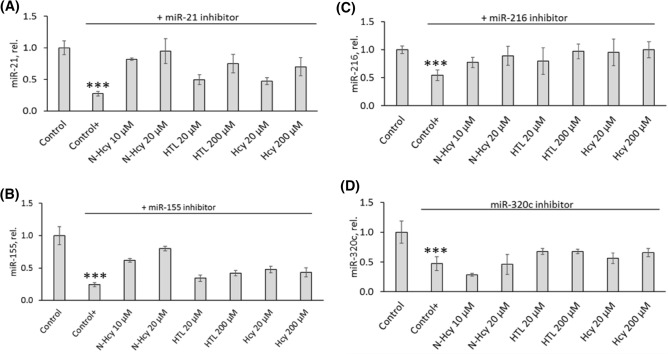
Nutritional and genetic deficiencies in homocysteine (Hcy) metabolism lead to hyperhomocysteinemia (HHcy) and cause endothelial dysfunction, a hallmark of atherosclerosis, which is a major cause of cardiovascular disease (CVD). Impaired autophagy causes the accumulation of damaged proteins and organelles and is associated with CVD. Biochemically, HHcy is characterized by elevated levels of Hcy and its metabolites, Hcy-thiolactone and N-Hcy-protein. However, whether these metabolites can dysregulate mTOR signaling and autophagy in endothelial cells is not known. Here, we examined the influence of Hcy-thiolactone, N-Hcy-protein, and Hcy on autophagy human umbilical vein endothelial cells. We found that treatments with Hcy-thiolactone, N-Hcy-protein, or Hcy significantly downregulated beclin 1 (BECN1), autophagy-related 5 (ATG5), autophagy-related 7 (ATG7), and microtubule-associated protein 1 light chain 3 (LC3) mRNA and protein levels. We also found that these changes were mediated by upregulation by Hcy-thiolactone, N-Hcy-protein, and Hcy of autophagy-targeting microRNA (miR): miR-21, miR-155, miR-216, and miR-320c. The effects of these metabolites on levels of miR targeting autophagy as well as on the levels of BECN1, ATG5, ATG7, and LC3 mRNA and protein were abrogated by treatments with inhibitors of miR-21, miR-155, miR-216, and mir320c. Taken together, our findings show that Hcy metabolites can upregulate miR-21, miR-155, miR-216, and mir320c, which then downregulate autophagy in human endothelial cells, important for vascular homeostasis.

Keywords: Autophagy; Endothelial dysfunction; HUVEC; Homocysteine metabolites; microRNA.


Conflict of interest statement

The authors declare no competing interests.

Figures

Figure 1
Figure 1
Influence of N-Hcy-protein, Hcy-thiolactone, and Hcy on the expression of autophagy-related proteins in HUVEC. Bar graphs show levels of BECN1 protein (A), ATG5 protein (B), ATG7 protein (C), LC3-I (D), LC3-II (E), LC3-II/LC3-I ratio (F), and p62 protein (G) in HUVEC treated with N-Hcy-protein (N-Hcy), Hcy-thiolactone (HTL), or Hcy in methionine-free M199/dialyzed FBS medium for 24 h. Showed proteins were quantified by Western blotting. GAPDH was used as reference for the quantification of other proteins. Panel (H) shows representative images of Western blots. The treatments with Hcy, N-Hcy, and HTL did not affect HUVEC viability (I). Each assay was repeated three times (technical repeats) in three independent experiments (biological repeats). Mean ± SD values of three biological repeats for each treatment group are shown. *P < 0.05, **P < 0.01, ***P < 0.001 from one-way ANOVA with Tukey’s multiple comparisons test.
Figure 2
Figure 2
Influence of N-Hcy-protein, Hcy-thiolactone, and Hcy on the expression of autophagy-related mRNAs in HUVEC. Bar graphs show levels of BECN1 mRNA (A), ATG5 mRNA (B), ATG7 mRNA (C), LC3 mRNA (D), and p62 mRNA (E) in HUVEC treated with N-Hcy-protein (N-Hcy), Hcy-thiolactone (HTL), or Hcy in methionine-free M199/dialyzed FBS medium for 24 h. Showed mRNAs were quantified by RT-qPCR with GAPDH mRNA as a reference. Each assay was repeated three times (technical repeats) in three independent experiments (biological repeats). Mean ± SD values of three biological repeats for each treatment group are shown. *P < 0.05, **P < 0.01, ***P < 0.001 from one-way ANOVA with Tukey’s multiple comparisons test.
Figure 3
Figure 3
N-Hcy-protein, Hcy-thiolactone, and Hcy upregulate the expression of autophagy-related miRs in HUVEC. Bar graphs show levels of miR-21 (A), miR-155 (B), miR-216 (C), and miR-320c (D) in HUVEC treated with N-Hcy-protein (N-Hcy), Hcy-thiolactone (HTL), or Hcy for 24 h. The expression of miRs was quantified by RT-qPCR with 18S rRNA and U6 snRNA as references. Each assay was repeated three times (technical repeats) in three independent experiments (biological repeats). Mean ± SD values of three biological repeats for each treatment group are shown. *P < 0.05, **P < 0.01, ***P < 0.001 from one-way ANOVA with Tukey’s multiple comparisons test.
Figure 4
Figure 4
miR inhibitors abrogate stimulatory effects of N-Hcy-protein, Hcy-thiolactone, and Hcy on autophagy-related miR expression. Bar graphs show levels of miR-21 (A), miR-155 (B), miR-216 (C), and miR-320c (D) in HUVEC transfected with mirVana™ miRNA Mimic, Negative Control #1 (Control) or corresponding miR inhibitors for 4 h. The cells transfected with a miR inhibitor were then untreated (Control+) or treated with N-Hcy-protein (N-Hcy), Hcy-thiolactone (HTL), or Hcy in methionine-free M199/dialyzed FBS medium for 24 h. The expression of miRs was quantified by RT-qPCR with 18S rRNA and U6 snRNA as references. Each assay was repeated three times (technical repeats) in three independent experiments (biological repeats). Mean ± SD values of three biological repeats for each treatment group are shown. *P < 0.05, **P < 0.01, ***P < 0.001 from Student’s two-tailed t test.
Figure 5
Figure 5
miR inhibitors abrogate stimulatory effects of N-Hcy-protein, Hcy-thiolactone, and Hcy on autophagy-related mRNA expression. Bar graphs show levels of BECN1 mRNA (A,B), LC3 mRNA (CE), p62 mRNA (F), ATG5 mRNA (G,H), and ATG7 mRNA (I) in HUVEC treated with N-Hcy-protein (N-Hcy), Hcy-thiolactone (HTL), or Hcy in HUVEC transfected with mirVana™ miRNA Mimic, Negative Control #1 (Control) or corresponding miR inhibitors for 4 h. The cells transfected with a miR inhibitor were then untreated (Control+) or treated with N-Hcy-protein (N-Hcy), Hcy-thiolactone (HTL), or Hcy in methionine-free M199/dialyzed FBS medium for 24 h. Levels of mRNAs were quantified by RT-qPCR with GAPDH mRNA as a reference. Each assay was repeated three times (technical repeats) in three independent experiments (biological repeats). Mean ± SD values of three biological repeats for each treatment group are shown. *P < 0.05, **P < 0.01, ***P < 0.001 from Student’s two-tailed t test.
Figure 6
Figure 6
Influence of N-Hcy-protein, Hcy-thiolactone, and Hcy on the expression of autophagy-related proteins in HUVEC in the presence of a corresponding miR inhibitor. Bar graphs show levels of BECN1 protein (A,B), LC3-II protein (CE), LC3-II/LC3-I ratio (FH), LC3-I (I), p62 protein (J), ATG5 protein (K,L), and ATG7 protein (M) in HUVEC transfected with mirVana™ miRNA Mimic, Negative Control #1 (Control) or a corresponding miR inhibitor for 4 h. The cells transfected with a miR inhibitor were then untreated (Control+) or treated with N-Hcy, HTL, or Hcy in methionine-free M199/dialyzed FBS medium for 24 h. Indicated proteins were quantified by Western blotting with GAPDH protein as a reference; representative images are shown in panels (NQ). Each assay was repeated three times (technical repeats) in three independent experiments (biological repeats). Mean ± SD values of three biological repeats for each treatment group are shown. *P < 0.05, **P < 0.01, ***P < 0.001 from a Student’s two-tailed t test.

Similar articles

Cited by

References

    1. Libby P. Inflammation in atherosclerosis. Nature. 2002;420:868–874. doi: 10.1038/nature01323. - DOI - PubMed
    1. Ross R. Atherosclerosis—An inflammatory disease. N. Engl. J. Med. 1999;340:115–126. doi: 10.1056/NEJM199901143400207. - DOI - PubMed
    1. Lentz SR. Mechanisms of homocysteine-induced atherothrombosis. J. Thromb. Haemost. 2005;3:1646–1654. doi: 10.1111/j.1538-7836.2005.01364.x. - DOI - PubMed
    1. Dayal S, Lentz SR. Murine models of hyperhomocysteinemia and their vascular phenotypes. Arterioscler. Thromb. Vasc. Biol. 2008;28:1596–1605. doi: 10.1161/ATVBAHA.108.166421. - DOI - PMC - PubMed
    1. Esse R, Barroso M, Tavares de Almeida I, Castro R. The contribution of homocysteine metabolism disruption to endothelial dysfunction: State-of-the-art. Int. J. Mol. Sci. 2019;20:867. doi: 10.3390/ijms20040867. - DOI - PMC - PubMed

MeSH terms