

Analysis of the global transcriptome and miRNAome associated with seed dormancy during seed maturation in rice (Oryza sativa L. cv. Nipponbare)
- PMID: 38532331
- PMCID: PMC10964676
- DOI: 10.1186/s12870-024-04928-6
Analysis of the global transcriptome and miRNAome associated with seed dormancy during seed maturation in rice (Oryza sativa L. cv. Nipponbare)
Abstract
Background: Seed dormancy is a biological mechanism that prevents germination until favorable conditions for the subsequent generation of plants are encountered. Therefore, this mechanism must be effectively established during seed maturation. Studies investigating the transcriptome and miRNAome of rice embryos and endosperms at various maturation stages to evaluate seed dormancy are limited. This study aimed to compare the transcriptome and miRNAome of rice seeds during seed maturation.
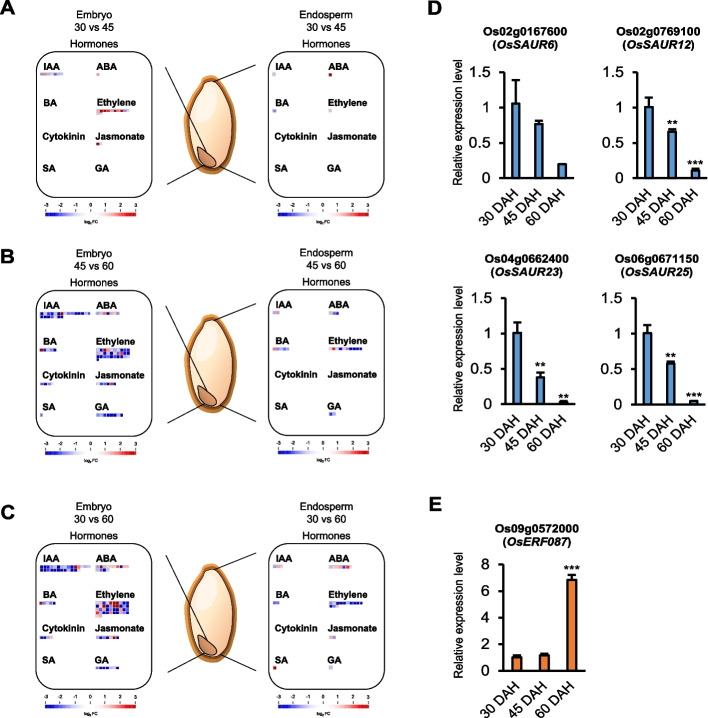
Results: Oryza sativa L. cv. Nipponbare seeds were sampled for embryos and endosperms at three maturation stages: 30, 45, and 60 days after heading (DAH). The pre-harvest sprouting (PHS) assay was conducted to assess the level of dormancy in the seeds at each maturation stage. At 60 DAH, the PHS rate was significantly increased compared to those at 30 and 45 DAH, indicating that the dormancy is broken during the later maturation stage (45 DAH to 60 DAH). However, the largest number of differentially expressed genes (DEGs) and differentially expressed miRNAs (DEmiRs) were identified between 30 and 60 DAH in the embryo and endosperm, implying that the gradual changes in genes and miRNAs from 30 to 60 DAH may play a significant role in breaking seed dormancy. Gene Ontology (GO) and Kyoto Encyclopedia of Genes and Genomes (KEGG) pathway analyses confirmed that DEGs related to plant hormones were most abundant in the embryo during 45 DAH to 60 DAH and 30 DAH to 60 DAH transitions. Alternatively, most of the DEGs in the endosperm were related to energy and abiotic stress. MapMan analysis and quantitative real-time polymerase chain reaction identified four newly profiled auxin-related genes (OsSAUR6/12/23/25) and one ethylene-related gene (OsERF087), which may be involved in seed dormancy during maturation. Additionally, miRNA target prediction (psRNATarget) and degradome dataset (TarDB) indicated a potential association between osa-miR531b and ethylene biosynthesis gene (OsACO4), along with osa-miR390-5p and the abscisic acid (ABA) exporter-related gene (OsMATE19) as factors involved in seed dormancy.
Conclusions: Analysis of the transcriptome and miRNAome of rice embryos and endosperms during seed maturation provided new insights into seed dormancy, particularly its relationship with plant hormones such as ABA, auxin, and ethylene.
Keywords: Plant hormone; Rice; Seed dormancy; Seed maturation; Transcriptome; miRNAome.
© 2024. The Author(s).
Conflict of interest statement
The authors declare no competing interests.
Figures


Similar articles
-
Microarray-based gene expression analysis of strong seed dormancy in rice cv. N22 and less dormant mutant derivatives.Plant Physiol Biochem. 2016 Feb;99:27-38. doi: 10.1016/j.plaphy.2015.12.001. Epub 2015 Dec 9. Plant Physiol Biochem. 2016. PMID: 26713549
-
Transcriptome analysis of knockout mutants of rice seed dormancy gene OsVP1 and Sdr4.Plant Cell Rep. 2023 Feb;42(2):309-319. doi: 10.1007/s00299-022-02958-8. Epub 2022 Nov 29. Plant Cell Rep. 2023. PMID: 36445461
-
Genetic Dissection of Seed Dormancy using Chromosome Segment Substitution Lines in Rice (Oryza sativa L.).Int J Mol Sci. 2020 Feb 17;21(4):1344. doi: 10.3390/ijms21041344. Int J Mol Sci. 2020. PMID: 32079255 Free PMC article.
-
Exploring fine tuning between phytohormones and ROS signaling cascade in regulation of seed dormancy, germination and seedling development.Plant Physiol Biochem. 2024 Feb;207:108352. doi: 10.1016/j.plaphy.2024.108352. Epub 2024 Jan 14. Plant Physiol Biochem. 2024. PMID: 38266558 Review.
-
Dormancy and germination: How does the crop seed decide?Plant Biol (Stuttg). 2015 Nov;17(6):1104-12. doi: 10.1111/plb.12356. Epub 2015 Jul 14. Plant Biol (Stuttg). 2015. PMID: 26095078 Review.
Cited by
-
Molecular characteristics and expression pattern of the FAR1 gene during spike sprouting in quinoa.Sci Rep. 2024 Nov 18;14(1):28485. doi: 10.1038/s41598-024-79474-0. Sci Rep. 2024. PMID: 39557968 Free PMC article.
-
Non-coding RNA-mediated regulation of seed endosperm development.Front Plant Sci. 2025 Aug 8;16:1640284. doi: 10.3389/fpls.2025.1640284. eCollection 2025. Front Plant Sci. 2025. PMID: 40860731 Free PMC article. Review.
-
Genome-Wide In Silico Analysis of 1-Aminocyclopropane-1-carboxylate oxidase (ACO) Gene Family in Rice (Oryza sativa L.).Plants (Basel). 2024 Dec 13;13(24):3490. doi: 10.3390/plants13243490. Plants (Basel). 2024. PMID: 39771188 Free PMC article.
-
Whole-genome meta-analysis coupled with haplotype analysis reveal new genes and functional haplotypes conferring pre-harvest sprouting in rice.BMC Plant Biol. 2025 Apr 25;25(1):527. doi: 10.1186/s12870-025-06551-5. BMC Plant Biol. 2025. PMID: 40275165 Free PMC article.
-
Comparative transcriptomes and WGCNA reveal hub genes for spike germination in different quinoa lines.BMC Genomics. 2024 Dec 20;25(1):1231. doi: 10.1186/s12864-024-11151-y. BMC Genomics. 2024. PMID: 39707180 Free PMC article.
References
-
- Donohue K, Dorn L, Griffith C, Kim E, Aguilera A, Polisetty CR, Schmitt J. Environmental and genetic influences on the germination of Arabidopsis thallana in the field. Evolution. 2005;59(4):740–757. - PubMed
MeSH terms
Substances
Grants and funding
LinkOut - more resources
Full Text Sources
