

Identification of novel protein biomarkers from the blood and urine for the early diagnosis of bladder cancer via proximity extension analysis
- PMID: 38532419
- PMCID: PMC10967215
- DOI: 10.1186/s12967-024-04951-z
Identification of novel protein biomarkers from the blood and urine for the early diagnosis of bladder cancer via proximity extension analysis
Abstract
Background: Bladder cancer (BC) is a very common urinary tract malignancy that has a high incidence and lethality. In this study, we identified BC biomarkers and described a new noninvasive detection method using serum and urine samples for the early detection of BC.
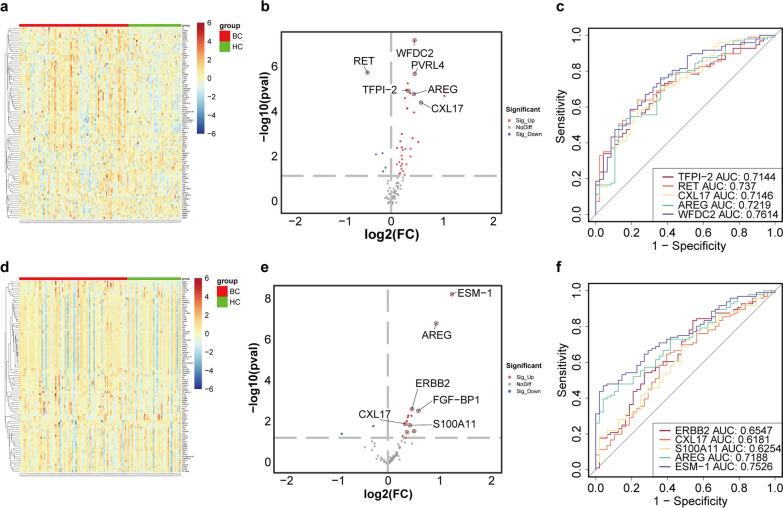
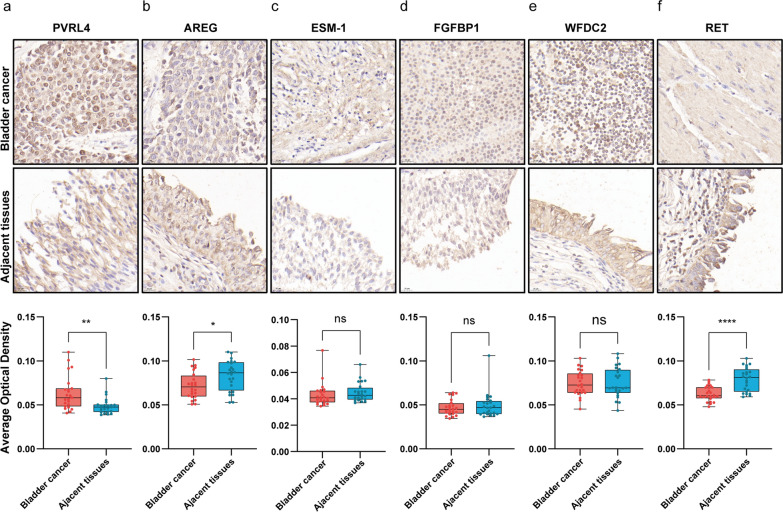
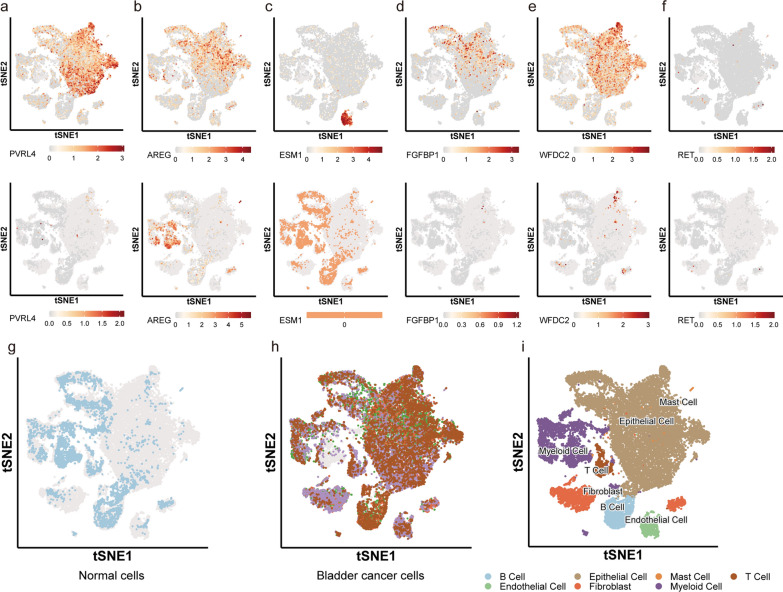
Methods: Serum and urine samples were retrospectively collected from patients with BC (n = 99) and healthy controls (HC) (n = 50), and the expression levels of 92 inflammation-related proteins were examined via the proximity extension analysis (PEA) technique. Differential protein expression was then evaluated by univariate analysis (p < 0.05). The expression of the selected potential marker was further verified in BC and adjacent tissues by immunohistochemistry (IHC) and single-cell sequencing. A model was constructed to differentiate BC from HC by LASSO regression and compared to the detection capability of FISH.
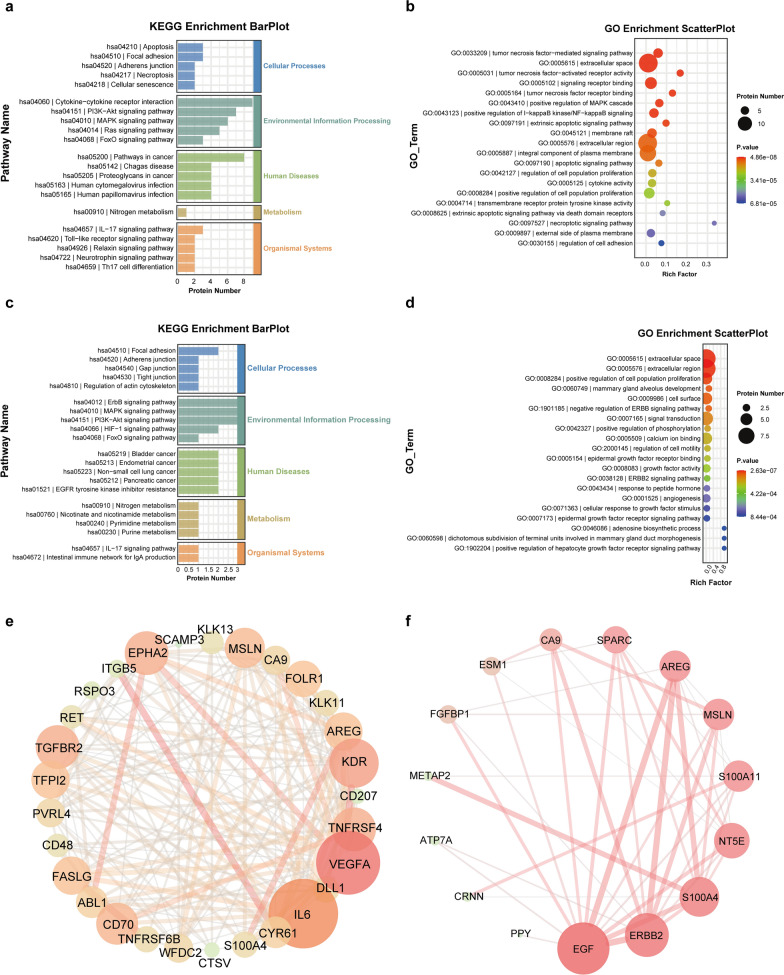
Results: The univariate analysis revealed significant differences in the expression levels of 40 proteins in the serum (p < 0.05) and 17 proteins in the urine (p < 0.05) between BC patients and HC. Six proteins (AREG, RET, WFDC2, FGFBP1, ESM-1, and PVRL4) were selected as potential BC biomarkers, and their expression was evaluated at the protein and transcriptome levels by IHC and single-cell sequencing, respectively. A diagnostic model (a signature) consisting of 14 protein markers (11 in serum and three in urine) was also established using LASSO regression to distinguish between BC patients and HC (area under the curve = 0.91, PPV = 0.91, sensitivity = 0.87, and specificity = 0.82). Our model showed better diagnostic efficacy than FISH, especially for early-stage, small, and low-grade BC.
Conclusion: Using the PEA method, we identified a panel of potential protein markers in the serum and urine of BC patients. These proteins are associated with the development of BC. A total of 14 of these proteins can be used to detect early-stage, small, low-grade BC. Thus, these markers are promising for clinical translation to improve the prognosis of BC patients.
Keywords: Biomarkers; Bladder cancer; Diagnosis; Diagnostic model; Prognosis proximity extension assay (PEA).
© 2024. The Author(s).
Conflict of interest statement
The authors declare that they have no known competing financial interests or personal relationships that might have influenced the work reported herein.
Figures


Similar articles
-
UBE2C cell-free RNA in urine can discriminate between bladder cancer and hematuria.Oncotarget. 2016 Sep 6;7(36):58193-58202. doi: 10.18632/oncotarget.11277. Oncotarget. 2016. PMID: 27528424 Free PMC article.
-
Unveiling urinary extracellular vesicle mRNA signature for early diagnosis and prognosis of bladder cancer.Theranostics. 2025 Jan 1;15(4):1272-1284. doi: 10.7150/thno.107213. eCollection 2025. Theranostics. 2025. PMID: 39816677 Free PMC article.
-
A noninvasive urine-based methylation biomarker panel to detect bladder cancer and discriminate cancer grade.Urol Oncol. 2020 Jun;38(6):603.e1-603.e7. doi: 10.1016/j.urolonc.2020.01.007. Epub 2020 Feb 18. Urol Oncol. 2020. PMID: 32081560
-
LC-MS metabolomics of urine reveals distinct profiles for non-muscle-invasive and muscle-invasive bladder cancer.World J Urol. 2022 Oct;40(10):2387-2398. doi: 10.1007/s00345-022-04136-7. Epub 2022 Sep 4. World J Urol. 2022. PMID: 36057894 Review.
-
Urinary markers in the everyday diagnosis of bladder cancer.Urologia. 2013 Sep-Dec;80(4):265-75. doi: 10.5301/urologia.5000041. Epub 2013 Nov 29. Urologia. 2013. PMID: 24419920 Review.
Cited by
-
Detection of Human Bladder Epithelial Cancerous Cells with Atomic Force Microscopy and Machine Learning.Cells. 2024 Dec 26;14(1):14. doi: 10.3390/cells14010014. Cells. 2024. PMID: 39791715 Free PMC article.
-
Deciphering the molecular heterogeneity of intermediate- and (very-)high-risk non-muscle-invasive bladder cancer using multi-layered -omics studies.Front Oncol. 2024 Oct 21;14:1424293. doi: 10.3389/fonc.2024.1424293. eCollection 2024. Front Oncol. 2024. PMID: 39497708 Free PMC article.
-
RNF19A inhibits bladder cancer progression by regulating ILK ubiquitination and inactivating the AKT/mTOR signalling pathway.Biol Direct. 2024 Nov 6;19(1):102. doi: 10.1186/s13062-024-00562-2. Biol Direct. 2024. PMID: 39508245 Free PMC article.
-
Unleashing the power of urine‑based biomarkers in diagnosis, prognosis and monitoring of bladder cancer (Review).Int J Oncol. 2025 Mar;66(3):18. doi: 10.3892/ijo.2025.5724. Epub 2025 Feb 7. Int J Oncol. 2025. PMID: 39917986 Free PMC article. Review.
-
State of omics-based microbial diagnostics of CRC.Gut Microbes. 2025 Dec;17(1):2526132. doi: 10.1080/19490976.2025.2526132. Epub 2025 Jul 2. Gut Microbes. 2025. PMID: 40601369 Free PMC article. Review.
References
-
- Bladder cancer. Nat Rev Dis Primers. 2017. 3(1):17023. - PubMed
Publication types
MeSH terms
Substances
Grants and funding
- No. 2019A-14-C/The study was supported by 3315 Innovation Team Foundation of Ningbo
- 22105124/Nature Science Foundation of China
- No. 2021J037/Natural Science Foundation of Ningbo
- No. 2021SZKY0203/The Foundation of the Director of Ningbo Institute of Materials Technology and Engineering (NIMTE), CAS
- 2023RC079/The Medicine and Hygiene Program of Zhejiang Province, Youth Innovation Project
LinkOut - more resources
Full Text Sources
Medical
Research Materials
