. 2024 Mar 27;23(1):65.
doi: 10.1186/s12943-024-01979-z.

Exosomal long non-coding RNA TRPM2-AS promotes angiogenesis in gallbladder cancer through interacting with PABPC1 to activate NOTCH1 signaling pathway

Affiliations

Exosomal long non-coding RNA TRPM2-AS promotes angiogenesis in gallbladder cancer through interacting with PABPC1 to activate NOTCH1 signaling pathway

Zhiqiang He et al. Mol Cancer. .

Abstract

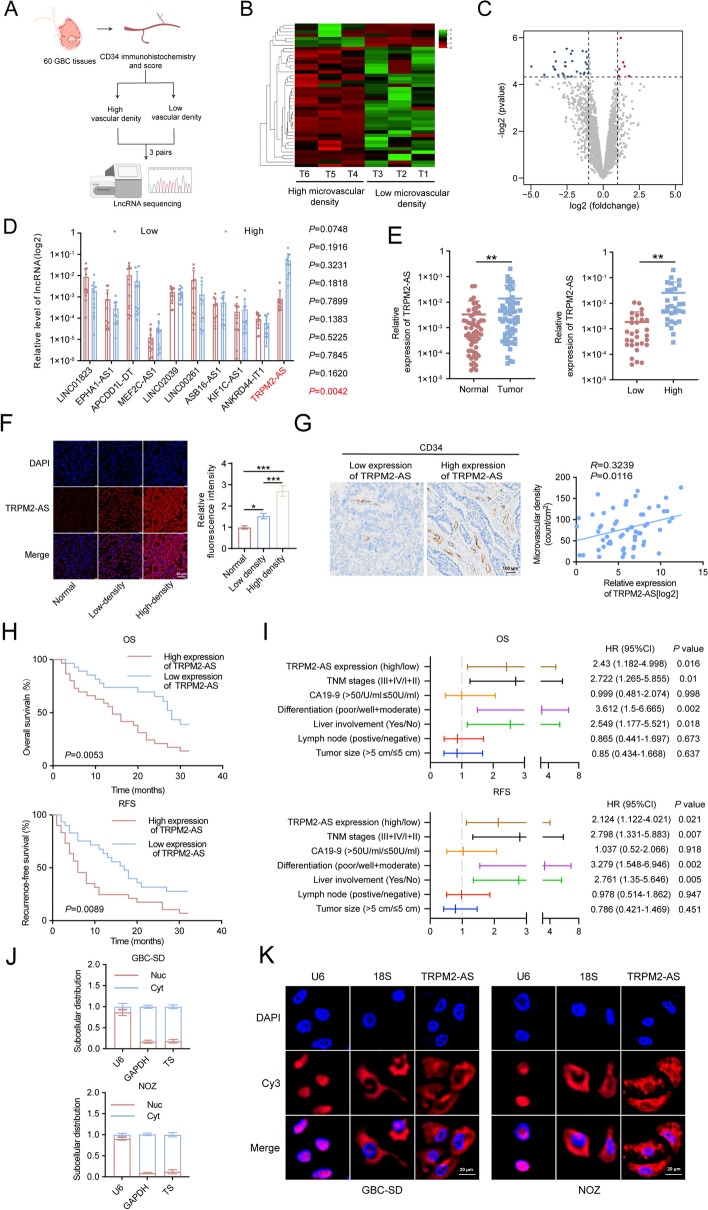
Background: Abnormal angiogenesis is crucial for gallbladder cancer (GBC) tumor growth and invasion, highlighting the importance of elucidating the mechanisms underlying this process. LncRNA (long non-coding RNA) is widely involved in the malignancy of GBC. However, conclusive evidence confirming the correlation between lncRNAs and angiogenesis in GBC is lacking.

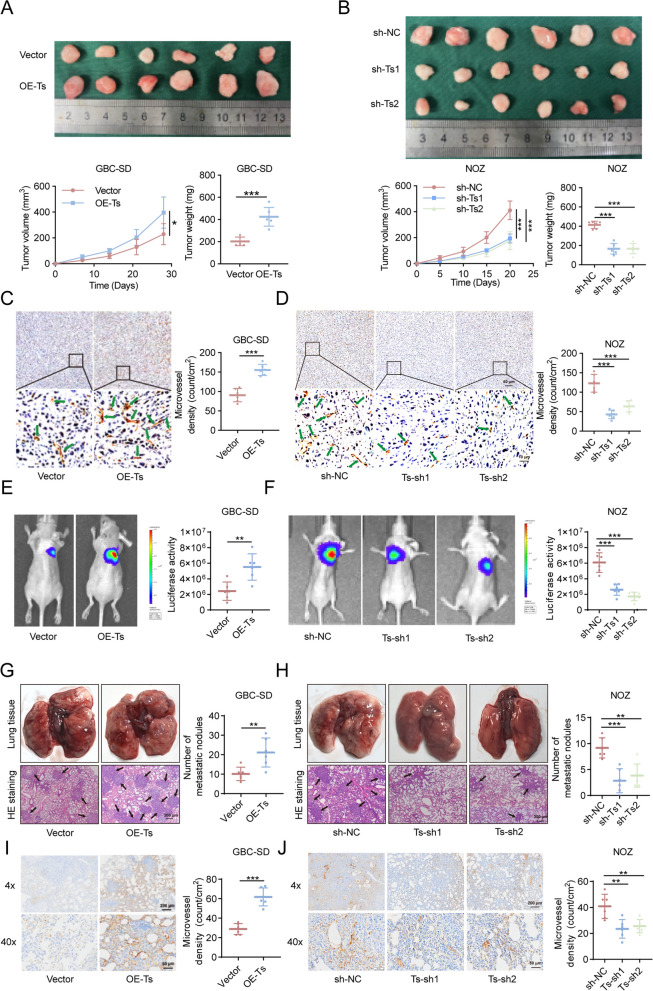
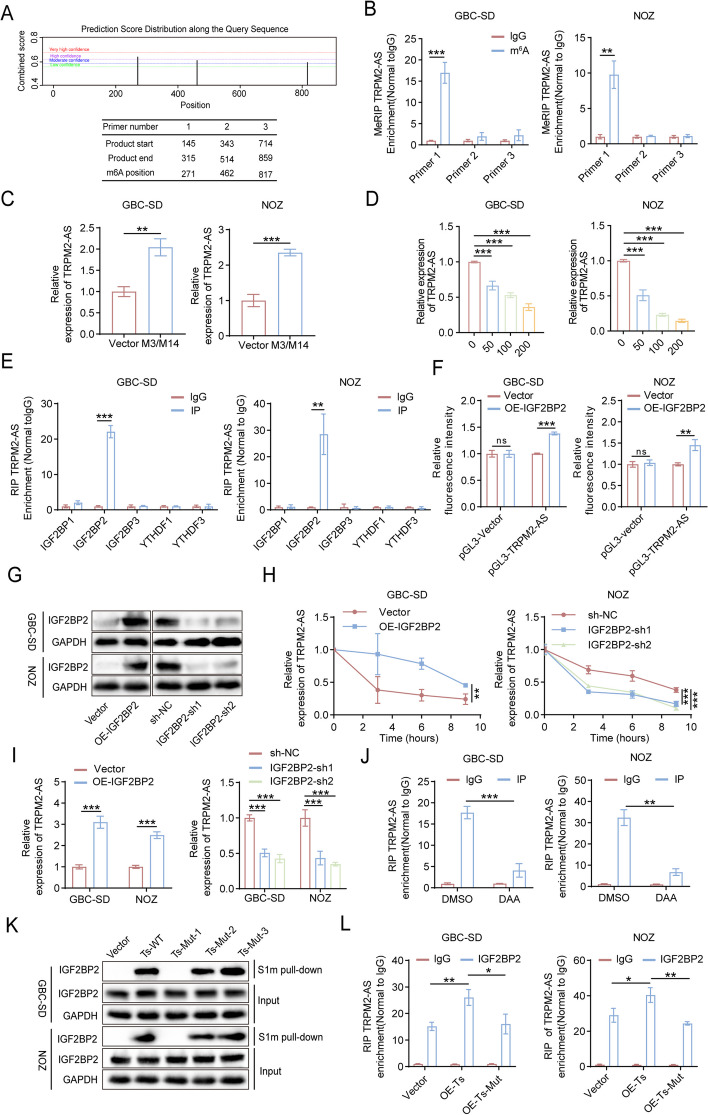
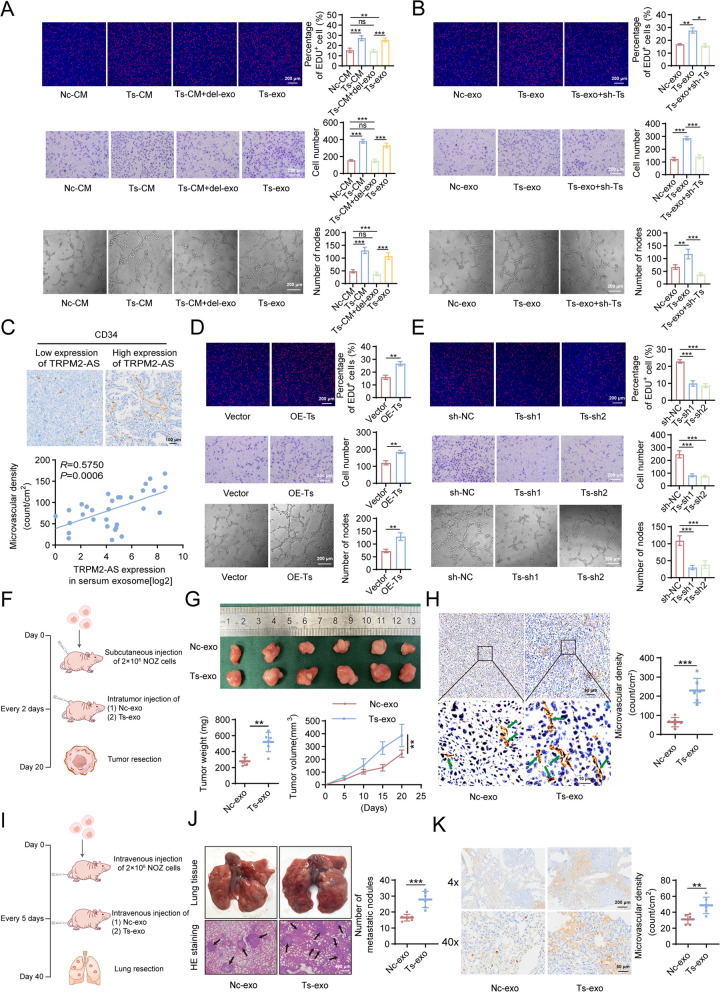
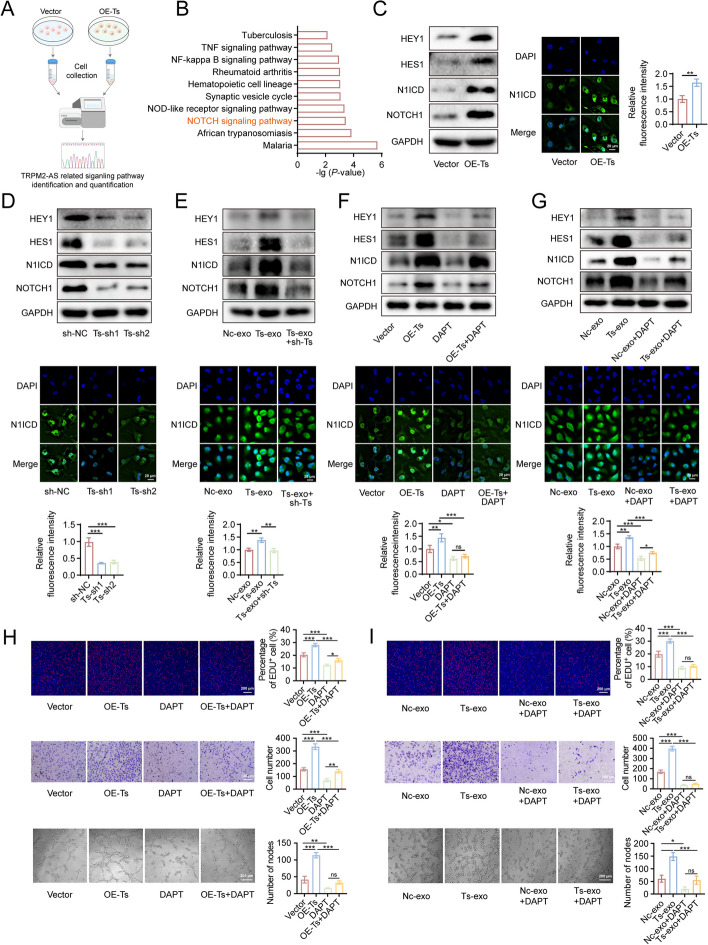
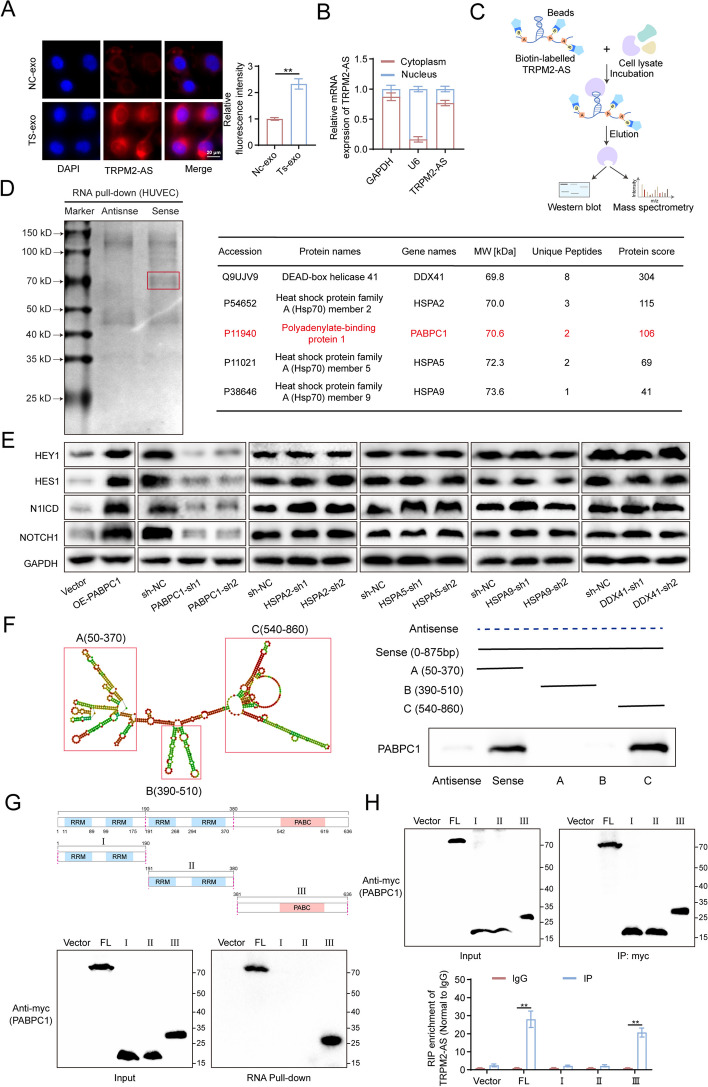
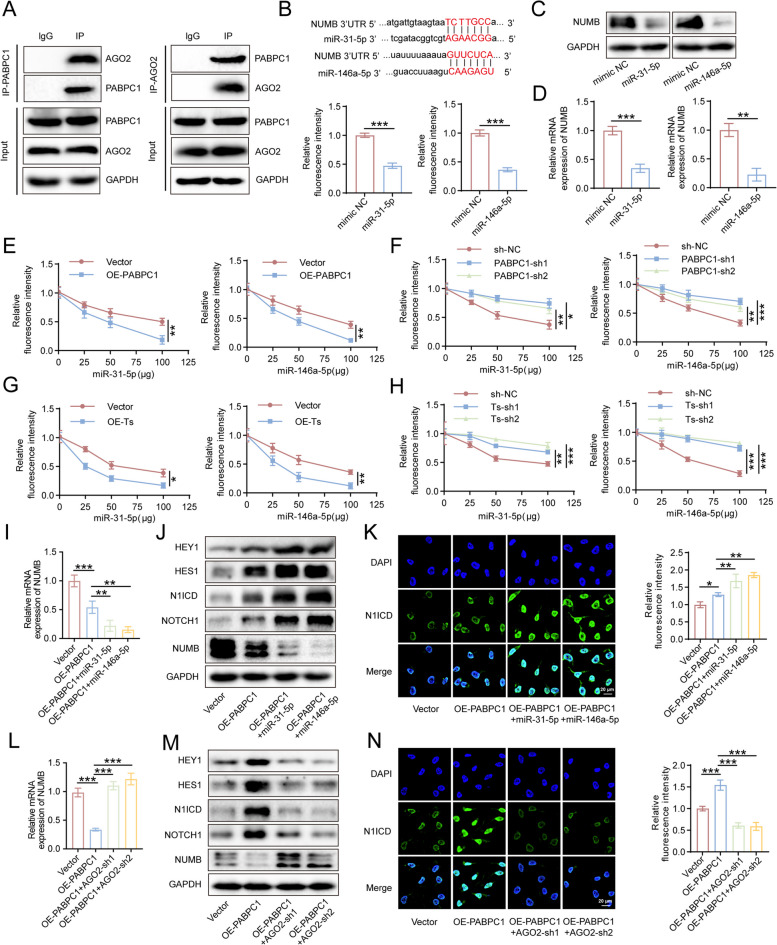
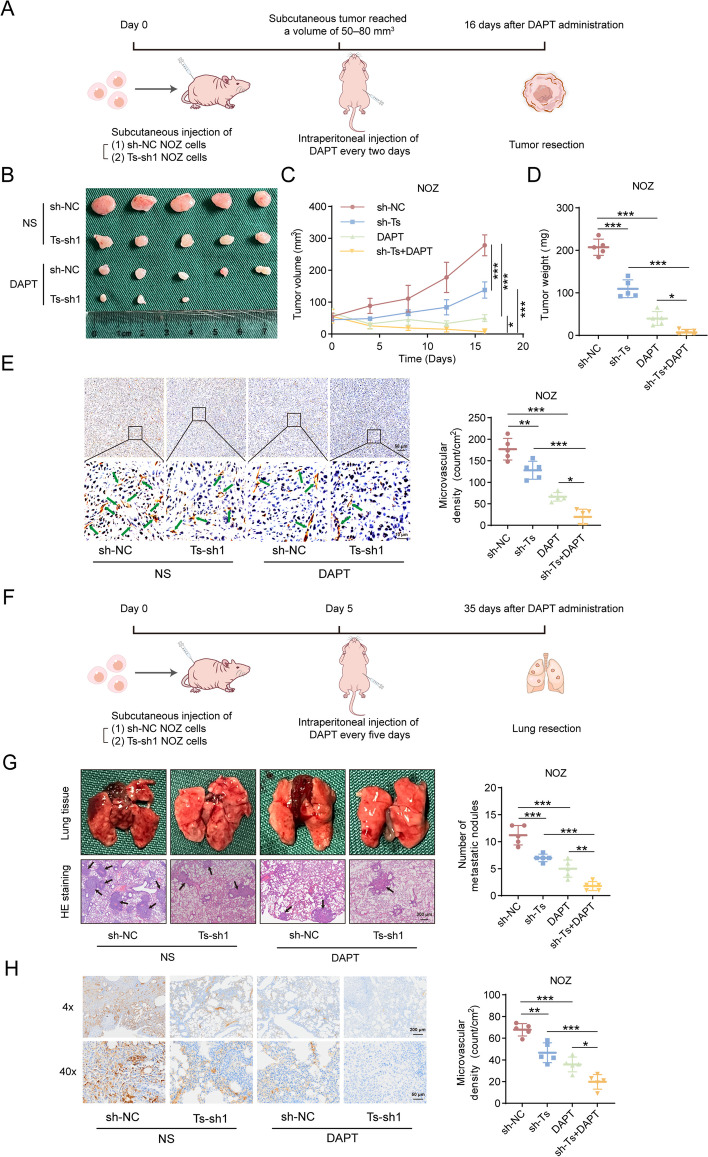
Methods: LncRNA sequencing was performed to identify the differentially expressed lncRNAs. RT-qPCR, western blot, FISH, and immunofluorescence were used to measure TRPM2-AS and NOTCH1 signaling pathway expression in vitro. Mouse xenograft and lung metastasis models were used to evaluate the biological function of TRPM2-AS during angiogenesis in vivo. EDU, transwell, and tube formation assays were used to detect the angiogenic ability of HUVECs. RIP, RAP, RNA pull-down, dual-luciferase reporter system, and mass spectrometry were used to confirm the interaction between TRPM2-AS, IGF2BP2, NUMB, and PABPC1.

Results: TRPM2-AS was upregulated in GBC tissues and was closely related to angiogenesis and poor prognosis in patients with GBC. The high expression level and stability of TRPM2-AS benefited from m6A modification, which is recognized by IGF2BP2. In terms of exerting pro-angiogenic effects, TRPM2-AS loaded with exosomes transported from GBC cells to HUVECs enhanced PABPC1-mediated NUMB expression inhibition, ultimately promoting the activation of the NOTCH1 signaling pathway. PABPC1 inhibited NUMB mRNA expression through interacting with AGO2 and promoted miR-31-5p and miR-146a-5p-mediated the degradation of NUMB mRNA. The NOTCH signaling pathway inhibitor DAPT inhibited GBC tumor angiogenesis, and TRPM2-AS knockdown enhanced this effect.

Conclusions: TRPM2-AS is a novel and promising biomarker for GBC angiogenesis that promotes angiogenesis by facilitating the activation of the NOTCH1 signaling pathway. Targeting TRPM2-AS opens further opportunities for future GBC treatments.

Keywords: Angiogenesis; Exosome; Gallbladder cancer; IGF2BP2; NOTCH1; PABPC1; TRPM2-AS.


Conflict of interest statement

The authors declare no competing interests.

Figures

Fig. 1
Fig. 1
TRPM2-AS is overexpressed in GBC and is associated with high microvascular density and poor prognosis. A Schematic of CD34 immunohistochemistry and lncRNA sequencing of GBC tissues. The microvascular density of 60 GBC tissues was evaluated by CD34 immunohistochemistry and three GBC tissues with the lowest microvascular density and three with the highest microvascular density were selected for lncRNA sequencing. BC Heatmap (B) and volcano plot (C) of the differential expression of genes in three GBC tissues with high microvascular density or low microvascular density. D RT-qPCR assessment of the top ten lncRNAs with the most significant changes in RNA expression levels. E Relative expression of TRPM2-AS in GBC tissues and in adjacent normal tissues (left)/in low-density GBC tissues and in high-density GBC tissues (right) was quantified using RT-qPCR. F FISH visualization of TRPM2-AS in normal GBC tissues/low-density GBC tissues/ high-density GBC tissues. Blue fluorescence: DAPI-stained nuclei; red fluorescence: Cy3-labeled TRPM2-AS. Scale bar: 60 μm. G Representative images of the immunohistochemical staining of CD34 expression in tissues with high/low TRPM2-AS expression and Pearson’s correlation analysis of the positive correlation between microvascular density and TRPM2-AS expression. Scale bar: 100 μm. H Kaplan–Meier curve analysis of the correlation between the expression level of TRPM2-AS and overall survival (OS)/recurrence-free survival (RFS) in GBC patients. I Multivariate analysis of the prognostic factors for OS and RFS in GBC patients. J Quantification of TRPM2-AS distribution in nuclear and in cytoplasm. K Representative images of FISH analysis showing the subcellular localization of TRPM2-AS in GBC-SD and NOZ cells. Blue fluorescence: DAPI-stained nuclei; red fluorescence: Cy3-labeled U6, 18S and TRPM2-AS probes. Scale bar: 20 μm. Data were assessed with unpaired Student’s t test or one-way ANOVA and presented as mean ± SD. * P < 0.05; ** P < 0.01; *** P < 0.001
Fig. 2
Fig. 2
TRPM2-AS promotes GBC angiogenesis in vivo. A, B Representative images and quantification of surgically removed GBC tumors at day 28 in the TRPM2-AS overexpression group (A) and at day 20 in the TRPM2-AS knockdown group (B) (n = 6). CD Microvascular density of GBC tumor sections in the TRPM2-AS overexpression (C) and knockdown (D) groups was evaluated by CD34 immunohistochemical staining. Scale bar: 10/50 μm. EF Representative images of bioluminescence imaging at day 40 showing the pulmonary metastasis in the TRPM2-AS overexpression (E) and knockdown (F) groups (n = 5). GH Representative images of surgically removed lung tissues and H&E-staining showing the pulmonary metastasis in the TRPM2-AS overexpression (G) and knockdown (H) groups. Scale bar: 300 μm. IJ Representative immunohistochemical staining images and quantification of dissected lung tissues detecting the microvascular density in the TRPM2-AS overexpression (I) and knockdown (J) groups. Scale bar: 50/200 μm. Data were assessed with unpaired Student’s t test, one-way ANOVA, or two-way ANOVA and presented as mean ± SD. ** P < 0.01; *** P < 0.001
Fig. 3
Fig. 3
IGF2BP2-mediated m6A modification favors the stability of TRPM2-AS. A m6A modification sites of TRPM2-AS were predicted using SRAMP (http://www.cuilab.cn/sramp). B MeRIP and RT-qPCR assays revealing the m6A enrichment of TRPM2-AS by using three different primers. C The relative expression levels of TRPM2-AS in GBC cells were measured by RT-qPCR with/without METTL3/METTL14 overexpression. D RT-qPCR showing the decreased expression of TRPM2-AS upon treatment with 0, 50, 100, 200 μM DAA. E RIP analysis revealing the binding levels of TRPM2-AS with IGF2BP1, IGF2BP2, IGF2BP3, YTHDF1and YTHDF3. F The binding of TRPM2-AS to IGF2BP2 was identified using a dual-luciferase reporter system. G Western blot validation of IGF2BP2 protein expression levels in IGF2BP2 stable overexpression/knockdown GBC cells by lentivirus transfection. H Relative expression level of TRPM2-AS in IGF2BP2 overexpression/knockdown GBC-SD and NOZ cells after treated with actinomycin for different time point. I RT-qPCR showing the relative expression level of TRPM2-AS with IGF2BP2 overexpression/knockdown. J RIP analysis revealing the binding of TRPM2-AS and IGF2BP2 after the m6A methylation of TRPM2-AS was inhibited by DAA. K S1m pull-down assessment showing the changes in IGF2BP2 level with three different TRPM2-AS m6A site mutations. L RIP analysis verifying the enrichment of TRPM2-AS in the control group and in the IGF2BP2 overexpression group with transfection of TRPM2-AS or TRPM2-AS m6A sites mutation (Mut-1) overexpression plasmid. Data were assessed with unpaired Student’s t test or one-way ANOVA and presented as mean ± SD. * P < 0.05; ** P < 0.01; *** P < 0.001
Fig. 4
Fig. 4
Exosomes transport TRPM2-AS to HUVECs and promote tumor angiogenesis. AB EDU, transwell, and tube formation assays verifying the angiogenic ability of HUVECs cultured in Nc-CM/Ts-CM/Ts-CM + del-exo/Ts-exo (A), Nc-exo/Ts-exo/Ts-exo + sh-Ts (B). Nc-CM: conditioned medium from NOZ cells overexpressing empty plasmid. Ts-CM: conditioned medium from NOZ cells overexpressing TRPM2-AS. Ts-CM + del-exo: culture medium from NOZ cells overexpressing TRPM2-AS after exclusion of exosomes. Ts-exo: exosomes from NOZ cells overexpressing TRPM2-AS. Nc-exo: exosomes from NOZ cells overexpressing empty plasmid. Ts-exo + sh-Ts: knockdown TRPM2-AS using shRNA after HUVECs were co-cultured with Ts-exo. Red fluorescence: EDU-positive cells (EDU+). Scale bar: 200 μm (EDU/transwell/tube formation). C Representative images of the immunohistochemical staining of CD34 expression in tissues with high/low TRPM2-AS expression in serum exosomes from 32 GBC patients and Pearson’s correlation analysis of the positive correlation between microvascular density of GBC tissues and TRPM2-AS expression in serum exosomes. DE EDU, transwell, and tube formation assays verifying the angiogenic capacity of HUVECs with overexpression (D) and knockdown (E) of TRPM2-AS. F-H BALB/c nude mice were treated with Nc-exo/Ts-exo every 2 days after subcutaneous injection of 2 × 106 NOZ cells (F). Representative images of surgically resected GBC tumour. Tumor weight and volume were quantified on day 20 (G) (n = 6). Representative images showing the CD34 expression level in surgically removed GBC tumors (H). Scale bar: 10 μm. I-K BALB/c nude mice were intravenously treated with Nc-exo/Ts-exo every 5 days after intravenous injection of 2 × 106 NOZ cells (I). Representative image and H&E staining of surgically resected lung (J) (n = 5). Immunohistochemical staining showing the microvascular density of pulmonary metastatic nodules (K). Scale bar: 50/200 μm. Data were assessed with unpaired Student’s t test, one-way or two-way ANOVA and presented as mean ± SD. * P < 0.05; ** P < 0.01; *** P < 0.001; ns, no significance
Fig. 5
Fig. 5
TRPM2-AS promotes the activation of NOTCH1 signaling pathway in HUVECs. AB Transcriptomic sequencing was performed on 1 × 107 control and TRPM2-AS overexpressing HUVECs cells, and KEGG was performed to analyse the significantly altered signaling pathways. C-E Western blot validation of HEY1/HES1/N1ICD/NOTCH1 expression level in TRPM2-AS overexpressing, knockdown, and control HUVECs and immunofluorescence verification of N1ICD expression level in TRPM2-AS overexpressing, knockdown, and control HUVECs and in HUVECs cultured in Nc-exo/Ts-exo with/without knockdown of TRPM2-AS. Green fluorescence: corresponding primary antibody stained N1ICD; blue fluorescence: DAPI-stained nuclei. Scale bar: 20 μm. FG Western blot analysis showing the HEY1/HES1/N1ICD/NOTCH1 expression levels and representative immunofluorescence images of N1ICD expression in TRPM2-AS overexpressing/control HUVECs with/without DAPT treatment and in HUVECs cultured in Nc-exo/Ts-exo with/without DAPT treatment. HI EDU, transwell, and tube formation assays to detect the angiogenic ability of TRPM2-AS overexpressing/control HUVECs with/without DAPT treatment (H), and HUVECs cultured in Nc-exo/Ts-exo with/without DAPT treatment (I). Red fluorescence: EDU-positive cells (EDU+). Scale bar: 200 μm (EDU/transwell/tube formation). Data were assessed with unpaired Student’s t test or one-way ANOVA and presented as mean ± SD. * P < 0.05; ** P < 0.01; *** P < 0.001; ns, no significance
Fig. 6
Fig. 6
TRPM2-AS directly interacts with PABPC1. A FISH visualization revealing the subcellular localization of TRPM2-AS in HUVECs. Red fluorescence: Cy3-labeled TRPM2-AS; blue fluorescence: DAPI-stained nuclei. Scale bar: 20 μm. B RT-qPCR detecting the expression levels of TRPM2-AS in the cytoplasm and in nucleus respectively. CD Schematic of RNA pull-down assay using biotin-labeled TRPM2-AS. The sense and antisense chains of biotin-labeled TRPM2-AS were synthesized as probes and combined with streptavidin-labeled magnetic beads. Proteins in HUVECs were extracted and incubated with beads coupled with RNA probe (C). RNA binding proteins were collected and stained with Coomassie bright blue. Mass spectrometry analysis confirming the proteins interacting with TRPM2-AS in HUVECs (D). E The expression level of NOTCH1 signaling pathway related proteins was identified by western blot with PABPC1/HSPA2/HSPA5/HSPA9/DDX41 knockdown. F The RNA secondary structure of TRPM2-AS was predicted using ViennaRNA Web Services (http://rna.tbi.univie.ac.at/) and RNA pull-down assays was conducted to confirm the domain of TRPM2-AS that interacted with PABPC1. GH MYC-tag labeled full-length PABPC1 and its fragments I, II, III were overexpressed in HUVECs. RNA pull-down assay (G) and RIP assay (H) was used to confirm the exact fragment of PABPC1 that interacted with TRPM2-AS. Data were assessed with unpaired Student’s t test and presented as mean ± SD. ** P < 0.01
Fig. 7
Fig. 7
TRPM2-AS enhances PABPC1-mediated inhibition of NUMB expression. A The complementary pairing sequence of TRPM2-AS and NUMB mRNA 3'UTR. BC RT-qPCR (B) and western blot (C) measuring the expression level of NUMB in the control group, TRPM2-AS overexpression group, and TRPM2-AS knockdown group. DE The inhibitory effects of PABPC1 on NUMB were identified using RT-qPCR (D) and western blot (E). F RAP analysis of the relative enrichment of NUMB mRNA by biotin-labeled short DNA probe specifically complemented with TRPM2-AS with/without protease K treatment in substrate. G The direct interaction between PABPC1 and NUMB mRNA was confirmed using RIP analysis. H-J Negative control shRNA (sh-NC) and shRNA against PABPC1 (PABPC1-sh1/sh2) were transfected into HUVECs with/without TRPM2-AS overexpression. RAP followed by western blot/RT-qPCR analysis revealing the TRPM2-AS, PABPC1 protein and NUMB mRNA level pulled down by biotin-labeled short DNA probe specifically complemented with TRPM2-AS in different groups. K Western blot showing the inhibitory effects of TRPM2-AS on NUMB expression with/without PABPC1 knockdown. L-O RIP and RT-qPCR were used to quantify NUMB mRNA pulled down by PABPC1 in HUVECs with/without TRPM2-AS knockdown (LM) and overexpression (NO). P-S RT-qPCR and western blot analysis detecting the potentiating effect of TRPM2-AS on the inhibition of PABPC1 on NUMB. T Western blot showing the expression levels of NOTCH1 signaling pathway related proteins in control group cells and in PABPC1 knockdown group cells with/without TRPM2-AS overexpression/knockdown. Data were assessed with unpaired Student’s t test or one-way ANOVA and presented as mean ± SD. * P < 0.05; ** P < 0.01; *** P < 0.001; ns, no significance
Fig. 8
Fig. 8
PABPC1 suppresses NUMB expression by enhancing miRNA-mediated NUMB degradation. A Direct interaction between PABPC1 and AGO2 in HUVECs was measured by Co-IP assay. B The site of NUMB 3’UTR bound by miR-31-5p and miR-146a-5p (upper). Dual-luciferase reporter system was performed to detect the interaction of miR-31-5p and miR-146a-5p with the NUMB 3’UTR (bottom). CD Western blot (C), and RT-qPCR (D) confirming the degradation abilities of miR-31-5p and miR-146a-5p on NUMB. EH Dual-luciferase reporter system showing the inhibition degree of NUMB by miR-31-5p and miR-146a-5p in HUVECs transfected with different amounts of miR-31-5p and miR-146a-5p with PABPC1 overexpression (E) or knockdown (F)/TRPM2-AS overexpression (G) or knockdown (H). I-K RT-qPCR (I), western blot (J), and immunofluorescence (K) measuring the activation of the NOTCH1 signaling pathway in the control group and in the PABPC1 overexpression group with/without miR-31-5p/miR-146a-5p treatment. Green fluorescence: corresponding primary antibody stained N1ICD; blue fluorescence: DAPI-stained nuclei. Scale bar: 20 μm. L-N RT-qPCR (L), western blot (M), and immunofluorescence (N) measuring the activation of the NOTCH1 signaling pathway in the control group and in the PABPC1 overexpression group with/without AGO2 knockdown. Data were assessed with unpaired Student’s t test or one-way ANOVA and presented as mean ± SD. * P < 0.05; ** P < 0.01; *** P < 0.001
Fig. 9
Fig. 9
TRPM2-AS knockdown enhances the suppressive effects of DAPT on GBC tumors. A 2 × 106 NOZ cells with/without TRPM2-AS knockdown were injected subcutaneously into nude mice. When tumor volume increased to 50–80 mm3, normal saline (NS) or DAPT (20 mg/kg) were injected intraperitoneally once every 2 days. Then the nude mice were euthanized, and the tumors were resected after 16 days. B-D Representative images and quantification of surgically removed GBC tumors in the control group and in the TRPM2-AS knockdown group with/without DAPT treatment (n = 5). E Immunohistochemical staining of microvascular density in disserted GBC tumors. Scale bar: 10/50 μm. F The lung metastasis model was constructed by injecting of 2 × 106 control or TRPM2-AS knockdown NOZ cells intravenously, and the nude mice were euthanized, and the lung tissues were resected after 40 days by injection of saline or DAPT (20 mg/kg) once every 5 days. G Representative images of surgically removed lung tissues and H&E staining revealing lung metastasis in the control group and in the TRPM2-AS knockdown group with/without DAPT treatment. Scale bar: 300 μm (n = 5). H Immunohistochemical staining for detection of the microvascular density in disserted lung tissues. Scale bar: 50/200 μm. Data were assessed with one-way ANOVA or two-way ANOVA and presented as mean ± SD. * P < 0.05; ** P < 0.01; *** P < 0.001
Fig. 10
Fig. 10
Schematic of the role of the IGF2BP2-TRPM2-AS/PABPC1-NUMB-NOTCH1 axis in GBC angiogenesis. In GBC cells, IGF2BP2 increases the stability of TRPM2-AS in an m6A-dependent manner, and overexpressed TRPM2-AS in tumors can be transferred to endothelial cells via exosomes and promote endothelial cells angiogenesis by activating the NOTCH1 signaling pathway. Mechanistically, TRPM2-AS promotes the degradation of NUMB mRNA by enhancing the interaction of PABPC1 with NUMB mRNA. Further studies have shown that PABPC1 interacts with AGO2 and then inhibits the expression of NUMB by promoting miR-31-5p and miR-146a-5p-mediated NUMB degradation

References

    1. Vuthaluru S, Sharma P, Chowdhury S, Are C. Global epidemiological trends and variations in the burden of gallbladder cancer. J Surg Oncol. 2023;128(6):980–988. doi: 10.1002/jso.27450. - DOI - PubMed
    1. Shen H, He M, Lin R, Zhan M, Xu S, Huang X, et al. PLEK2 promotes gallbladder cancer invasion and metastasis through EGFR/CCL2 pathway. J Exp Clin Cancer Res. 2019;38(1):247. doi: 10.1186/s13046-019-1250-8. - DOI - PMC - PubMed
    1. Okumura T, Nakamura J, Kai K, Ide Y, Nakamura H, Koga H, et al. Curative resection of gallbladder cancer with liver invasion and hepatic metastasis after chemotherapy with gemcitabine plus S-1: report of a case. World J Surg Oncol. 2014;12:326. doi: 10.1186/1477-7819-12-326. - DOI - PMC - PubMed
    1. Qi S, Deng S, Lian Z, Yu K. Novel drugs with high efficacy against tumor angiogenesis. Int J Mol Sci. 2022;23(13):6934. doi: 10.3390/ijms23136934. - DOI - PMC - PubMed
    1. Reymond N, d’Água BB, Ridley AJ. Crossing the endothelial barrier during metastasis. Nat Rev Cancer. 2013;13(12):858–870. doi: 10.1038/nrc3628. - DOI - PubMed

Publication types