. 2024 Mar 27;21(1):29.
doi: 10.1186/s12987-024-00531-x.

Cognitive decline, Aβ pathology, and blood-brain barrier function in aged 5xFAD mice

Affiliations

Cognitive decline, Aβ pathology, and blood-brain barrier function in aged 5xFAD mice

Geetika Nehra et al. Fluids Barriers CNS. .

Abstract

Background: Patients with Alzheimer's disease (AD) develop blood-brain barrier dysfunction to varying degrees. How aging impacts Aβ pathology, blood-brain barrier function, and cognitive decline in AD remains largely unknown. In this study, we used 5xFAD mice to investigate changes in Aβ levels, barrier function, and cognitive decline over time.

Methods: 5xFAD and wild-type (WT) mice were aged between 9.5 and 15.5 months and tested for spatial learning and reference memory with the Morris Water Maze (MWM). After behavior testing, mice were implanted with acute cranial windows and intravenously injected with fluorescent-labeled dextrans to assess their in vivo distribution in the brain by two-photon microscopy. Images were processed and segmented to obtain intravascular intensity, extravascular intensity, and vessel diameters as a measure of barrier integrity. Mice were sacrificed after in vivo imaging to isolate brain and plasma for measuring Aβ levels. The effect of age and genotype were evaluated for each assay using generalized or cumulative-linked logistic mixed-level modeling and model selection by Akaike Information Criterion (AICc). Pairwise comparisons were used to identify outcome differences between the two groups.

Results: 5xFAD mice displayed spatial memory deficits compared to age-matched WT mice in the MWM assay, which worsened with age. Memory impairment was evident in 5xFAD mice by 2-threefold higher escape latencies, twofold greater cumulative distances until they reach the platform, and twice as frequent use of repetitive search strategies in the pool when compared with age-matched WT mice. Presence of the rd1 allele worsened MWM performance in 5xFAD mice at all ages but did not alter the rate of learning or probe trial outcomes. 9.5-month-old 15.5-month-old 5xFAD mice had twofold higher brain Aβ40 and Aβ42 levels (p < 0.001) and 2.5-fold higher (p = 0.007) plasma Aβ40 levels compared to 9.5-month-old 5xFAD mice. Image analysis showed that vessel diameters and intra- and extravascular dextran intensities were not significantly different in 9.5- and 15.5-month-old 5xFAD mice compared to age-matched WT mice.

Conclusion: 5xFAD mice continue to develop spatial memory deficits and increased Aβ brain levels while aging. Given in vivo MP imaging limitations, further investigation with smaller molecular weight markers combined with advanced imaging techniques would be needed to reliably assess subtle differences in barrier integrity in aged mice.

Keywords: Pde6b rd1; 5xFAD; Aβ; Blood–Brain Barrier.


Conflict of interest statement

The authors declare that they have no competing interests.

Figures

Fig. 1
Fig. 1
Learning and Spatial Memory Impairments in Aged 5xFAD and WT mice. A Schematic diagram for MWM cued learning phase, spatial acquisition phase, and MWM probe trials. B Pictures of mice searching the platform during the cued learning phase, spatial acquisition phase, and probe trial. Insert shows a mouse on the platform marked with a pole at the end of a trial. C Censored mean escape latency (s) for 9.5-month-old WTrd1/wt mice (dark blue circles), 9.5-month-old WTwt/wt mice (light blue circles), 9.5-month-old 5xFADrd1/wt mice (magenta circles), and 9.5-month-old wt//wt mice (red circles). D) Censored mean escape latency (s) for 15.5-month-old WTrd1/wt mice (dark blue circles), 15.5-month-old WTwt/wt mice (light blue circles), 15.5-month-old 5xFADrd1/wt mice (magenta circles), and 15.5-month-old wt//wt mice (red circles)
Fig. 2
Fig. 2
Failed trials in MWM testing and Accelerated Failure Time Modeling. A Percentage of failed trials by 9.5-month-old WTrd1/wt mice (dark blue circles), 9.5-month-old WTwt/wt mice (light blue circles), 9.5-month-old 5xFADrd1/wt mice (magenta circles), and 9.5-month-oldwt//wt mice (red circles). B Percentage of failed trials by 15.5-month-old WTrd1/wt mice (dark blue circles), 15.5-month-old WTwt/wt mice (light blue circles), 15.5-month-old 5xFADrd1/wt mice (magenta circles), and 15.5-month-oldwt//wt mice (red circles). C Modeled escape latencies for 9.5-month-old WTrd1/wt mice (dark blue line), 9.5-month-old WTwt/wt mice (light blue line), 9.5-month-old 5xFADrd1/wt mice (magenta line), and 9.5-month-old wt//wt mice (red line). D) Modeled escape latencies for 15.5-month-old WTrd1/wt mice (dark blue line), 15.5-month-old WTwt/wt mice (light blue line), 15.5-month-old 5xFADrd1/wt mice (magenta line), and 15.5-month-old wt//wt mice (red line). Modeled data is presented as model (solid line) ± 95% prediction intervals (shades). Modeled latencies increased with age and genotype and resulted in an extrapolated estimate for latencies in failed trials
Fig. 3
Fig. 3
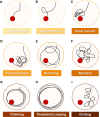
Search Strategy Assessment in MWM Testing. Search strategies were assigned to trials as described herein. A Spatial direct strategies imply that mice found the platform directly. B Spatial indirect strategies imply that mice find the platform within one loop. C Focal correct strategies involve a focused search adjacent to the platform. D An incorrect focal strategy implies a focused search in a small portion of the pool that does not contain the platform. E Scanning implies a platform search across the pool. F Random strategies imply a non-focused search in the entire pool. G Chaining involves a repetitive platform search inside the thigmotaxis zone, i.e., 15 cm from the rim of the pool. H Peripheral looping involves a platform search within the thigmotaxis zone. I Circling strategies involve movements in tight circles with directionality
Fig. 4
Fig. 4
Search Strategy Selection of 5xFAD and WT mice. Search strategy preferences for A 9.5-month-old WT mice, B 9.5-month-old 5xFAD mice, C 15.5-month-old WT mice, and D 15.5-month-old 5xFAD mice. Data is presented as cumulative trials (% frequencies). Color legend for each strategy is presented at the top. Slopes for inter-strategy interfaces are indicated as mean ± standard errors of the mean (SEM) adjacent to each plot. For any given strategy, inter-strategy slopes were highest for 9.5-month-old WT mice, followed by 9.5-month-old 5xFAD mice, 15.5-month-old WT mice, and 15.5-month-old 5xFAD mice. E Histograms represent modeled escape latencies across search strategies mice adopt in the cued learning phase. F Histograms represent modeled escape latencies across mouse search strategies in the spatial acquisition phase. All strategies have similar escape latencies in 9.5-month-old mice. In contrast, shorter escape latencies were associated with structured strategies in 15.5-month-old mice. Rd1 mutation did not have an impact on search strategy preferences
Fig. 5
Fig. 5
Moderated Mediation Analysis. A In 9.5-month-old 5xFADwt/wt and WTwt/wt mice, strategy preferences contributed more to escape latencies than the genotype of the mouse model, but the effects of strategy and genotype were not significant. B In 9.5-month-old 5xFADrd1/wt and WTrd1/wt mice, genotype contributed more to escape latencies than strategy preferences. C In 15.5-month-old 5xFADwt/wt and WTwt/wt mice, genotype influenced escape latencies, but strategy preference did not. D In 15.5-month-old 5xFADrd1/wt and WTrd1/wt mice, both genotype and strategy preference influenced escape latencies
Fig. 6
Fig. 6
Probe Trial Metrics in MWM test. A Percent time in the target quadrant (Q) for 9.5-month-old 5xFAD mice (red hollow columns), 9.5-month-old WT mice (blue hollow columns), 15.5-month-old 5xFAD mice (red filled columns), and 15.5-month-old WT mice (blue filled columns) during the probe trial duration (60 s). Time in the target quadrant decreased with age. No differences in Q values were noted between 5xFAD and age-matched WT mice. B Q values during the first 15 s of the probe trial. Q values in the first 15 s of the trial showed higher resolution when compared with Q values at the end of the trial (60 s). p values estimated on model log scales. *p = 0.05, #p = 0.029, ***p = 0.003. C Percentage of trials with zero time in target quadrant for all groups during the probe trial duration (60 s). D Percentage of trials with zero time in target quadrant for all groups in the first 15 s of the trial. E Normalized distance to platform (P, m/s) during probe trials. P values were similar for all groups in all probe trials. F Normalized distance to platform during the first 15 s probe trial. P values for 5xFAD mice were higher than P values for age-matched WT mice, but no differences were noted between age-matched 5xFAD and WT mice. p values estimated on model log scales. *p = 0.039, **p = 0.003, ***p < 0.001, #p = 0.001
Fig. 7
Fig. 7
Plasma and Brain Aβ levels in 5xFAD Mice. A Median plasma Aβ40 levels (ng/dL) were significantly higher for 15.5-month-old 5xFAD mice (red filled column) than 9.5-month-old 5xFAD mice (red hollow column). B Median plasma Aβ42 levels (ng/dL) were similar for 9.5-month-old 5xFAD mice (red hollow column) and 15.5-month-old 5xFAD mice (red filled column). Error bars in A and B show the interquartile range. Dashed lines indicated lower limits of quantitation. C Mean brain Aβ40 levels (ng/mg brain weight) were significantly higher for 16-month-old 5xFAD mice (red filled column) than 9.5-month-old 5xFAD mice (red hollow column). D Mean brain Aβ42 levels (ng/mg brain weight) in 9.5-month-old 5xFAD mice (red hollow column) and 15.5-month-old 5xFAD mice (red filled column). No significant differences were noted between the two groups. Red hollow circles represent individual data points. The dotted lines in A and B show the lower limit of quantitation (LLOQ) for Aβ. Error bars in A and B show the interquartile range, and errors in C and D show the standard error of the mean (SEM)
Fig. 8
Fig. 8
In vivo Two-Photon Microscopy Imaging of 5xFAD and WT mice. A Schematic graphic showing an overview of the in vivo imaging setup. B Image showing a mouse head with an acutely installed cranial window. C Image of an anesthetized mouse secured on the microscopy board for in vivo microscopy. D MIP image of cortical vessels infused with FITC-70 kDa dextran (green). E MIP of cortical vessels infused with TR-3 kDa dextran (red). F Segmented image obtained from the Zen Intellesis module that shows intravascular (orange) and extravascular (cyan) regions
Fig. 9
Fig. 9
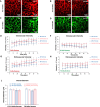
Distribution of fluorescent-labeled dextrans in 5xFAD and WT Mice. AD Representative MIP images from age-matched 5xFAD and WT mice for each dextran. E Intravascular sum intensity of FITC-70 kDa dextran MIP images over 70 min of in vivo imaging. F Extravascular sum intensity for FITC-70 kDa dextran MIP images. G Intravascular sum intensity of 3 kDa dextran MIP images. H Extravascular sum intensity of 3 kDa dextran. I Vessel diameters were measured from in vivo MIP images with FITC-70 kDa dextran and TR-3 kDa dextran labeled vessels. Legend: 9.5-month-old WT mice (blue hollow column), 9.5-month-old 5xFAD mice (red hollow column), 15.5-month-old WT mice (blue filled column), and 15.5-month-old 5xFAD mice (red filled column). Sample sizes for TR-3 kDa dextran-labeled vessels: 9.5-month-old WT mice (n = 9), 9.5-month-old 5xFAD mice (n = 11), 15.5-month-old WT mice (n = 12), 15.5-month-old 5xFAD mice (n = 11). Sample sizes for FITC-70 kDa dextran-labeled vessels: 9.5-month-old WT mice (n = 8), 9.5-month-old 5xFAD mice (n = 11), 15.5-month-old WT mice (n = 11), 15.5-month-old 5xFAD mice (n = 11). Error bars indicate standard errors of the mean (SEM) for each measurement

Similar articles

Cited by

References

    1. Association A. 2023 Alzheimer’s disease facts and figures. Alzheimers Dement. 2023;19:1598–1695. doi: 10.1002/alz.13016. - DOI - PubMed
    1. Cummings J, Lee G, Nahed P, Kambar M, Zhong K, Fonseca J, et al. Alzheimer's disease drug development pipeline: 2022. Alzheimers Dement. 2022;8(1):e12295. doi: 10.1002/trc2.12295. - DOI - PMC - PubMed
    1. Hampel H, Cummings J, Blennow K, Gao P, Jack CR, Jr, Vergallo A. Developing the ATX(N) classification for use across the Alzheimer disease continuum. Nat Rev Neurol. 2021;17(9):580–589. doi: 10.1038/s41582-021-00520-w. - DOI - PubMed
    1. Cummings J, Feldman HH, Scheltens P. The, “rights” of precision drug development for Alzheimer's disease. Alzheimers Res Ther. 2019;11(1):76. doi: 10.1186/s13195-019-0529-5. - DOI - PMC - PubMed
    1. Musaeus CS, Gleerup HS, Hasselbalch SG, Waldemar G, Simonsen AH. Progression of blood-brain barrier leakage in patients with Alzheimer's disease as measured with the cerebrospinal fluid/plasma albumin ratio over time. J Alzheimers Dis Rep. 2023;7(1):535–541. doi: 10.3233/ADR-230016. - DOI - PMC - PubMed

Substances