. 2024 Mar 26;12(1):47.
doi: 10.1186/s40478-024-01757-4.

MRC1 and LYVE1 expressing macrophages in vascular beds of GNAQ p.R183Q driven capillary malformations in Sturge Weber syndrome

Affiliations

MRC1 and LYVE1 expressing macrophages in vascular beds of GNAQ p.R183Q driven capillary malformations in Sturge Weber syndrome

Sana Nasim et al. Acta Neuropathol Commun. .

Abstract

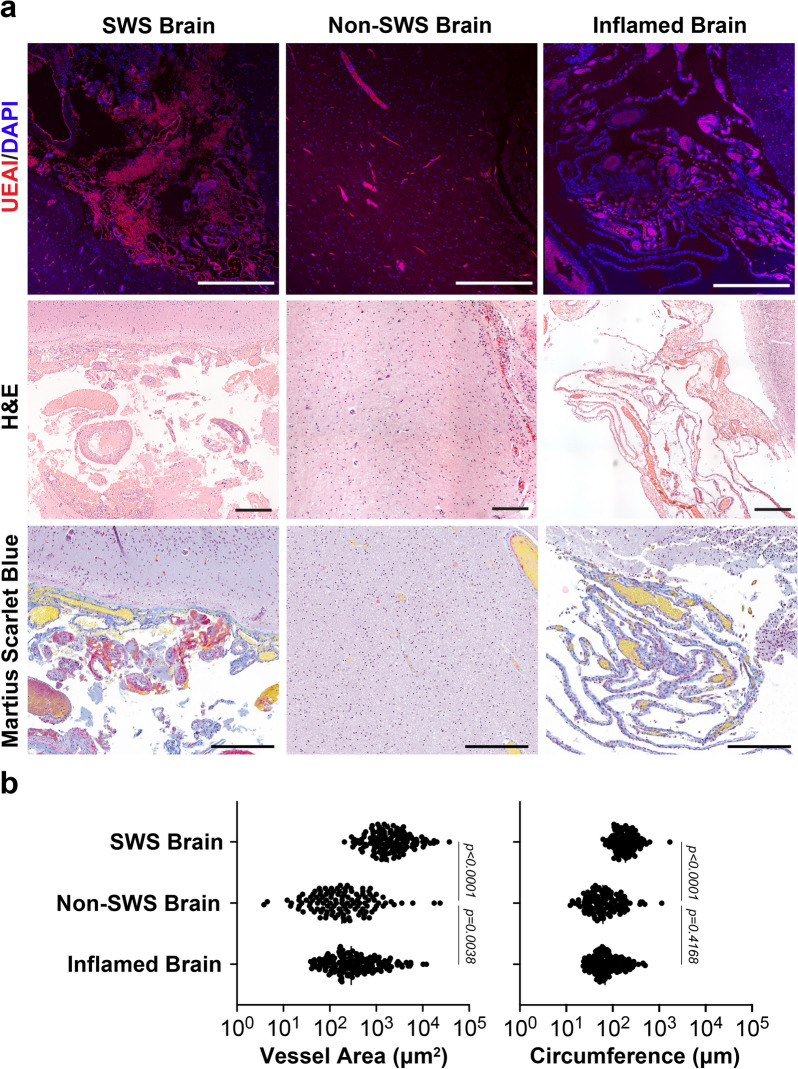
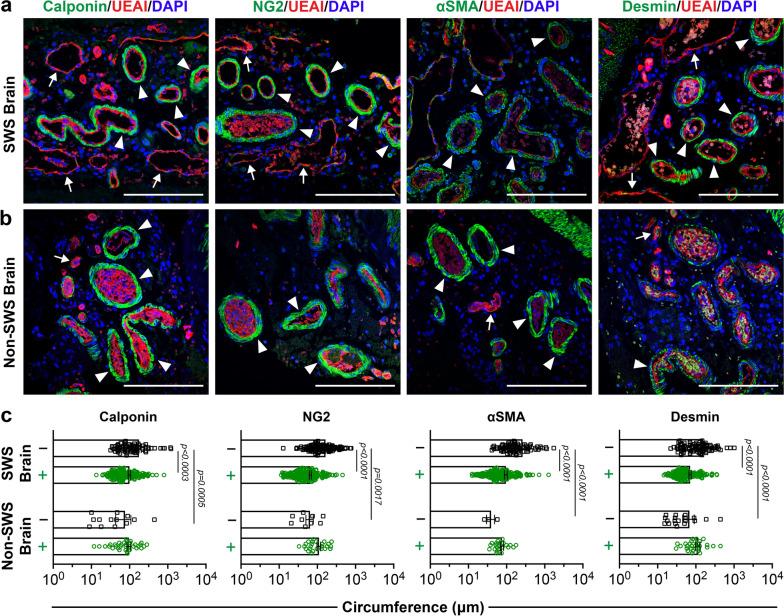
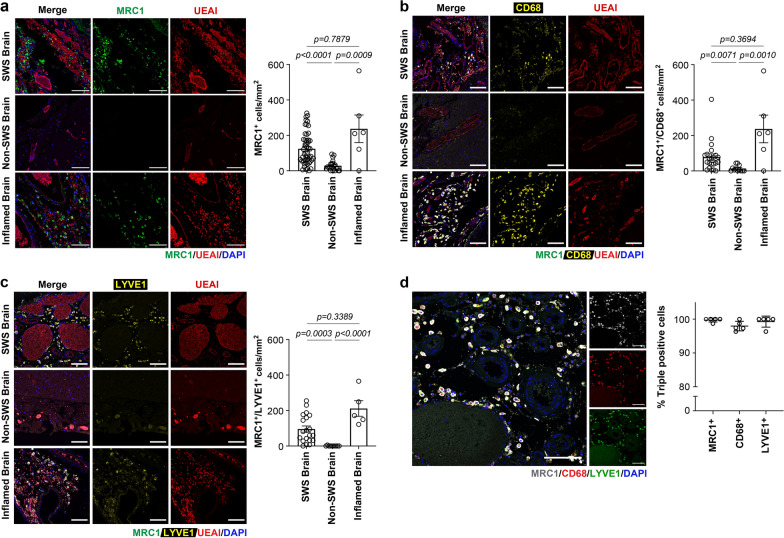
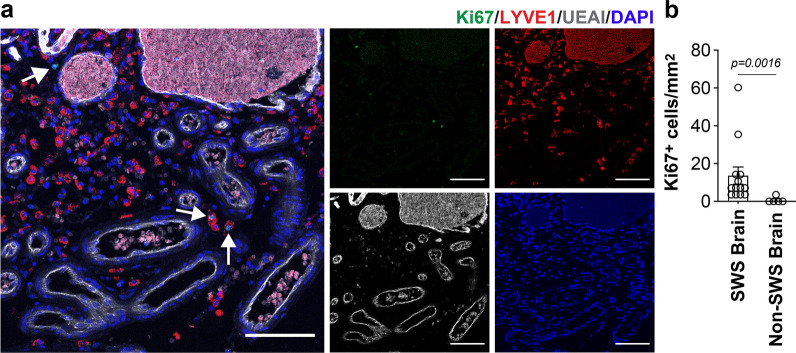
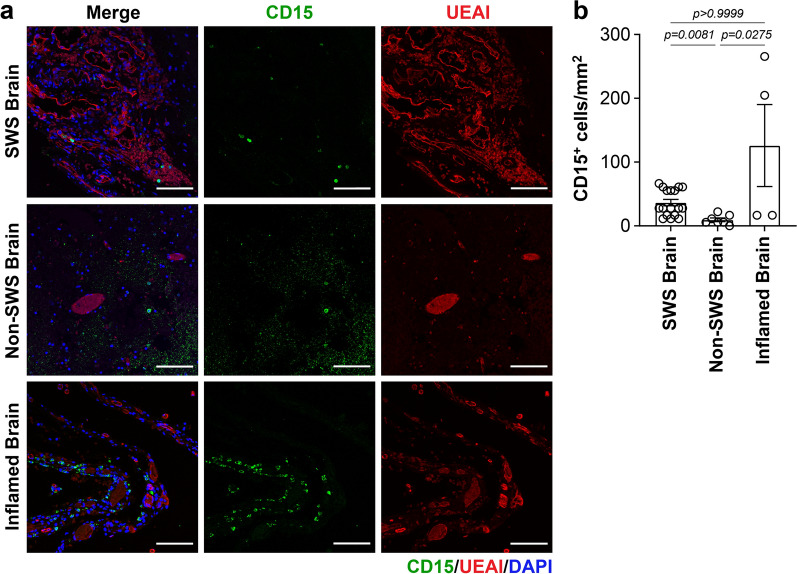
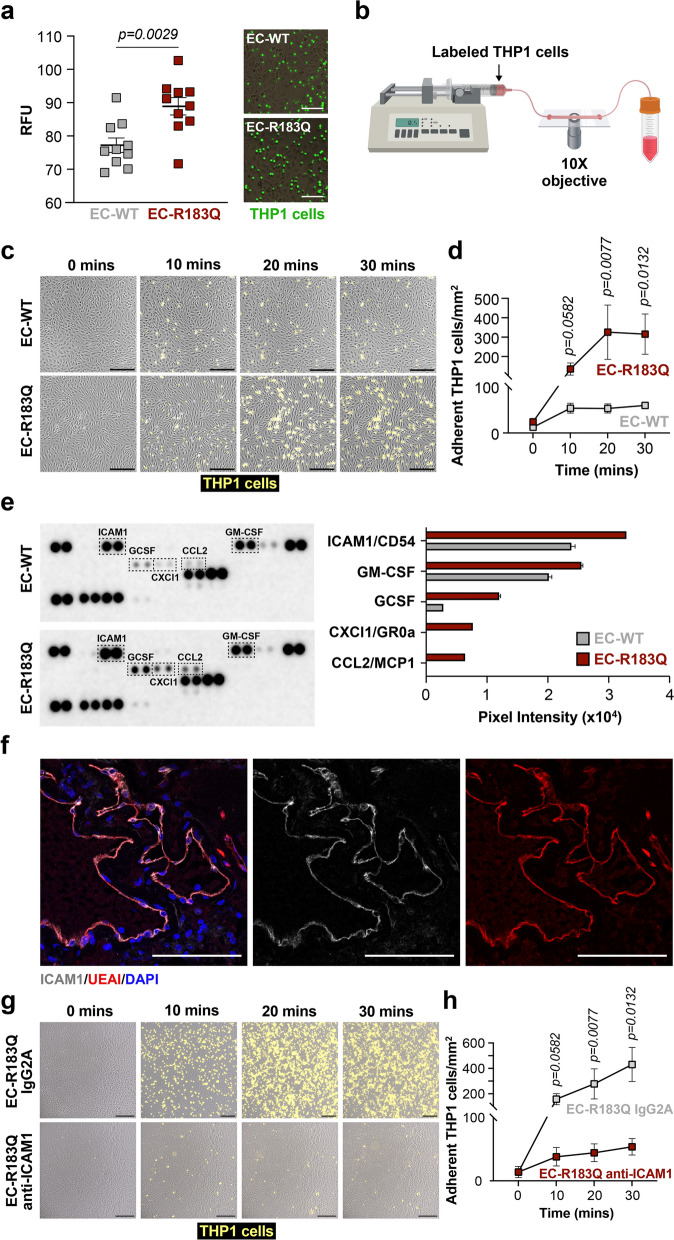
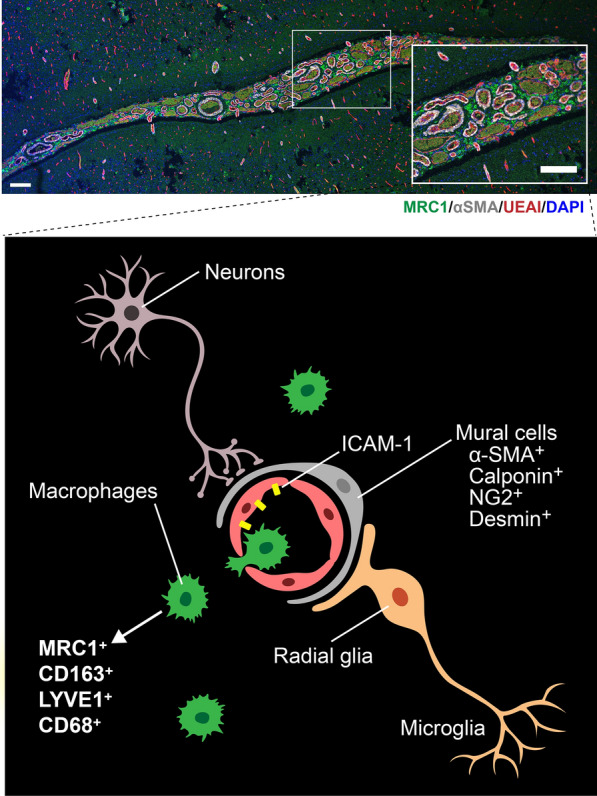
Sturge-Weber syndrome (SWS), a neurocutaneous disorder, is characterized by capillary malformations (CM) in the skin, brain, and eyes. Patients may suffer from seizures, strokes, and glaucoma, and only symptomatic treatment is available. CM are comprised of enlarged vessels with endothelial cells (ECs) and disorganized mural cells. Our recent finding indicated that the R183Q mutation in ECs leads to heightened signaling through phospholipase Cβ3 and protein kinase C, leading to increased angiopoietin-2 (ANGPT2). Furthermore, knockdown of ANGPT2, a crucial mediator of pro-angiogenic signaling, inflammation, and vascular remodeling, in EC-R183Q rescued the enlarged vessel phenotype in vivo. This prompted us to look closer at the microenvironment in CM-affected vascular beds. We analyzed multiple brain histological sections from patients with GNAQ-R183Q CM and found enlarged vessels devoid of mural cells along with increased macrophage-like cells co-expressing MRC1 (CD206, a mannose receptor), CD163 (a scavenger receptor and marker of the monocyte/macrophage lineage), CD68 (a pan macrophage marker), and LYVE1 (a lymphatic marker expressed by some macrophages). These macrophages were not found in non-SWS control brain sections. To investigate the mechanism of increased macrophages in the perivascular environment, we examined THP1 (monocytic/macrophage cell line) cell adhesion to EC-R183Q versus EC-WT under static and laminar flow conditions. First, we observed increased THP1 cell adhesion to EC-R183Q compared to EC-WT under static conditions. Next, using live cell imaging, we found THP1 cell adhesion to EC-R183Q was dramatically increased under laminar flow conditions and could be inhibited by anti-ICAM1. ICAM1, an endothelial cell adhesion molecule required for leukocyte adhesion, was strongly expressed in the endothelium in SWS brain histological sections, suggesting a mechanism for recruitment of macrophages. In conclusion, our findings demonstrate that macrophages are an important component of the perivascular environment in CM suggesting they may contribute to the CM formation and SWS disease progression.

Keywords: GNAQ; Capillary malformation; ICAM1; Leukocyte adhesion; Macrophages; Sturge Weber syndrome; Vascular malformation.


Conflict of interest statement

The authors declare that they have no competing interests.

Figures

Fig. 1
Fig. 1
Characterization of blood vessels in the Sturge-Weber brain. a Endothelial staining with Ulex europaeus agglutinin-I (UEAI, red) and nuclei counterstaining with DAPI (blue) (top), scale bar = 500 µm; Hematoxylin and Eosin (H&E) (middle), scale bar = 50 mm; and Martius Scarlet Blue (bottom) staining, scale bar = 500 µm, fibrin (red), collagen (blue), erythrocytes (yellow), and nuclei (blue/black) in SWS brain, non-SWS brain, and inflamed brain. b Quantification of the vessel area (µm2) and circumference (µm) in the SWS brain (n = 4), non-SWS brain (n = 2) and inflamed brain (n = 1) specimens. The p-values were calculated by One-way ANOVA followed by Dunn’s multiple comparison test
Fig. 2
Fig. 2
Characterization of mural cells in brain specimens. Antibody staining for calponin, neuron-glia antigen 2 (NG2), alpha smooth muscle actin (αSMA), desmin (green), UEAI (red), and nuclei staining with DAPI (blue) in a SWS brain and b non-SWS brain. Scale bar = 50 µm. White arrows point at vessels without mural cells, whereas arrowheads point to vessels with mural cell coverage. c Quantification of vessel circumference (µm) in SWS brain (n = 4) and non-SWS brain (n = 2). ‘+’ (green) indicates the vessels surrounded by mural cells, and ‘−’ (black) indicates the vessels that lack mural cell coverage. The p-values were calculated by a two-tailed, non-parametric Mann–Whitney test
Fig. 3
Fig. 3
Macrophages in the perivascular space of Sturge-Weber brain. a Staining for MRC1 (green), UEAI (endothelium, red) and counterstaining for DAPI (blue) in SWS brain sections (top), non-SWS brain sections (middle), and inflamed brain sections (bottom). Quantification of MRC1+ cells (right). b Co-staining for CD68 (yellow), MRC1 (grey), UEAI (red) and counterstaining for DAPI (blue) in the SWS brain (top), non-SWS brain (middle), and inflamed brain (bottom). Quantification of co-labeled MRC1+ and CD68+ cells (right) c Co-staining of lymphatic vessel endothelial hyaluronan receptor 1 (LYVE1, yellow), MRC1 (grey), UEAI (red) and counterstaining for DAPI (blue) in the SWS brain (top), non-SWS brain (middle), and inflamed brain (bottom). Quantification of co-labeled MRC1+ and LYVE1+ cells (right). The p-values were calculated by One-way ANOVA test with Dunn’s multiple comparison test. d Triple staining of MRC1+, CD68+, and LYVE1+ in the SWS brain. Quantification (right) shows more than 95% of cells are triple positive for MRC1, CD68, and LYVE1. See Table 1 for information on brain specimens. SWS brain (n = 4), non-SWS brain (n = 2) and inflamed brain (n = 1) specimens. All scale bars are 50 µm
Fig. 4
Fig. 4
Some LYVE1+ cells in Sturge Weber brain are Ki67+. a Ki67 (green), LYVE1 (red), UEAI (grey) and counterstaining for DAPI (blue). The white arrows point to Ki67+ and LYVE1+ cells. Separate channels for each marker: Ki67 (top left), LYVE1 (top right), UEAI (bottom left) and DAPI (bottom right). Scale bar = 50 µm. b Quantification of Ki67+ cells in SWS brain (n = 4) and non-SWS brain (n = 2) specimens. P-value was calculated by two-tailed t-test
Fig. 5
Fig. 5
CD15+ neutrophils in the Sturge-Weber brain. a CD15 (green), UEAI (red) and counterstaining for DAPI (blue) in SWS brain (top), non-SWS brain (middle), and inflamed brain (bottom). Scale bar = 50 µm. b Quantification of CD15+ cells (right) in the SWS brain (n = 4), non-SWS brain (n = 2) and inflamed brain (n = 1) specimens. The p-values were calculated by One-way ANOVA test with Dunn’s multiple comparison test
Fig. 6
Fig. 6
EC-R183Q promote significant THP1 cell adhesion under static and laminar flow-induced condition. a Fluorescence-labeled THP1 cells were incubated with EC-WT and EC-R183Q under static conditions (N = 10). Adherent cells were quantified after 1 h. P-value was calculated by two-tailed t-test. Phase-contrast images of EC-WT (top) or EC-R183Q (bottom) incubated with THP1 cells (green) at 1 h incubation. Scale bar = 50 µm. b Schematic of live-cell imaging set up. A flow rate of 0.5 ml/min was setup using a tabletop syringe pump with a 20 ml syringe Luer-Lock tip. After 5 min of recording, a switch system was used to deliver pre-stained THP1 cells under continuous uninterrupted flow for 30 min. c Time-lapse imaging of THP1 cells (yellow) adhesion to EC-WT (top), and EC-R183Q (bottom) under laminar flow. Images are at time point = 0, 10, 20, and 30 min. Scale bar = 200 µm. N = 6 independent experiments were performed. d Quantification of THP1 cell adhesion under flow over 10, 20, and 30 min. Mann Whitney test was performed to calculate p-value at each time point. e Proteome profiler cytokine array on conditioned media from EC-WT (top) and EC-R183Q (bottom) after incubation in 2% fetal bovine serum EBM2 media for 24 h. Altered protein levels between EC-WT and EC-R183Q are boxed. Protein levels were quantified by measuring dot intensity using FIJI (right). Three independent experiments were performed. f Intercellular adhesion molecule 1 (ICAM1, grey), UEAI (red), and nuclei counterstaining for DAPI (blue) in the SWS brain sections (n = 4). Scale bar = 50 µm. g Time-lapse imaging of THP1 cell (yellow) adhesion to EC-R183Q treated with IgG2A isotype control (top), and EC-R183Q treated with anti-ICAM1 antibody (bottom) under laminar flow. Images are at time point = 0, 10, 20, and 30 min. Scale bar = 200 µm. N = 5 independent experiments were performed. h Quantification of single cell tracking of THP1 cells under flow over 10, 20, and 30 min. Mann Whitney test was performed to calculate p-value at each time point
Fig. 7
Fig. 7
Sturge-Weber brain microenvironment. Tiling image (top) of Sturge-Weber brain leptomeninges labeled for MRC1 (green), αSMA (grey), UEAI (red) and nuclei counterstaining for DAPI (blue). Zoom insert shows vessels with and without αSMA layer surrounded by MRC1+ cells in the perivascular space. Scale bar = 200 µm. The illustration (bottom) shows mural cells (αSMA, calponin, NG2 and desmin) around the endothelial cells. MRC1, CD163, LYVE1, and CD68 macrophages in the perivascular space along with the neurons and microglia cells

References

    1. Albarran-Juarez J, Iring A, Wang S, Joseph S, Grimm M, Strilic B, Wettschureck N, Althoff TF, Offermanns S. Piezo1 and G(q)/G(11) promote endothelial inflammation depending on flow pattern and integrin activation. J Exp Med. 2018;215:2655–2672. doi: 10.1084/jem.20180483. - DOI - PMC - PubMed
    1. Bichsel CA, Goss J, Alomari M, Alexandrescu S, Robb R, Smith LE, Hochman M, Greene AK, Bischoff J. Association of somatic GNAQ mutation with capillary malformations in a case of choroidal hemangioma. JAMA Ophthalmol. 2019;137:91–95. doi: 10.1001/jamaophthalmol.2018.5141. - DOI - PMC - PubMed
    1. Brezovakova V, Jadhav S. Identification of Lyve-1 positive macrophages as resident cells in meninges of rats. J Comp Neurol. 2020;528:2021–2032. doi: 10.1002/cne.24870. - DOI - PubMed
    1. Cho CH, Koh YJ, Han J, Sung HK, Jong Lee H, Morisada T, Schwendener RA, Brekken RA, Kang G, Oike Y, et al. Angiogenic role of LYVE-1-positive macrophages in adipose tissue. Circ Res. 2007;100:e47–57. doi: 10.1161/01.RES.0000259564.92792.93. - DOI - PubMed
    1. Clear AJ, Lee AM, Calaminici M, Ramsay AG, Morris KJ, Hallam S, Kelly G, Macdougall F, Lister TA, Gribben JG. Increased angiogenic sprouting in poor prognosis FL is associated with elevated numbers of CD163+ macrophages within the immediate sprouting microenvironment. Blood. 2010;115:5053–5056. doi: 10.1182/blood-2009-11-253260. - DOI - PMC - PubMed

Publication types

MeSH terms

Substances

Supplementary concepts