

Chemical Fingerprinting of Biomass Burning Organic Aerosols from Sugar Cane Combustion: Complementary Findings from Field and Laboratory Studies
- PMID: 38533192
- PMCID: PMC10961841
- DOI: 10.1021/acsearthspacechem.3c00301
Chemical Fingerprinting of Biomass Burning Organic Aerosols from Sugar Cane Combustion: Complementary Findings from Field and Laboratory Studies
Abstract
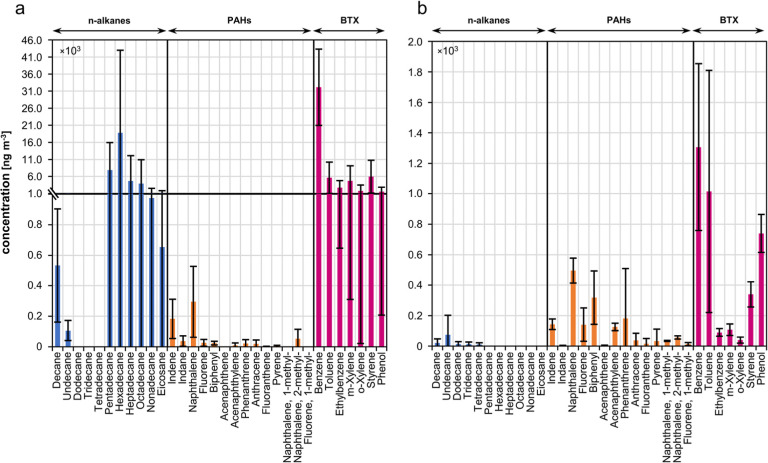
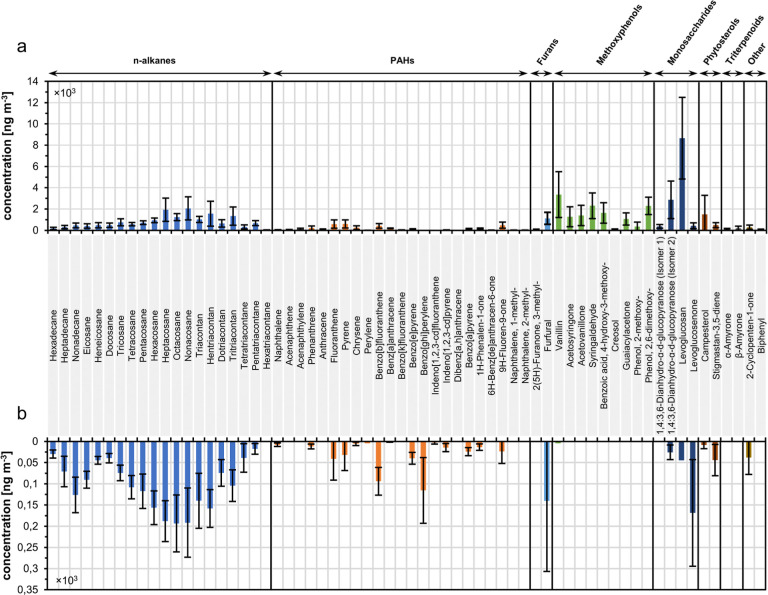
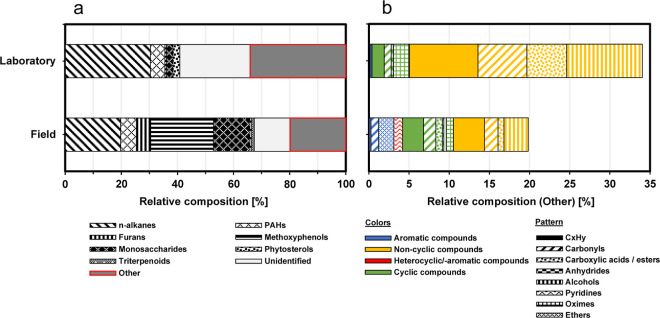
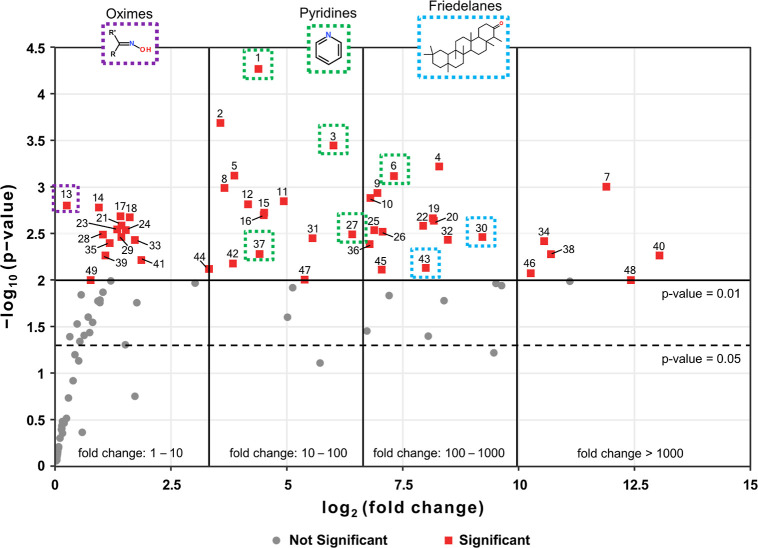
Agricultural fires are a major source of biomass-burning organic aerosols (BBOAs) with impacts on health, the environment, and climate. In this study, globally relevant BBOA emissions from the combustion of sugar cane in both field and laboratory experiments were analyzed using comprehensive two-dimensional gas chromatography time-of-flight mass spectrometry. The derived chemical fingerprints of fresh emissions were evaluated using targeted and nontargeted evaluation approaches. The open-field sugar cane burning experiments revealed the high chemical complexity of combustion emissions, including compounds derived from the pyrolysis of (hemi)cellulose, lignin, and further biomass, such as pyridine and oxime derivatives, methoxyphenols, and methoxybenzenes, as well as triterpenoids. In comparison, laboratory experiments could only partially model the complexity of real combustion events. Our results showed high variability between the conducted field and laboratory experiments, which we, among others, discuss in terms of differences in combustion conditions, fuel composition, and atmospheric processing. We conclude that both field and laboratory studies have their merits and should be applied complementarily. While field studies under real-world conditions are essential to assess the general impact on air quality, climate, and environment, laboratory studies are better suited to investigate specific emissions of different biomass types under controlled conditions.
© 2024 The Authors. Published by American Chemical Society.
Conflict of interest statement
The authors declare no competing financial interest.
Figures
References
-
- Brandt C. S. Agricultural Burning. J. Air Pollut. Control Assoc. 1966, 16 (2), 85–86. 10.1080/00022470.1966.10468447. - DOI
-
- Bond T. C.; Doherty S. J.; Fahey D. W.; Forster P. M.; Berntsen T.; DeAngelo B. J.; Flanner M. G.; Ghan S.; Kärcher B.; Koch D.; Kinne S.; Kondo Y.; Quinn P. K.; Sarofim M. C.; Schultz M. G.; Schulz M.; Venkataraman C.; Zhang H.; Zhang S.; Bellouin N.; Guttikunda S. K.; Hopke P. K.; Jacobson M. Z.; Kaiser J. W.; Klimont Z.; Lohmann U.; Schwarz J. P.; Shindell D.; Storelvmo T.; Warren S. G.; Zender C. S. Bounding the role of black carbon in the climate system: A scientific assessment. J. Geophys. Res.: Atmos. 2013, 118 (11), 5380–5552. 10.1002/jgrd.50171. - DOI
-
- Li J.; Wang G.; Zhang Q.; Li J.; Wu C.; Jiang W.; Zhu T.; Zeng L. Molecular characteristics and diurnal variations of organic aerosols at a rural site in the North China Plain with implications for the influence of regional biomass burning. Atmos. Chem. Phys. 2019, 19 (16), 10481–10496. 10.5194/acp-19-10481-2019. - DOI
-
- Huang R.-J.; Zhang Y.; Bozzetti C.; Ho K.-F.; Cao J.-J.; Han Y.; Daellenbach K. R.; Slowik J. G.; Platt S. M.; Canonaco F.; Zotter P.; Wolf R.; Pieber S. M.; Bruns E. A.; Crippa M.; Ciarelli G.; Piazzalunga A.; Schwikowski M.; Abbaszade G.; Schnelle-Kreis J.; Zimmermann R.; An Z.; Szidat S.; Baltensperger U.; Haddad I. E.; Prévôt A. S. H. High secondary aerosol contribution to particulate pollution during haze events in China. Nature 2014, 514 (7521), 218–222. 10.1038/nature13774. - DOI - PubMed
-
- Nguyen D. L.; Czech H.; Pieber S. M.; Schnelle-Kreis J.; Steinbacher M.; Orasche J.; Henne S.; Popovicheva O. B.; Abbaszade G.; Engling G.; Bukowiecki N.; Nguyen N. A.; Nguyen X. A.; Zimmermann R. Carbonaceous aerosol composition in air masses influenced by large-scale biomass burning: a case study in northwestern Vietnam. Atmos. Chem. Phys. 2021, 21 (10), 8293–8312. 10.5194/acp-21-8293-2021. - DOI
LinkOut - more resources
Full Text Sources