. 2024 Mar 12:15:1369757.
doi: 10.3389/fphar.2024.1369757. eCollection 2024.

Antiretroviral drugs from multiple classes induce loss of excitatory synapses between hippocampal neurons in culture

Affiliations

Antiretroviral drugs from multiple classes induce loss of excitatory synapses between hippocampal neurons in culture

Hannah M McMullan et al. Front Pharmacol. .

Abstract

Introduction: Antiretroviral (ARV) drugs have improved prognoses for people living with HIV. However, HIV-associated neurocognitive disorders (HAND) persist despite undetectable viral loads. Some ARVs have been linked to neuropsychiatric effects that may contribute to HAND. Synapse loss correlates with cognitive decline in HAND and synaptic deficits may contribute to the neuropsychiatric effects of ARV drugs. Methods: Using an automated high content assay, rat hippocampal neurons in culture expressing PSD95-eGFP to label glutamatergic synapses and mCherry to fill neuronal structures were imaged before and after treatment with 25 clinically used ARVs. Results and Discussion: At a concentration of 10 μM the protease inhibitors nelfinavir and saquinavir, the non-nucleoside reverse transcriptase inhibitors etravirine and the 8-OH metabolite of efavirenz, the integrase inhibitor bictegravir, and the capsid inhibitor lenacapavir produced synaptic toxicity. Only lenacapavir produced synapse loss at the nanomolar concentrations estimated free in the plasma, although all 4 ARV drugs induced synapse loss at Cmax. Evaluation of combination therapies did not reveal synergistic synaptic toxicity. Synapse loss developed fully by 24 h and persisted for at least 3 days. Bictegravir-induced synapse loss required activation of voltage-gated Ca2+ channels and bictegravir, etravirine, and lenacapavir produced synapse loss by an excitotoxic mechanism. These results indicate that select ARV drugs might contribute to neuropsychiatric effects in combination with drugs that bind serum proteins or in disease states in which synaptic function is altered. The high content imaging assay used here provides an efficient means to evaluate new drugs and drug combinations for potential CNS toxicity.

Keywords: HIV; HIV associated neurocognitive disorder; antiretroviral (ARV); high content imaging (HCI); human immunodeficiency virus; synapse loss.


Conflict of interest statement

The authors declare that the research was conducted in the absence of any commercial or financial relationships that could be construed as a potential conflict of interest. The author(s) declared that they were an editorial board member of Frontiers, at the time of submission. This had no impact on the peer review process and the final decision.

Figures

FIGURE 1
FIGURE 1
Postsynaptic density protein 95 fused to enhanced green fluorescent protein (PSD95-eGFP) labels postsynaptic terminals at excitatory synapses. (A,B) Representative maximum z-projections show images acquired using laser scanning confocal microscopy of rat hippocampal cultures transduced using a bicistronic HdAd virus with a hSyn promoter driving independent expression of PSD95-eGFP (A) and mCherry (B). (C) Image processing identified fluorescent puncta (PSDs) that were dilated for display purposes and overlaid on the mCherry image (processed). The images are representative of the t = 0 images from the entire study. These specific images were from an ROI on one of the 28 96-well plates used in the screen described in Figure 3. Scale bar indicates 10 µm.
FIGURE 2
FIGURE 2
Control experiments validate the synaptic imaging assay. (A–C) Representative processed images of ROIs before (t = 0) and after 24 h exposure to no treatment (untreated) (A) or treatment with 100 µM 2-BP (B), or 50 µM Pic/2.5 mM 4-AP (C). Insets display enlarged images of the boxed regions. Scale bars indicate 10 µm. (D) Dot plots display the change in the number of excitatory synapses (postsynaptic densities (PSDs)) detected as fluorescent PSD95-eGFP puncta for ROIs pooled from the ARV screen shown in Figure 3. Each ROI was imaged as described in Materials and Methods (t = 0) and then a half media change containing no additions (untreated), or the addition of 100 µM 2-BP, or 50 µM Pic/2.5 mM 4-AP (final concentrations are shown). After 24 h the cells were reimaged and the change in count relative to t = 0 plotted. Data are presented as mean ± SEM, with each dot representing one ROI, n = 639–712.
FIGURE 3
FIGURE 3
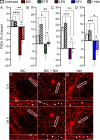
ARVs from four mechanistic classes induce excitatory synapse loss. (A) A screen of synapse loss induced by 25 ARVs. After acquisition of an initial image (t = 0) the control treatments (as described in Figure 2) or the indicated ARVs were applied at a concentration of 10 µM. Five antiretrovirals induced statistically significant synapse loss (red): the integrase strand transfer inhibitor (ISTI) bictegravir (BIC), the non-nucleoside reverse transcriptase inhibitor (NNRTI) etravirine (ETR), the capsid inhibitor (CI) lenacapavir (LEN), and the protease inhibitors (PI) nelfinavir (NFV) and saquinavir (SQV). The NRTI abacavir (ABC) significantly increased the number of synapses. Data are presented as mean ± SEM. Each treatment group includes images collected from 12 to 15 wells from 3 separate platings of primary neuronal cultures. *p < 0.05, ***p < 0.001, ****p < 0.0001. ARVs were compared to their matched untreated controls using a standard t-Test, Welch’s t-Test, or a Mann-Whitney U-test as appropriate. BIC: unpaired t-Test, nBIC = 80, nunt = 96, t(174) = 3.930, p < 0.001. ETR: unpaired t-Test, nETR = 81, nunt = 83, t(162) = 4.117, p < 0.0001. LEN: unpaired t-Test, nLEN = 64, nunt = 61, t(123) = 5.128, p < 0.0001. NFV: unpaired t-Test, nNFV = 70, nunt = 80, t(148) = 8.310, p < 0.0001. SQV: Welch’s t-Test, nSQV = 96, nunt = 85, t(175.6) = 5.153, p < 0.0001. ABC: Welch’s t-test, nABC = 83, nunt = 113, t(146.7) = 2.512, p < 0.05. Representative processed images for BIC (B), ETR (C), LEN (D), NFV (E), and SQV (F) are shown before (t = 0 h) and 24 h after application of drug. Scale bars indicate 10 µm. Abbreviations: 2-bromopalmitate (2-BP), picrotoxin/4-aminopyridine (Pic/4-AP), amprenavir (APV), atazanavir sulfate (ATV), darunavir (DRV), lopinavir (LPV), ritonavir (RTV), tipranavir (TPV), cabotegravir (CAB), dolutegravir (DTG), raltegravir (RAL), zidovudine (AZT), emtricitabine (FTC), lamivudine (3TC), tenofovir (TFV), efavirenz (EFV), doravirine (DOR), nevirapine (NVP), rilipivirine(RPV), maraviroc (MVC), enfuvirtide (T-20).
FIGURE 4
FIGURE 4
Concentration-response relationships for ARVs that induce synapse loss. (A–D) Bar graphs show change in PSDs following 24 h exposure to the treatments indicated. All data are presented as mean ± SEM. *p < 0.05, **p < 0.01, ***p < 0.001, ****p < 0.0001. Each treatment group includes images collected from 12 to 15 wells from 3 separate platings of primary neuronal cultures. (A) BIC induced synapse loss at 10 μM. n = 77–88. Kruskal–Wallis test with Dunn’s multiple comparisons tests. Χ2 (4) = 17.99, p < 0.001. (B) ETR significantly affected synapse number. n = 88–100. One-way ANOVA. F(3,378) = 3.315, p < 0.05. Treatment with 10 µM ETR was not significantly different from Untreated in post hoc analysis with Sídák’s multiple comparisons test (p = 0.21). (C) LEN induced synapse loss at 1 nM. n = 77–145. One-way ANOVA with Sídák’s multiple comparisons test. F(5,663) = 8.117, p < 0.0001. (D) NFV induced significant synaptic changes (n = 75–86. Kruskal–Wallis test Χ2 (3) = 9.994, p < 0.05) although 1 and 10 µM NFV were not significantly different from untreated in post hoc analysis with Dunn’s multiple comparisons test (p = 0.055 and p = 0.14, respectively).
FIGURE 5
FIGURE 5
ARV induced synapse loss occurs within 24 h and persists to 72 h (A–D) Bar graphs show change in PSDs following 24, 48, and 72 h exposure to the treatments indicated. All PSD changes (t = 24, 48 and 72 h) are presented as a percentage of PSDs counted before treatment (t = 0). All data are presented as mean ± SEM. *p < 0.05, **p < 0.01, ***p < 0.001, ****p < 0.0001. Each treatment group includes images collected from 12 to 15 wells from 3 separate platings of primary neuronal cultures. (A) 10 µM BIC induced a decrease in PSDs at 24 h and 72 h. Student’s t-test 24 h: nunt = 125, nBIC = 82 t(205) = 4.198, p < 0.0001. 48 h: nunt = 95, nBIC = 82 t(175) = 1.849, p = 0.066. 72 h: nunt = 94, nBIC = 82 t(174) = 3.080, p < 0.01. (B) 10 µM ETR induced a persistent decrease in PSDs to 72. 24 h: Student’s t-test nunt = 75, nETR = 78 t(151) = 3.267, p < 0.01. 48 h: Mann-Whitney nunt = 74 nETR = 74 U = 1655, p < 0.0001. 72 h: Student’s t-test nunt = 74 nETR = 70, t(142) = 3.683 p < 0.001. (C) 0.01 µM LEN induced a persistent decrease in PSDs to 72 h. Student’s t-test 24 h: nunt = 102, nLEN = 94, t(194) = 4.908, p < 0.0001. 48 h: nunt = 75, nLEN = 69, t(142) = 3.520, p < 0.001. 72 h: nunt = 75, nLEN = 68, t(141) = 3.219, p < 0.01. (D) 10 µM NFV induced a persistent decrease in in PSDs to 72 h. 24 h: Student’s t-test nunt = 90, nNFV = 104, t(192) = 2.268, p < 0.5. 48 h: Student’s t-test nunt = 90, nNFV = 102, t(190) = 2.264 p < 0.05. 72 h: Mann-Whitney U test nunt = 88, nNFV = 100, U = 3252, p < 0.01.
FIGURE 6
FIGURE 6
BIC induced synapse loss through L-type VGCCs. (A–D) Bar graphs show change in PSDs following 24 h exposure to the treatments indicated. All data are presented as mean ± SEM. *p < 0.05, **p < 0.01, ***p < 0.001, ****p < 0.0001. Each treatment group includes images collected from 12 to 15 wells from 3 separate platings of primary neuronal cultures. (A) BIC induced synapse loss was attenuated significantly by nimodipine. n = 73–80. Two-way ANOVA with Sídák’s multiple comparisons test. BIC treatment F(1,303) = 43.87, p < 0.0001, Nim treatment F(1,303) = 3.225, p = 0.073, interaction effect F(1,303) = 3.986, p < 0.05. (B) ETR induced synapse loss was not significantly different in the presence of Nim. n = 80–103 Kruskal–Wallis test with Dunn’s multiple comparisons test. Χ2 (4) = 20.71, p < 0.0001. (C) LEN induced synapse loss was not significantly different in the presence of Nim. n = 61–71. Two-way ANOVA with Sídák’s multiple comparisons test. LEN treatment F(1,256) = 37.25, p < 0.0001, Nim treatment F(1,256) = 2.619, p = 0.1068, interaction effect F(1,256) = 0.5642, p = 0.4533. (D) NFV induced synapse loss was not significantly different in the presence of Nim. n = 63–80. Two-way ANOVA with Sídák’s multiple comparisons test. NFV treatment F(1,293) = 20.71, p < 0.0001, Nim treatment F(1,293) = 1.955, p = 0.1631, interaction effect F(1,293) = 0.4440, p = 0.5057. Representative processed images show ROIs before (t = 0) and after 24 h treatment with BIC (E), BIC + Nim (F), and Nim (G). Insets display enlarged images of the boxed regions. Scale bars indicate 10 µm.
FIGURE 7
FIGURE 7
BIC, ETR, and LEN induce synapse loss through glutamatergic signaling. (A–D) Bar graphs show change in PSDs following 24 h exposure to the treatments indicated. MK801 and CNQX were administered in combination, both at a concentration of 10 µM. All data are presented as mean ± SEM. *p < 0.05, **p < 0.01, ***p < 0.001, ****p < 0.0001. Each treatment group includes images collected from 12 to 15 wells from 3 separate platings of primary neuronal cultures. (A) BIC induced synapse loss was prevented by treatment with MK801/CNQX. Two-way ANOVA with Sídák’s multiple comparisons test; n = 70–96 BIC treatment F(1,319) = 11.50, p < 0.001, MK801/CNQX treatment F(1,319) = 43.39, p < 0.0001, interaction F(1,319) = 4.668, p < 0.05. (B) ETR induced synapse loss was protected by MK801/CNQX. Welch’s ANOVA with Games-Howell’s multiple comparisons test, n = 75–82, F(3,172.2) = 6.569, p < 0.001. (C) LEN induced synapse loss was partially prevented by MK801/CNQX. Kruskal–Wallis test with Dunn’s multiple comparisons n = 61–67, Χ2 (4) = 37.70, p < 0.0001. (D) NFV induced synapse loss was not prevented by MK801/CNQX. Welch’s ANOVA with Games-Howell’s multiple comparisons test, n = 75–83, F(3,171.6) = 12.50, p < 0.0001. Representative processed images show ROIs before (t = 0) and after 24 h treatment with LEN (E), LEN + MK801/CNQX (F), and MK801/CNQX (G). Insets display enlarged images of the boxed regions. Scale bars indicate 10 µm.
FIGURE 8
FIGURE 8
Clinically relevant cART regimens did not synergize to induce excitatory synapse loss. Bar graphs show changes in PSDs following 24 h exposure to treatments indicated. All drugs were administered at a concentration of 10 µM. All data are presented as mean ± SEM. Each treatment group includes images collected from 12 to 15 wells from 3 separate platings of primary neuronal cultures. n = 62–208. cART treatments were compared to their matched controls using a Mann-Whitney, t-Test, or Welch’s t-Test as appropriate. No tests reached statistical significance.
FIGURE 9
FIGURE 9
10 µM 8-OH-EFV induces excitatory synapse loss. (A–D) Bar graphs show changes in PSDs following 24 h exposure to treatments indicated. All data are presented as mean ± SEM. *p < 0.05. Each treatment group includes images collected from 12 to 15 wells from 3 separate platings of primary neuronal cultures. (A) 10 µM 8-OH-EFV, but not 10 µM EFV, induced a significant decrease in PSDs following 24 h exposure to drug. n = 52–80. Kruskal–Wallis test with Dunn’s post-tests, Χ2 (5) = 9.269, p = 0.055. (B) 8-OH-EFV induced decreases in PSDs persist to 48 h. 24 h: nunt = 66, n8-OH = 80, Mann-Whitney test U = 2011, p < 0.05. 48 h: nunt = 63, n8-OH = 78, Mann-Whitney test U = 1978, p < .05. 72 h: nunt = 62, n8-OH = 77, t-Test t(137) = 1.698, p = 0.092. (C) Nimodipine does not protect against 8-OH-EFV induced decreases in PSDs. n = 66–84. Kruskal–Wallis test with Dunn’s post-tests, Χ2 (4) = 8.031, p < 0.05. (D) MK801/CNQX prevents 8-OH-EFV induced decreases in PSDs. n = 66–86. Kruskal–Wallis test with Dunn’s post-tests. Χ2 (4) = 7.769, p = 0.051.

References

    1. Abers M. S., Shandera W. X., Kass J. S. (2014). Neurological and psychiatric adverse effects of antiretroviral drugs. CNS Drugs 28, 131–145. 10.1007/s40263-013-0132-4 - DOI - PubMed
    1. Antinori A., Arendt G., Becker J. T., Brew B. J., Byrd D. A., Cherner M., et al. (2007). Updated research nosology for HIV-associated neurocognitive disorders. Neurology 69, 1789–1799. 10.1212/01.WNL.0000287431.88658.8b - DOI - PMC - PubMed
    1. Arendt G., De Nocker D., Von Giesen H. J., Nolting T. (2007). Neuropsychiatric side effects of efavirenz therapy. Expert Opin. Drug Saf. 6, 147–154. 10.1517/14740338.6.2.147 - DOI - PubMed
    1. Asher M. J., Mcmullan H. M., Dong A., Li Y., Thayer S. A. (2023). A complete endocannabinoid signaling system modulates synaptic transmission between human induced pluripotent stem cell-derived neurons. Mol. Pharmacol. 103, 100–112. 10.1124/molpharm.122.000555 - DOI - PMC - PubMed
    1. Autar K., Guo X., Rumsey J. W., Long C. J., Akanda N., Jackson M., et al. (2022). A functional hiPSC-cortical neuron differentiation and maturation model and its application to neurological disorders. Stem Cell Rep. 17, 96–109. 10.1016/j.stemcr.2021.11.009 - DOI - PMC - PubMed