. 2024 Jun;15(3):949-962.
doi: 10.1002/jcsm.13460. Epub 2024 Mar 27.

ADAR2 deficiency ameliorates non-alcoholic fatty liver disease and muscle atrophy through modulating serum amyloid A1

Affiliations

ADAR2 deficiency ameliorates non-alcoholic fatty liver disease and muscle atrophy through modulating serum amyloid A1

Mei-Lang Kung et al. J Cachexia Sarcopenia Muscle. 2024 Jun.

Abstract

Background: Non-alcoholic fatty liver disease (NAFLD) is the most common cause of chronic liver disease worldwide. Sarcopenia is a syndrome characterized by progressive and generalized loss of skeletal muscle mass and strength, which is commonly associated with NAFLD. Adenosine-to-inosine editing, catalysed by adenosine deaminase acting on RNA (ADAR), is an important post-transcriptional modification of genome-encoded RNA transcripts. Three ADAR gene family members, including ADAR1, ADAR2 and ADAR3, have been identified. However, the functional role of ADAR2 in obesity-associated NAFLD and sarcopenia remains unclear.

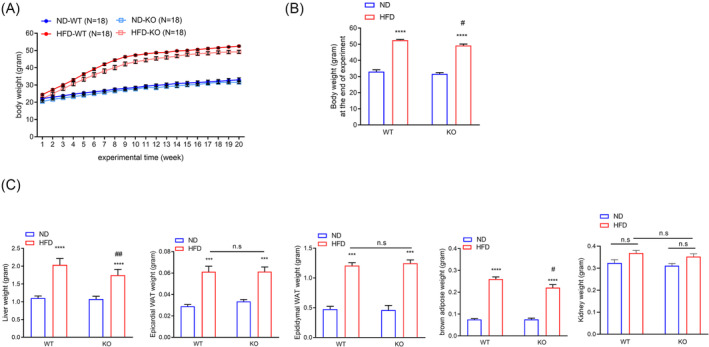
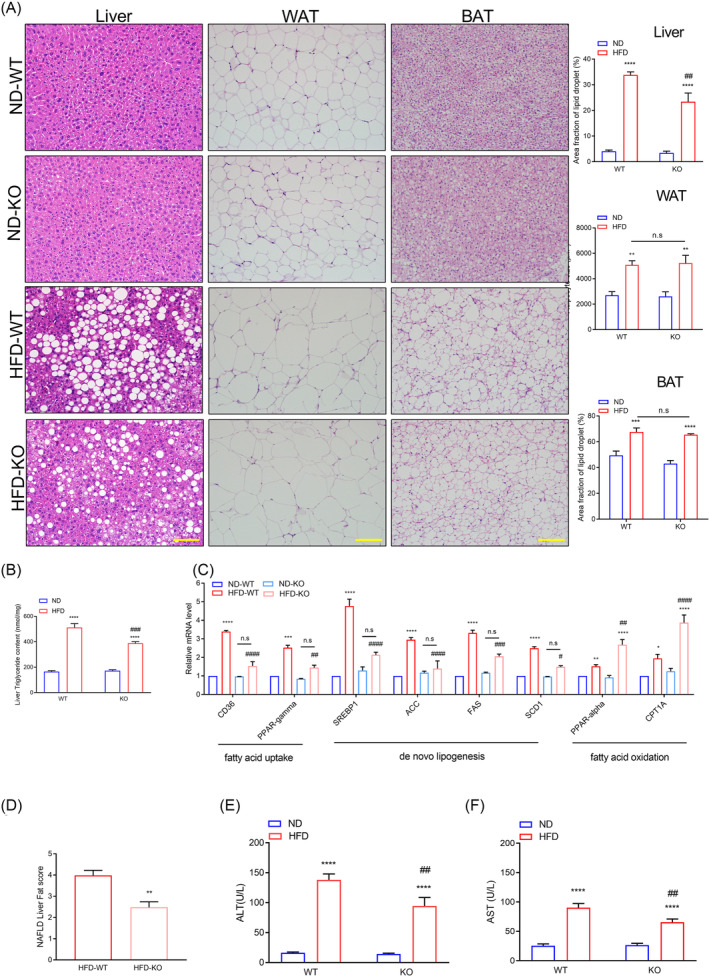
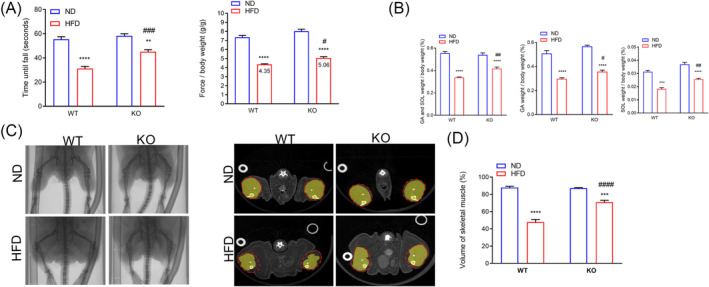
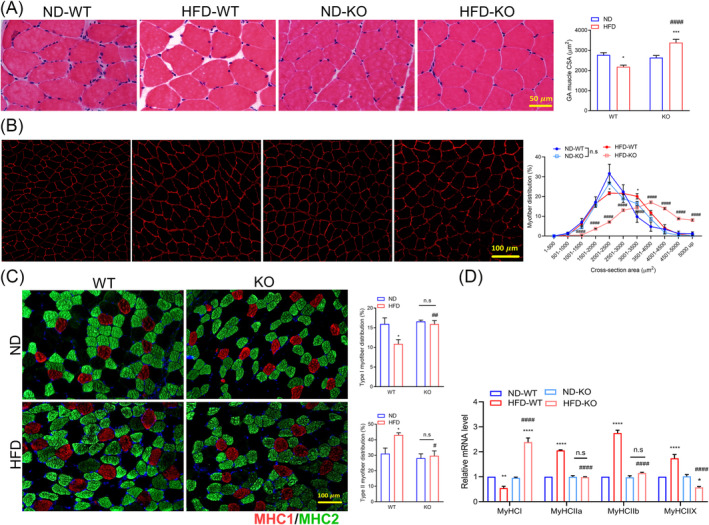
Methods: ADAR2+/+/GluR-BR/R mice (wild type [WT]) and ADAR2-/-/GluR-BR/R mice (ADAR2 knockout [KO]) were subjected to feeding with standard chow or high-fat diet (HFD) for 20 weeks at the age of 5 weeks. The metabolic parameters, hepatic lipid droplet, grip strength test, rotarod test, muscle weight, fibre cross-sectional area (CSA), fibre types and protein associated with protein degradation were examined. Systemic and local tissues serum amyloid A1 (SAA1) were measured. The effects of SAA1 on C2C12 myotube atrophy were investigated.

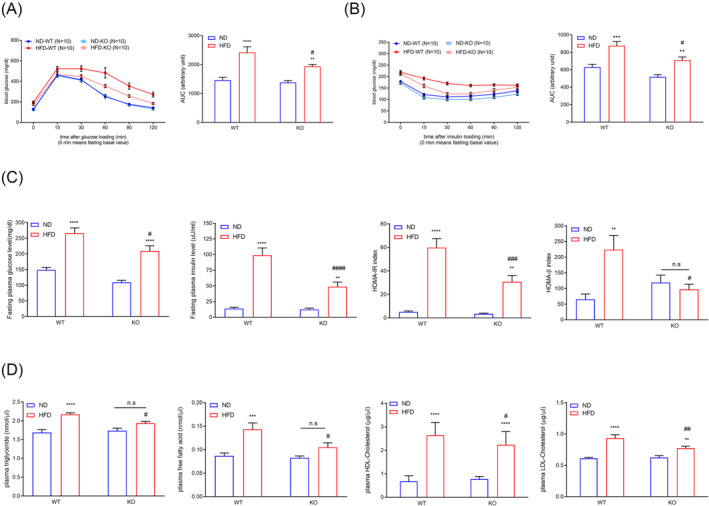
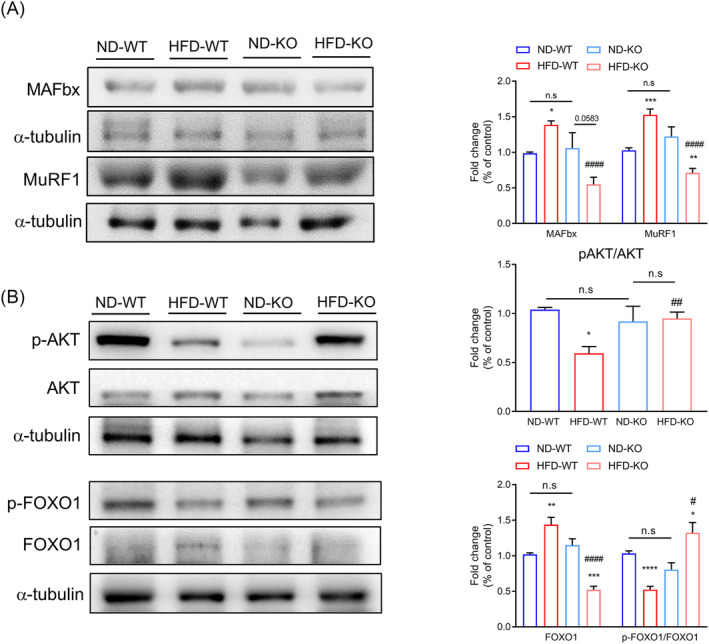
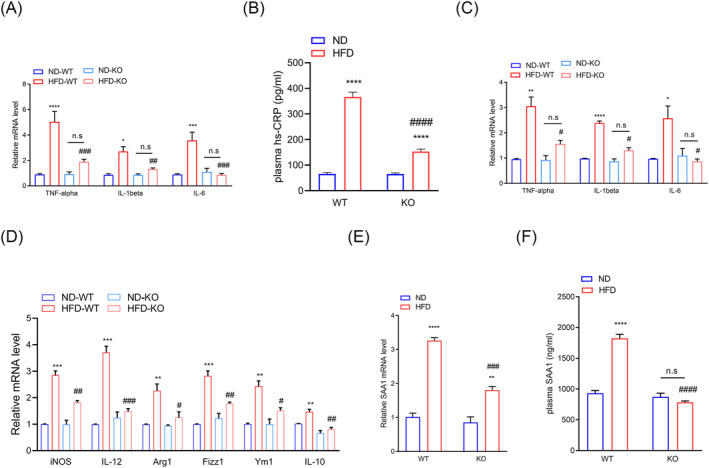
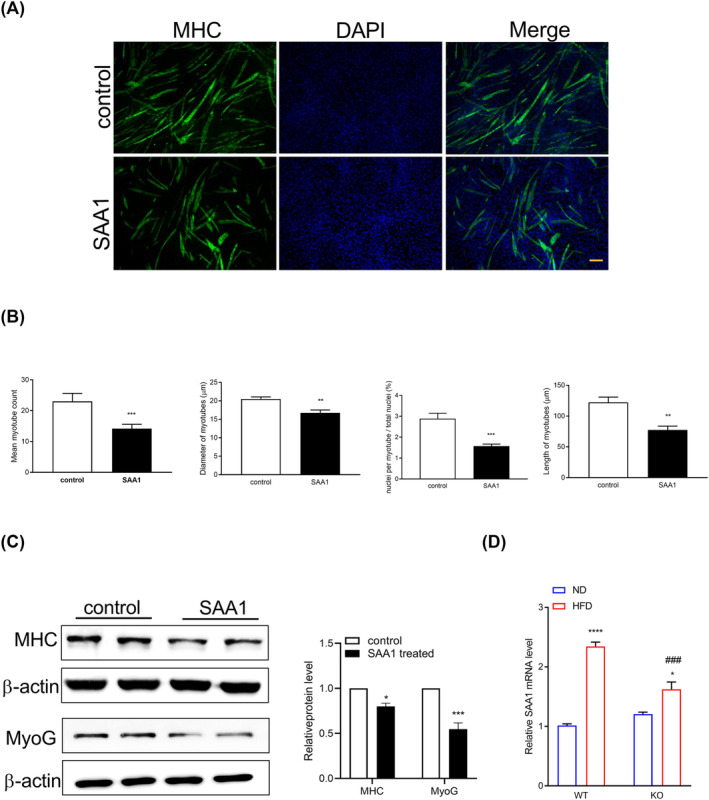
Results: ADAR2 KO mice fed with HFD exhibited lower body weight (-7.7%, P < 0.05), lower liver tissue weight (-20%, P < 0.05), reduced liver lipid droplets in concert with a decrease in hepatic triglyceride content (-24%, P < 0.001) and liver injury (P < 0.01). ADAR2 KO mice displayed protection against HFD-induced glucose intolerance, insulin resistance and dyslipidaemia. Skeletal muscle mass (P < 0.01), muscle strength (P < 0.05), muscle endurance (P < 0.001) and fibre size (CSA; P < 0.0001) were improved in ADAR2 KO mice fed with HFD compared with WT mice fed with HFD. Muscle atrophy-associated transcripts, such as forkhead box protein O1, muscle atrophy F-box/atrogin-1 and muscle RING finger 1/tripartite motif-containing 63, were decreased in ADAR2 KO mice fed with HFD compared with WT mice fed with HFD. ADAR2 deficiency attenuates HFD-induced local liver and skeletal muscle tissue inflammation. ADAR2 deficiency abolished HFD-induced systemic (P < 0.01), hepatic (P < 0.0001) and muscular (P < 0.001) SAA1 levels. C2C12 myotubes treated with recombinant SAA1 displayed a decrease in myotube length (-37%, P < 0.001), diameter (-20%, P < 0.01), number (-39%, P < 0.001) and fusion index (-46%, P < 0.01). Myogenic markers (myosin heavy chain and myogenin) were decreased in SAA1-treated myoblast C2C12 cells.

Conclusions: These results provide novel evidence that ADAR2 deficiency may be important in obesity-associated sarcopenia and NAFLD. Increased SAA1 might be involved as a regulatory factor in developing sarcopenia in NAFLD.

Keywords: ADAR2; NAFLD; SAA1; diabetes; inflammation; muscle atrophy.


Conflict of interest statement

The authors declare no competing interests.

Figures

Figure 1
Figure 1
ADAR2 KO decreased body weight and liver weight in male obese mice. Physiological parameters in mice from the age of 5–25 weeks. (A) Body weight of mice during the feedings. n = 18 mice per group. (B) Quantitative results of the body weight of mice after the end of the regimen. n = 18 mice per group. (C) Weights of liver, epididymal adipose, epicardial adipose, BAT and kidney derived from WT and ADAR2 KO mice fed with ND or HFD are shown. n = 18 mice per group. All data are expressed as the mean ± SEM. Tukey's multiple comparison test after the two‐way ANOVA was conducted for (A)–(C). *ND‐WT group versus HFD‐WT group or ND‐KO group versus HFD‐KO group; ***P < 0.001, ****P < 0.0001; #HFD‐WT group versus HFD‐KO group; # P < 0.05, ## P < 0.01; n.s., not significant.
Figure 2
Figure 2
ADAR2 KO ameliorated blood glucose levels, blood insulin levels and serum lipid levels in male obese mice. (A) Blood glucose levels during IPGTT in male mice (left panel). Analysis of the area under the curve (AUC) of IPGTT results (right panel). n = 10 mice per group. (B) Blood glucose levels during IPITT in male mice (left panel). Analysis of the AUC of IPGTT results (right panel). n = 10 mice per group. (C) Fasting plasma glucose levels, fasting plasma insulin levels, calculated HOMA‐IR index and calculated HOMA‐β index of male mice. n = 10 mice per group. (D) Plasma levels of TG, free fatty acid, HDL‐cholesterol and LDL‐cholesterol in mice. n = 10 mice per group. All data are expressed as the mean ± SEM. Tukey's multiple comparison test after the two‐way ANOVA was conducted for (A)–(D). *ND‐WT group versus HFD‐WT group or ND‐KO group versus HFD‐KO group; **P < 0.01, ***P < 0.001, ****P < 0.0001; #HFD‐WT group versus HFD‐KO group; # P < 0.05, ## P < 0.01, ### P < 0.001, #### P < 0.0001; n.s., not significant.
Figure 3
Figure 3
ADAR2 KO alleviated hepatic steatosis and injury in mice fed with HFD. (A) Representative H&E staining of liver, WAT and BAT derived from WT and ADAR2 KO mice fed with ND or HFD is shown (left panel) and quantitative analysis of WAT size of different groups is shown (right panel). Scale bars = 100 μm. n = 5 mice per group. (B) Quantitative results of the liver TG content in each group. n = 5 mice per group. (C) Quantitative PCR was performed to determine the hepatic mRNA levels of genes related to fatty acid metabolism (CD36, PPAR‐gamma, SREBP1, ACC, FAS, SCD1, PPAR‐alpha and CPT1A) in mice from the indicated groups. Gene expression was normalized to GAPDH mRNA levels. n = 6 mice per group. (D) NAFLD activity score. n = 5 mice per group. (E, F) Serum levels of AST and ALT were measured in mice after 20 weeks of ND diet feeding or HFD challenge. n = 9 mice per group. All data are expressed as the mean ± SEM. Tukey's multiple comparison test after the two‐way ANOVA was conducted for (A)–(C), (E) and (F). Unpaired two‐tailed Student's t‐test was conducted for (D). *ND‐WT group versus HFD‐WT group or ND‐KO group versus HFD‐KO group; *P < 0.05, **P < 0.01, ***P < 0.001, ****P < 0.0001; #HFD‐WT group versus HFD‐KO group; # P < 0.05, ## P < 0.01, ### P < 0.001, #### P < 0.0001; n.s., not significant.
Figure 4
Figure 4
ADAR2 KO increased muscle endurance, muscle strength and skeletal muscle mass. (A) Rotarod performance (right panel) and fore‐limb grip strength (left panel). n = 10 mice per group. (B) Relative gastrocnemius and soleus muscle weight in each group. n = 10 mice per group. (C) Scanned raw images were reconstructed in 3D and analysed using MicroView analysis software (left panel). The cross sections of the calf were represented (middle panel). The whole calf was circled with a dotted line, and the skeletal muscle was marked yellow. n = 6 mice per group. (D) Percentage of skeletal muscle volume in the whole calf (right panel). n = 6 mice per group. All data are expressed as the mean ± SEM. Tukey's multiple comparison test after the two‐way ANOVA was conducted for (A)–(D). *ND‐WT group versus HFD‐WT group or ND‐KO group versus HFD‐KO group; **P < 0.01, ***P < 0.001, ****P < 0.0001; #HFD‐WT group versus HFD‐KO group; # P < 0.05, ## P < 0.01, ### P < 0.001, #### P < 0.0001.
Figure 5
Figure 5
ADAR2 KO prevented HFD‐induced myofiber atrophy. (A) Representative cross sections and CSA quantification from the GA muscle of mice. Scale bar = 50 μm. n = 6 mice per group. (B) Representative images of cross sections and myofiber distribution frequency from the GA muscle of mice (red = laminin). Scale bar = 100 μm. n = 5 mice per group. (C) Representative images of fibre type staining of GA muscles (red = type 1 fibres; green = type 2A fibres; blue = cell nuclei). Scale bars = 100 μm (left panel). Representative quantification of MyHC fibre type from the GA muscles of mice (right panel). n = 5 mice per group. (D) Quantitative RT‐PCR analysis of MyHCI and MyHCIIa/b/x, respectively. n = 6 mice per group. All data are expressed as the mean ± SEM. Tukey's multiple comparison test after the two‐way ANOVA was conducted for (A), (C) and (D). *ND‐WT group versus HFD‐WT group or ND‐KO group versus HFD‐KO group; *P < 0.05, **P < 0.01, ***P < 0.001, ****P < 0.0001; #HFD‐WT group versus HFD‐KO group; # P < 0.05, ## P < 0.01, #### P < 0.0001. Tukey's multiple comparison test after the two‐way ANOVA was conducted for (B). $ND‐WT group versus HFD‐WT group, $ P < 0.05; *ND‐KO group versus HFD‐KO group, **P < 0.01, ****P < 0.0001; #HFD‐WT group versus HFD‐KO group; #### P < 0.0001; n.s., not significant.
Figure 6
Figure 6
ADAR2 KO improved HFD‐induced muscle atrophy through the AKT/FOXO1 pathway. (A) Western blot analysis of the protein expression of muscle atrophy markers (MAFbx and MuRF1) using tissue lysates of GA muscle in each group (n = 6 mice per group). (B) Western blot analysis of the protein expression p‐FOXO, FOXO1, p‐Akt and Akt using tissue lysates of GA muscle in each group. α‐Tubulin was used as a loading control (n = 6 mice per group). All data are presented as the mean ± SEM. Unpaired two‐tailed Student's t‐test was conducted for (A) and (B). *ND‐WT group versus HFD‐WT group or ND‐KO group versus HFD‐KO group; *P < 0.05, **P < 0.01, ***P < 0.001, ****P < 0.0001; #HFD‐WT group versus HFD‐KO group; # P < 0.05, ## P < 0.01, ##### P < 0.0001; n.s., not significant.
Figure 7
Figure 7
ADAR2 KO mitigated the HFD‐induced inflammatory response. (A) Quantitative PCR was performed to determine the hepatic mRNA levels of genes related to inflammation (TNF‐α, IL‐1β and IL‐6) in mice from the indicated groups. Gene expression was normalized to GAPDH mRNA levels. n = 6 mice per group. (B) Plasma levels of CRP in mice from the indicated groups. n = 6 mice per group. (C) Quantitative PCR was performed to determine the mRNA levels of genes related to inflammation (TNF‐α, IL‐1β and IL‐6) in the GA muscle of mice from the indicated groups. Gene expression was normalized to GAPDH mRNA levels. n = 6 mice per group. (D) Quantitative PCR was performed to determine the mRNA levels of genes related to macrophages (M1: iNOS and IL‐12; M2: Arg‐1, Fizz1, Ym1 and IL‐10) in the GA muscle of mice from the indicated groups. Gene expression was normalized to GAPDH mRNA levels. n = 6 mice per group. (E) Plasma concentrations of SAA1 from ADAR2 KO and control mice treated with ND or HFD. n = 10 mice per group. (F) Quantitative PCR was performed to determine the hepatic mRNA levels of SAA1 in mice from the indicated groups. n = 6 mice per group. Each value represents the mean ± SEM from at least three independent experiments. Tukey's multiple comparison test after the two‐way ANOVA was conducted for (A)–(F). *ND‐WT group versus HFD‐WT group or ND‐KO group versus HFD‐KO group; *P < 0.05, **P < 0.01, ***P < 0.001, ****P < 0.0001; #HFD‐WT group versus HFD‐KO group; # P < 0.05, ## P < 0.01, ### P < 0.001, #### P < 0.0001; n.s., not significant.
Figure 8
Figure 8
Recombinant SAA1 treatment of C2C12 myoblasts resulted in smaller myotubes. C2C12 cells were differentiated for 5 days and treated with 10 μg/mL recombinant SAA1 or vehicle (control) for 72 h. (A) Representative images of immunofluorescence staining with an anti‐myosin heavy chain (MyHC) antibody (green). Nuclei were stained with DAPI (blue). Scale bar = 100 μm. (B) Representative quantifications of diameter, length, number and fusion index were measured. (C) Western blot analysis of the protein expression of myogenic markers (MHC and MyoG) in lysates from C2C12 cells. (D) Quantitative PCR was performed to determine the mRNA levels of SAA1 in the GA muscle of mice from the indicated groups. Each value represents the mean ± SEM from at least three independent experiments. Unpaired two‐tailed Student's t‐test was conducted for (B) and (C). *Control group versus SAA1 group; *P < 0.05, **P < 0.01, ***P < 0.001; Tukey's multiple comparison test after the two‐way ANOVA was conducted for (D). *ND‐WT group versus HFD‐WT group or ND‐KO group versus HFD‐KO group; *P < 0.05, ****P < 0.0001; #HFD‐WT group versus HFD‐KO group; ### P < 0.001.

References

    1. Liu A, Galoosian A, Kaswala D, Li AA, Gadiparthi C, Cholankeril G, et al. Nonalcoholic fatty liver disease: epidemiology, liver transplantation trends and outcomes, and risk of recurrent disease in the graft. J Clin Transl Hepatol 2018;6:420–424. - PMC - PubMed
    1. Anstee QM, McPherson S, Day CP. How big a problem is non‐alcoholic fatty liver disease? BMJ 2011;343:d3897. - PubMed
    1. Hazlehurst JM, Woods C, Marjot T, Cobbold JF, Tomlinson JW. Non‐alcoholic fatty liver disease and diabetes. Metabolism 2016;65:1096–1108. - PMC - PubMed
    1. Kim JA, Choi KM. Sarcopenia and fatty liver disease. Hepatol Int 2019;13:674–687. - PubMed
    1. Cruz‐Jentoft AJ, Sayer AA. Sarcopenia. Lancet 2019;393:2636–2646. - PubMed