. 2024 May 10;134(10):1306-1326.
doi: 10.1161/CIRCRESAHA.123.323464. Epub 2024 Mar 27.

Cardiac GR Mediates the Diurnal Rhythm in Ventricular Arrhythmia Susceptibility

Affiliations

Cardiac GR Mediates the Diurnal Rhythm in Ventricular Arrhythmia Susceptibility

Roman Tikhomirov et al. Circ Res. .

Abstract

Background: Ventricular arrhythmias (VAs) demonstrate a prominent day-night rhythm, commonly presenting in the morning. Transcriptional rhythms in cardiac ion channels accompany this phenomenon, but their role in the morning vulnerability to VAs and the underlying mechanisms are not understood. We investigated the recruitment of transcription factors that underpins transcriptional rhythms in ion channels and assessed whether this mechanism was pertinent to the heart's intrinsic diurnal susceptibility to VA.

Methods and results: Assay for transposase-accessible chromatin with sequencing performed in mouse ventricular myocyte nuclei at the beginning of the animals' inactive (ZT0) and active (ZT12) periods revealed differentially accessible chromatin sites annotating to rhythmically transcribed ion channels and distinct transcription factor binding motifs in these regions. Notably, motif enrichment for the glucocorticoid receptor (GR; transcriptional effector of corticosteroid signaling) in open chromatin profiles at ZT12 was observed, in line with the well-recognized ZT12 peak in circulating corticosteroids. Molecular, electrophysiological, and in silico biophysically-detailed modeling approaches demonstrated GR-mediated transcriptional control of ion channels (including Scn5a underlying the cardiac Na+ current, Kcnh2 underlying the rapid delayed rectifier K+ current, and Gja1 responsible for electrical coupling) and their contribution to the day-night rhythm in the vulnerability to VA. Strikingly, both pharmacological block of GR and cardiomyocyte-specific genetic knockout of GR blunted or abolished ion channel expression rhythms and abolished the ZT12 susceptibility to pacing-induced VA in isolated hearts.

Conclusions: Our study registers a day-night rhythm in chromatin accessibility that accompanies diurnal cycles in ventricular myocytes. Our approaches directly implicate the cardiac GR in the myocyte excitability rhythm and mechanistically link the ZT12 surge in glucocorticoids to intrinsic VA propensity at this time.

Keywords: arrhythmias, cardiac; circadian rhythm; glucocorticoids; ion channels; receptors, glucocorticoid; transcription factors.


Conflict of interest statement

Disclosures None.

Figures

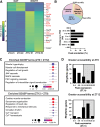
Figure 1.
Figure 1.
Day-night variation in chromatin accessibility in ventricular cardiomyocyte nuclei. A, Heatmap depicting 1111 day-night differentially accessible (DA) chromatin regions from assay for transposase-accessible chromatin with sequencing (ATAC-seq) performed in PCM1+ mouse left ventricular myocyte nuclei. Two independent biological replicates per time point are shown, and each replicate was composed of left ventricle samples pooled from 3 mice. Regions annotating to core circadian clock transcription factors (TFs) and genes essential for ventricular excitability or contractility are highlighted; in some cases (those highlighted in red), qPCR confirmed that transcript expression demonstrated a 24-hour rhythm (JTK_CYCLE–adjusted P<0.05) and peak expression coincided with the time point (ZT0 or ZT12) where chromatin was more accessible. B (Top), Pie chart of genomic region annotation for DA peaks (promoter=−1/+0.1 kb of transcription start site [TSS]). B (Bottom), Histogram denoting distance of ATAC-seq peaks to the associated TSS. C, Enrichment dot plots for gene ontology (GO):biological process pathways annotated from DA peaks more accessible at ZT0 and ZT12. Selected terms relevant to cardiomyocyte function are given. Gene count enriched in the pathway is denoted by dot diameter, and dot color shows the pathway enrichment significance. All presented pathways were significantly enriched (Binomial test, false discovery rate [FDR]–adjusted P<0.05). D, Histogram of gene expression phase for rhythmic genes (JTK_CYCLE–adjusted P<0.05; from Zhang et al) in which DA chromatin regions were identified at (top) ZT0 and (bottom) ZT12. BP indicates biological process; MAPK, mitogen-activated protein kinase; PKC, protein kinase C; qPCR, quantitative polymerase chain reaction; ZT, zeitgeber time; ZT0, time of lights on; and ZT12, time of lights off.
Figure 2.
Figure 2.
GR enrichment at ZT12. A, Columns show significantly enriched transcription factor (TF) motifs (color-coded to denote TF family) colored from yellow to purple with yellow being the most significant (SeqPos Z score, Binomial test). The number of binding sites was similarly colored with yellow denoting a greater number of sites. TFs associated with enriched motifs in which day-night rhythmicity has been previously established are highlighted with a checkmark. _1 denotes instances where >1 consensus motif for a particular TF was identified. B (Left), Representative GR immunofluorescent labeling of 10-µm sections of mouse left ventricular biopsies isolated at ZT0 and at ZT12. Cardiomyocytes were identified by wheat germ agglutinin staining and analyzed for GR nuclear localization (red signal) relative to the DAPI label (blue signal; 4 hearts per time point, ≈65 ventricular myocytes per animal analyzed. Scale bar, 20 µm. B (Right), Summary data derived from images in (B, left) show (1) the percentage of GR+ nuclei relative to the total number of DAPI+ cardiomyocyte nuclei analyzed and (2) the signal intensity of GR labeling. P value shown (Mann-Whitney U test). C, Venn diagram denoting 212 high-confidence GR targets obtained by intersecting assay for transposase-accessible chromatin with sequencing (ATAC-seq) with GR chromatin immunoprecipitation sequencing (ChIP-seq) data. D, Gene ontology (GO):biological process enrichment for 212 putative GR target genes derived from (C). (Binomial test, false discovery rate [FDR]–adjusted P<0.05.) E (Top), UCSC genome browser tracks of open chromatin regions at Kcnh2, Scn5a, and Per2 loci. Y axis scale=0 to 5 counts per million reads for Kcnh2 and Scn5a and 0 to 3 counts per million reads for Per2. Arrows denote predicted and subsequently ChIP-verified evolutionarily conserved GR binding motifs within differentially accessible (DA) regions. E (Middle), GR ChIP-qPCR assay testing GR occupancy of predicted genomic sites at Kcnh2, Scn5a, and Per2 using chromatin from mouse left ventricle biopsies harvested at ZT0 and ZT12 (n=3 per time point). ChIP enrichment for sites of interest and negative control shown. Each point is an independent biological replicate. Data were normalized for primer efficiency by carrying out qPCR for each primer pair with input DNA isolated and pooled from all samples. The arrow denotes sites with significant ChIP enrichment relative to negative control. P value is shown (Kruskal-Wallis test with the Dunn multiple comparisons test). E (Bottom), Sequence conservation of GR-occupied sites at Kcnh2, Scn5a, and Per2. Aligned human GR sites were obtained from the UCSC Genome Browser. Nonconserved bases are highlighted in red. BP indicates biological process; DAPI, 4′,6-diamidino-2-phenylindole; dex, dexamethasone; GR, glucocorticoid receptor; qPCR, quantitative polymerase chain reaction; UCSC, University of California Santa Cruz; WGA, wheat germ agglutinin; ZT0, time of lights on; and ZT12, time of lights off.
Figure 3.
Figure 3.
Functional consequences of the day-night rhythm in GR target genes. A, Representative SCN5A western blot from left ventricular free wall biopsies isolated at ZT0, ZT4, ZT8, ZT12, ZT16 and ZT20. Corresponding stain-free total protein gel was used for quantification and is shown in (bottom). B (Left), SCN5A protein expression from western blots. Data are from n=4 mice per time point and pooled from 2 sets of independent experiments. In this and all similar graphs, light and dark phases are indicated by the horizontal bars. Protein expression is normalized to that at ZT0. SCN5A mRNA abundance (red symbols) from Figure S2 is overlaid for comparison of the mRNA and protein time courses. B (Right), western blot data showing SCN5A expression from n=4 mice per time point at ZT0 and ZT12. P value derived from the Mann-Whitney U test is given. C, Representative traces of INa in isolated ventricular myocytes at (left) ZT0 and (right) ZT12 evoked by depolarizing pulses shown in the inset (top). D, Current-voltage relationships for INa at ZT0 (open circles) and ZT12 (filled circles) fitted by employing the Boltzmann relation: INa=Gmax(V−Vrev)/{1+exp[(V0.5,act−V)/s]}, where Vrev is the extrapolated reversal potential, V is the membrane test potential, INa is the current at given voltage, Gmax is the cell maximum conductance, V0.5,act is the voltage for half current activation, and s is the slope factor of the Boltzmann relation. Each point represents the mean±SEM of 13 cells from 3 mice at each time point. P values from linear effects mixed model followed by the Sidak multiple comparisons test given in the inset. E, Mean±SEM INa peak density at holding potentials of −30 and −35 mV. P value was computed from a nested t test. F, Representative KCNH2 western blot from left ventricular free wall biopsies isolated at ZT0, ZT4, ZT8, ZT12, ZT16, and ZT20. Corresponding stain-free total protein gel was used for quantification and is shown in (bottom). G (Left), KCNH2 protein expression from western blots. Data are from n=4 mice per time point. Protein expression is normalized to that at ZT0. KCNH2 mRNA abundance (red symbols) from Figure S2 is overlaid for comparison of the mRNA and protein time courses. G (Right), western blot data showing KCNH2 expression from n=4 mice per time point at ZT0 and ZT12. P value derived from the Mann-Whitney U test is given. H, Representative traces of IKr defined as E-4031 sensitive current at ZT0 and ZT12. Insets show IKr tails on current reactivation. Corresponding current-voltage relationships for IKr measured at the end of the depolarizing pulse (END) are shown in (I), and IKr measured at the peak of the tail (tail) on reactivation is shown in (J). Data are from n=3 mice at ZT0 (open circles) and n=3 mice at ZT12 (filled circles). Each point represents the mean±SEM of 8 cells at ZT0 and 9 cells at ZT12. P values from the linear effects mixed model followed by the Sidak multiple comparisons test are given. GR indicates glucocorticoid receptor; ZT0, time of lights on; ZT4, four hours after lights on; ZT8, eight hours after lights on; ZT12, time of lights off; ZT16, four hours after lights off; and ZT20, eight hours after lights off.
Figure 4.
Figure 4.
Impact of the day-night rhythm in ion channels on the ventricular action potential and arrhythmia susceptibility at ZT12. A, Action potentials at a basic stimulus interval of 150 ms at ZT0 and ZT12. B, Action potentials in (A) shown at an expanded time scale enabling comparison of the upstroke velocity of the action potential at ZT0 and ZT12. C, Action potential restitution curves at ZT0 and ZT12. Action potential duration at 90% repolarization (APD90) is plotted against the S2 stimulus interval (basic stimulus interval, 300 ms). D, Conduction velocity as a function of the basic stimulus interval at ZT0 and ZT12. E, 2-dimensional plots of distance against time with the membrane potential color-coded following an S1 stimulus (at the basic stimulus interval of 200 ms) and an S2 stimulus at different stimulus intervals of 50, 55, and 60 ms at ZT0. F (Left), Width of the vulnerability window at a basic stimulus interval of 200 ms at ZT0 and ZT12. F (Right), Wavelength of excitation waves at a basic stimulus interval of 200 ms at ZT0 and ZT12. ZT0 indicates time of lights on; and ZT12, time of lights off.
Figure 5.
Figure 5.
Effect of chronic pharmacological GR block on ion channel rhythms and ventricular arrhythmia (VA) susceptibility. A, RU486 dosing strategy and experimental design (n=5 mice per group for all parameters). B, Plasma corticosterone measured using ELISA from blood samples collected at ZT0, ZT4, ZT8, ZT12, ZT16 and ZT20 following 4 days of vehicle (left) or RU486 (right) intraperitoneal injection. In this and all similar figures, a significant day-night rhythm (as determined by JTK_CYCLE; P value shown) is denoted by the fitted sine wave (solid line). C, Summary data derived from immunofluorescent labeling studies showing the percentage of GR+ nuclei relative to the total number of DAPI+ cardiomyocyte nuclei analyzed at ZT0, ZT4, ZT8, ZT12, ZT16, and ZT20 in the vehicle (black) and RU486-treated (red) hearts. Data in the RU486 group were not rhythmic (JTK_CYCLE P value shown), but data are fitted with a sine wave for visual aid (dotted line). D, Expression of GR target genes measured by qPCR in mouse left ventricle biopsies at ZT0, ZT4, ZT8, ZT12, ZT16, and ZT20 following 4 days of vehicle (black) or RU486 (red) administration. Expression normalized to Ipo8 and Tbp. Data are normalized to control ZT0 mean, and ZT0 is replotted as ZT24 as a visual aid. E, Representative ECG recordings of VA in vehicle-treated Langendorff-perfused mouse hearts triggered by programmed electrical stimulation at ZT12 but not at ZT0 and protection from pacing-induced VA in mice treated with 20-mg/kg RU486 daily for 4 days before termination. S1 cycle length=98 ms and S2 to S10 cycle length=18 ms in representative records shown. F, Summarized VA susceptibility given as a percentage of inducible VA in vehicle- and RU486-treated mice. The P value shown was determined by a χ2 test. DAPI indicates 4′,6-diamidino-2-phenylindole; GR, glucocorticoid receptor; qPCR, quantitative polymerase chain reaction; ZT0, time of lights on; ZT4, four hours after lights on; ZT8, eight hours after lights on; ZT12, time of lights off; ZT16, four hours after lights off; and ZT20, eight hours after lights off.
Figure 6.
Figure 6.
Cardiac-specific GR knockout modifies day-night rhythms in ECG parameters and arrhythmia susceptibility. A, Representative ECG recordings of ventricular arrhythmia (VA) in Langendorff-perfused GRfl/fl mouse hearts triggered by programmed electrical stimulation at ZT12 and protection from pacing-induced VA at ZT12 in cardiomyocyte-specific GR knockout (cardioGRKO) mice. S1 cycle length=98 ms and S2 to S10 cycle length=38 ms in representative records shown. B, Summarized VA susceptibility given as a percentage in GRfl/fl and cardioGRKO mice. VA induction in 5 to 7 hearts/group (P value shown, χ2 test). C, Representative heart rate data measured using biotelemetry in GRfl/fl and cardioGRKO mice (n=4 per genotype) over a 36-h period. Light and dark-shaded regions represent light and dark phases. Data are fit with a standard sine wave. The adjusted P value denoting circadian rhythmicity (zero amplitude F test from the Cosinor analysis) is given. D, Midline Estimating Statistic of Rhythm (MESOR) and amplitude of the heart rate rhythm computed by the Cosinor analysis in GRfl/fl and cardioGRKO mice (n=4/genotype). P value was determined by a Mann-Whitney U test. E through H, ECG intervals from telemetry data measured at ZT0 and ZT12 in GRfl/fl and cardioGRKO mice (P values shown; 2-way ANOVA with the Tukey multiple comparisons test). GR indicates glucocorticoid receptor; ZT0, time of lights on; and ZT12, time of lights off.
Figure 7.
Figure 7.
Cardiomyocyte GR knockout modifies the day-night rhythm in the cardiac transcriptome despite persistent rhythms in core clock genes. A (Left), Volcano plots representing ZT12 versus ZT0 differentially expressed genes (DEGs) in left ventricular biopsies from GRfl/fl and cardiomyocyte-specific GR knockout (cardioGRKO) mice (n=5 per time point and per group) determined by RNAseq. Blue circles, downregulated DEGs; red circles, upregulated DEGs. Core clock transcription factors (TFs), Bmal1 and Clock, shown. A (Right), Venn diagram denoting the overlap between DEGs in the 2 genotypes. B, Heatmap displaying mean value per time point for 421 genes measured by RNAseq at ZT0 and ZT12 in GRfl/fl and cardioGRKO mice in which putative GR binding sites were identified by ATACseq and motif analysis. Data were z-scored by gene. Genes are ordered by time of maximal expression in the GRfl/fl group. C, Heatmap displaying mean value per time point for all transcripts relating to ion channel/Ca2+ handling proteins that showed differential day-night expression in GRfl/fl and cardioGRKO from RNAseq analysis. GR targets Kcnh2 and Scn5a are highlighted in red. Data were z-scored by gene. D and E, mRNA expression measured in left ventricular free wall biopsies harvested at ZT0, ZT4, ZT8, ZT12, ZT16, and ZT20 in GRfl/fl mice and CardioGRKO mice for core clock genes and GR targets of interest in which an altered ZT0/ZT12 amplitude was observed in GRfl/fl mice vs CardioGRKO mice using RNAseq. Expression was normalized to Ipo8 and Tbp (n=5 hearts per time point). ZT0 is replotted as ZT24 as a visual aid only. JTK_CYCLE–adjusted P values given for GRfl/fl mice in black and CardioGRKO mice in red. A significant day-night rhythm (as determined by JTK_CYCLE) is further denoted by the fitted sine wave (solid line). For visual aid, a sine wave with a dotted line has been fitted for transcripts that were not rhythmic. F, JTK_CYCLE computed amplitude of 24-h rhythm of mRNA expression for genes given in (D and E). P values given determined by the Mann-Whitney U test. GR indicates glucocorticoid receptor; ZT0, time of lights on; ZT4, four hours after lights on; ZT8, eight hours after lights on; ZT12, time of lights off; ZT16, four hours after lights off; and ZT20, eight hours after lights off.
Figure 8.
Figure 8.
Cardiomyocyte GR knockout modifies gene coexpression patterns. A, Enrichment dot plots for KEGG pathway enrichment analysis for (left) concordant, (middle) discordant, and (right) antiphase differentially expressed genes (DEGs) in GRfl/fl and cardiomyocyte-specific GR knockout (cardioGRKO) mice. The enrichment (gene) ratio is denoted by the dot diameter, and the dot color shows the pathway enrichment significance. All presented pathways were significantly enriched (false discovery rate [FDR] <0.05; Fisher exact test with Benjamini-Hochberg adjustment). B (Top), Cluster dendrogram determining coexpression clusters obtained by weighted gene coexpression network analyses performed on 7466 genes in GRfl/fl and cardioGRKO mice detected by RNAseq. Each discrete cluster was assigned a unique color on the horizontal bar. Coexpressing clusters in cardioGRKO hearts were assigned numbers for visualization. B (Bottom), KEGG enrichment dot plot for modules 1 and 3 that were found to be differentially coexpressed in cardioGRKO hearts; 1157 genes from both modules were used as input data. The enrichment ratio is given by dot diameter, and the dot color shows the pathway enrichment significance. C, Protein-protein interaction (PPI) network plotted in Cytoscape using all component genes from selected KEGG pathways given in (B). Genes were uploaded to the STRING database to plot PPI; medium confidence for edges was chosen. The network was significantly enriched (P=8.05×10⁻¹⁷). Each node represents a gene, and the color gradient (from −7.4 represented in blue to 7.4 represented in red) represents the relative abundance of a gene in cardioGRKO versus GRfl/fl samples at ZT12. Gene annotation to respective enriched KEGG pathway given by node shape. cGMP indicates cyclic guanosine monophosphate; ErbB, epidermal growth factor receptor tyrosine kinase; GR, glucocorticoid receptor; HIF-1, hypoxia-inducible factor-1; KEGG, Kyoto encyclopedia of genes and genomes; MAPK, mitogen-activated protein kinase; PKG, protein kinase G; PPAR, peroxisome proliferator activated receptor; TCA, tricarboxylic acid cycle; and ZT12, time of lights off.

Comment in

References

    1. Srinivasan NT, Schilling RJ. Sudden cardiac death and arrhythmias. Arrhythm Electrophysiol Rev. 2018;7:111–117. doi: 10.15420/aer.2018:15:2 - PMC - PubMed
    1. Black N, D’Souza A, Wang Y, Piggins H, Dobrzynski H, Morris G, Boyett MR. Circadian rhythm of cardiac electrophysiology, arrhythmogenesis, and the underlying mechanisms. Heart Rhythm. 2019;16:298–307. doi: 10.1016/j.hrthm.2018.08.026 - PMC - PubMed
    1. Muller JE, Ludmer PL, Willich SN, Tofler GH, Aylmer G, Klangos I, Stone PH. Circadian variation in the frequency of sudden cardiac death. Circulation. 1987;75:131–138. doi: 10.1161/01.cir.75.1.131 - PubMed
    1. Tofler GH, Gebara OC, Mittleman MA, Taylor P, Siegel W, Venditti FJ, Rasmussen CA, Muller JE. Morning peak in ventricular tachyarrhythmias detected by time of implantable cardioverter/defibrillator therapy. The CPI Investigators. Circulation. 1995;92:1203–1208. doi: 10.1161/01.cir.92.5.1203 - PubMed
    1. Willich SN, Levy D, Rocco MB, Tofler GH, Stone PH, Muller JE. Circadian variation in the incidence of sudden cardiac death in the Framingham heart study population. Am J Cardiol. 1987;60:801–806. doi: 10.1016/0002-9149(87)91027-7 - PubMed

Publication types