. 2024 Mar 15;151(6):dev201757.
doi: 10.1242/dev.201757. Epub 2024 Mar 27.

Inter-plane feedback coordinates cell morphogenesis and maintains 3D tissue organization in the Drosophila pupal retina

Affiliations

Inter-plane feedback coordinates cell morphogenesis and maintains 3D tissue organization in the Drosophila pupal retina

Xiao Sun et al. Development. .

Abstract

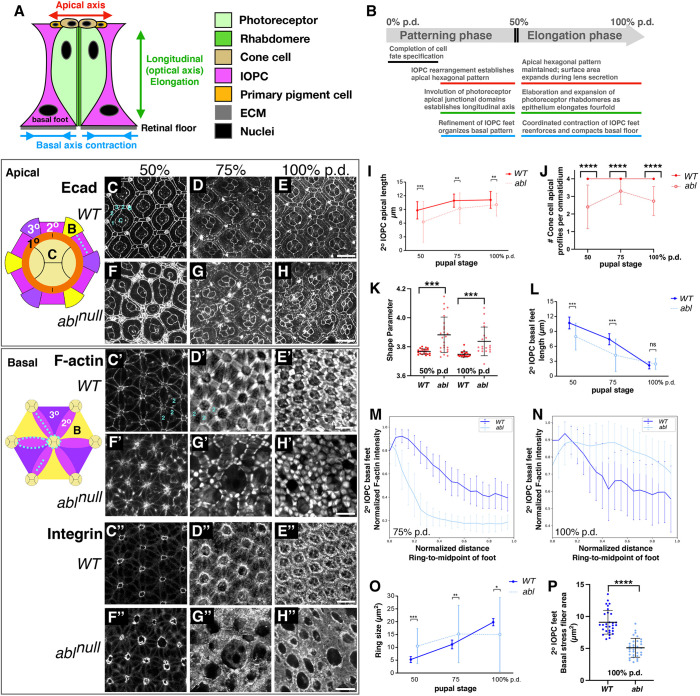
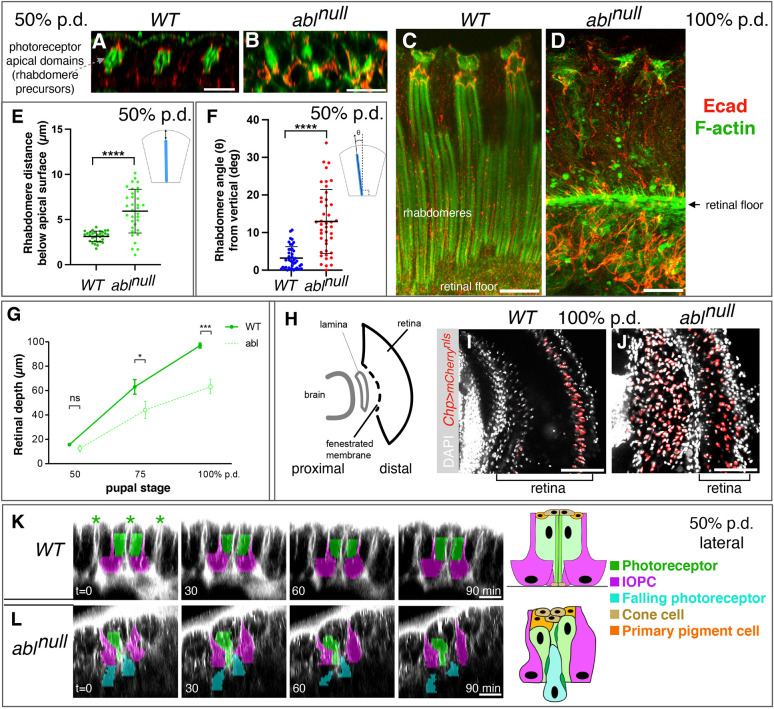
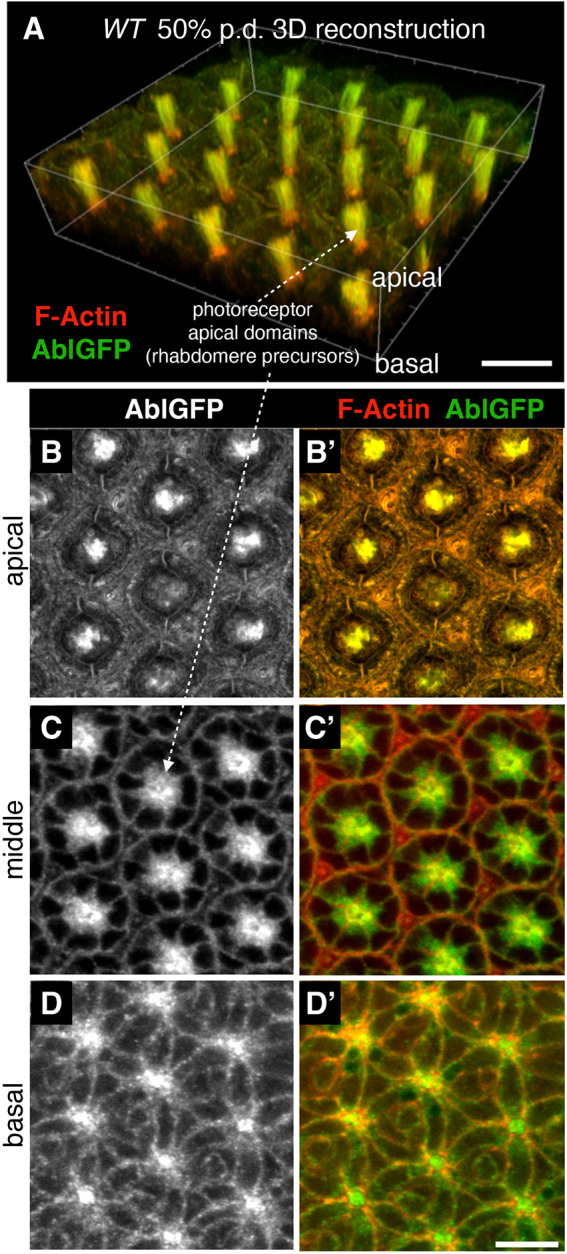
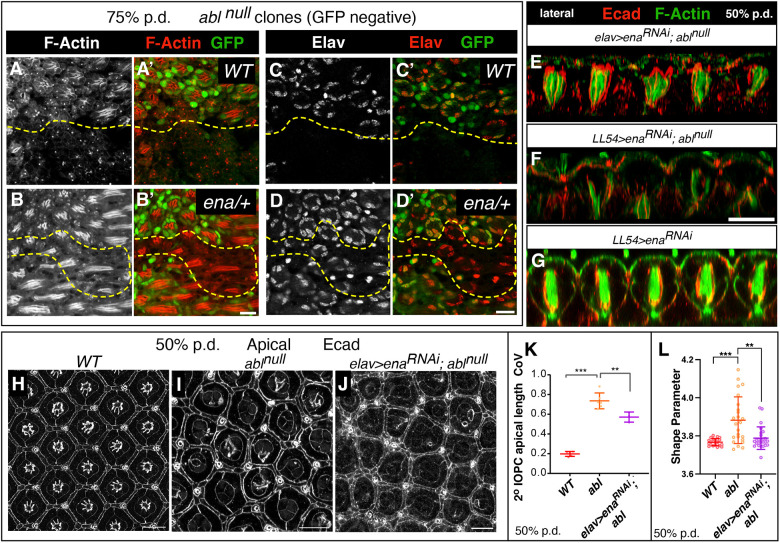
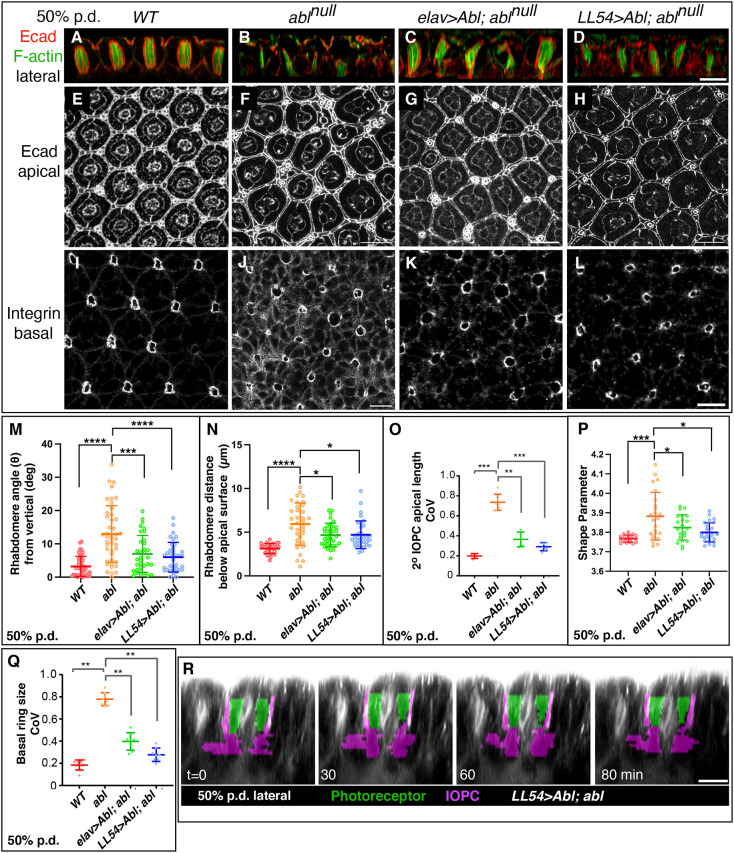
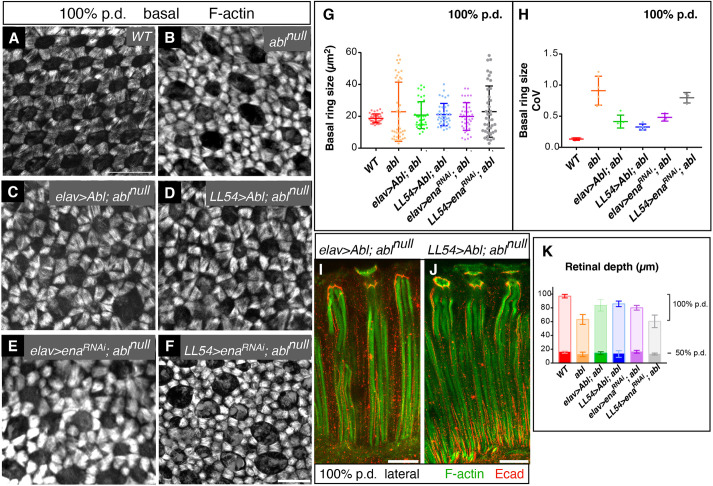
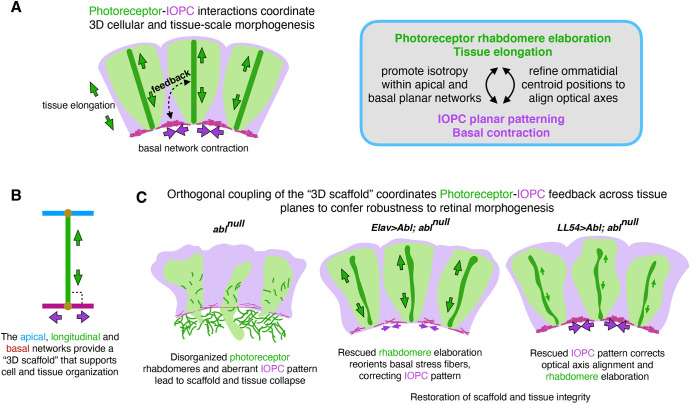
How complex organs coordinate cellular morphogenetic events to achieve three-dimensional (3D) form is a central question in development. The question is uniquely tractable in the late Drosophila pupal retina, where cells maintain stereotyped contacts as they elaborate the specialized cytoskeletal structures that pattern the apical, basal and longitudinal planes of the epithelium. In this study, we combined cell type-specific genetic manipulation of the cytoskeletal regulator Abelson (Abl) with 3D imaging to explore how the distinct cellular morphogenetic programs of photoreceptors and interommatidial pigment cells (IOPCs) organize tissue pattern to support retinal integrity. Our experiments show that photoreceptor and IOPC terminal differentiation is unexpectedly interdependent, connected by an intercellular feedback mechanism that coordinates and promotes morphogenetic change across orthogonal tissue planes to ensure correct 3D retinal pattern. We propose that genetic regulation of specialized cellular differentiation programs combined with inter-plane mechanical feedback confers spatial coordination to achieve robust 3D tissue morphogenesis.

Keywords: Drosophila eye development; 3D cytoskeletal network; Abelson; Actin cytoskeleton; Apical–basal polarity; Cell–cell interactions; Epithelial patterning; Feedback mechanism; Morphogenesis; Photoreceptor; Pigment cell.


Conflict of interest statement

Competing interests The authors declare no competing or financial interests.

Figures

Fig. 1.
Fig. 1.
Abl-mediated terminal differentiation specializes the cytoskeletal and junctional structures that pattern the apical and basal networks. (A) Schematic summarizing the cellular organization of an elongation phase ommatidium before basal contraction. Apical lens not depicted. Apical and basal cross-section schematics are shown in C-H″. (B) Timeline summarizing the sequence of key morphogenetic events that pattern the apical, longitudinal and basal planes of the pupal retinal epithelium. p.d., pupal development. (C-E) The stereotyped hexagonal pattern of the wild-type apical network. See also Fig. S1A. Blue dashed line in the schematic indicates where measurement of 2° IOPC length was taken for I. (F-H) abl loss disrupts the apical network. A different but overlapping region of the disc in F is also shown in Fig. S5G, with the two ommatidia in the top right of the image in F visible at the bottom of the image in Fig. S5G. (C′-E′) Elaboration and contraction of the wild-type basal network. (F′-H′) abl loss disrupts the basal network. Blue dashed lines in the schematic indicate where the measurements were made for L-P. (C″-E″) Attachment points of the basal network to the central rings are reinforced by anchorage to the underlying ECM. (F″-H″) Abl loss disrupts basal network-ECM connections. In C-C″ and F-F″, for each time point and genotype, the same disc, and the same set of ommatidia, were imaged in apical versus basal planes. Scale bars: 10 µm. (I-K) Plots of 2° IOPC apical domain length (I), number of cone cell apical profiles (J) and ommatidial shape parameter (K; perimeter/square root of area) show that abl loss disrupts apical network pattern. For each time point and genotype, measurements were made in at least 30 ommatidia/retina (n≥4 retinas in I,J) and in at least 20 ommatidia/retina (n≥3 retinas in K). Data are mean±s.e.m. The wild-type and ablnull datasets in I and K were also used for Figs 4K, 4L, 5O and 5P. Measurements from a single disc from the ablnull dataset in K were also used for Fig. S5K. (L-P) Plots of 2° IOPC feet length (L), normalized F-actin intensity at 75% p.d. (M) and 100% p.d. (N), ring size (O), and stress fiber area (P) show that abl loss disrupts basal network pattern. For each time point and genotype, measurements were made in at least 30 (L,O,P) or 20 (M,N) 2° IOPC feet from at least three retinas. Data are mean±s.e.m. The 100% p.d. wild-type and ablnull datasets in O were also used for Fig. 6H and Fig. S5L (ablnull data only). The 50% p.d. wild-type and ablnull datasets in O were also used for Fig. 5Q. Measurements from a single disc each from the wild-type and ablnull datasets in O were also used for Fig. 6G. *P<0.05, **P<0.01, ***P<0.001, ****P<0.0001 (t-tests with Welch's correction).
Fig. 2.
Fig. 2.
Loss of abl disrupts the longitudinal network and results in photoreceptors ‘falling’ out of the retinal epithelium. (A-D) Lateral reconstructions of wild-type (A,C) and ablnull (B,D) retinas show the collapse of the rhabdomeres, and the associated defects in retinal elongation and integrity. Scale bars: 10 µm. (E,F) Plots show the basal collapse and misalignment of abl mutant rhabdomeres relative to wild type. For each genotype, measurements were made in at least 30 (E) or 40 (F) ommatidia from at least five retinas. Data are mean±s.e.m. The wild-type and ablnull datasets in E and F were also used for Fig. 5N and Fig. 5M, respectively. (G) Plot of retinal depth. For each time point and genotype, measurements were made in the central-most 10 ommatidia in three retinas. Data are mean±s.e.m. The 50% p.d. and 100% p.d. datasets were also used for Fig. 6K. (H) Schematic of the adult visual system. The retinal fenestrated membrane (dashed line) separates it from the underlying lamina, the distal-most ganglion of the brain optic lobe. (I,J) Comparison of photoreceptor nuclear position (red) in retinal-brain complexes. DAPI (white) marks all nuclei. Scale bars: 50 µm. (K,L) Schematics and stills from time-lapse movies (Movie 1 and 2) of 50% p.d retinas injected with CellMask (white). False color shows photoreceptors (green), fallen photoreceptors (cyan, identified by dense apical membranes and position) and secondary IOPCs (magenta) in a representative ommatidium. Scale bars: 10 µm. See also Fig. S2A-D. *P<0.05, ***P<0.001, ****P<0.0001 (t-test with Welch's correction).
Fig. 3.
Fig. 3.
Abl is enriched in the photoreceptor and IOPC F-actin networks. (A) 3D reconstruction showing AblmimicGFP enrichment in the F-actin-rich longitudinal network. Sections encompassing the most apical and basal planes shown in B and D were omitted for clarity. (B,B′) Apically, AblmimicGFP enrichment is strongest at the rhabdomere-cone cell anchor points in the center of each ommatidium, with lower levels detected in cone cells and IOPCs. (C,C′) A subapical plane (dashed arrow in A) shows AblmimicGFP enrichment in rhabdomeres. (D,D′) Basally, AblmimicGFP overlaps F-actin at the rhabdomere-cone cell feet anchor points and outlines the basal network of IOPC feet. Scale bars: 10 µm.
Fig. 4.
Fig. 4.
Abl uses Ena-dependent and -independent mechanisms to regulate the cytoskeleton in photoreceptors versus IOPCs. (A-D′) Subapical planes of retinas with GFP-negative ablnull (abl2) clones (boundaries marked by yellow dashed lines) show that reducing ena dose suppresses the terminal differentiation defects associated with photoreceptor ‘falling’. (E-G) Lateral plane reconstructions showing that photoreceptor-specific ena knockdown (elav>enaRNAi) (E), but not IOPC-specific knockdown (LL54>enaRNAi) (F), suppresses ablnull phenotypes. The IOPC-specific ena knockdown control is wild type in appearance (G). (H-J) Photoreceptor-specific ena knockdown improves apical network pattern. Scale bars: 10 µm. (K,L) Plots of the coefficient of variation of apical secondary IOPC length and ommatidial shape parameter (perimeter/square root of area). For each genotype, and for each data point, measurements were made in at least 30 (K) or 20 (L) ommatidia/retina, n≥4 (K) or n≥3 (L) retinas. Data are mean±s.e.m. **P<0.01, ***P<0.001 (t-test with Welch's correction). The wild-type and ablnull datasets in K and L were also used for Figs 1I, 1K, 5O and 5P. The ablnull datasets in K were also used for Fig. S5K.
Fig. 5.
Fig. 5.
Interactions between photoreceptors and IOPCs coordinate 3D retinal organization. (A-L) Lateral (A-D) apical (E-H) and basal (I-L) views highlight the sufficiency of restoring Abl function to photoreceptors or IOPCs in an otherwise ablnull retina to organize the apical, longitudinal and basal networks. Scale bars: 10 µm. (M-Q) Plots showing significant rescue of 3D pattern with either photoreceptor- or IOPC-specific restoration of Abl. For each genotype, measurements were made in at least 20 (P), 30 (N) or 40 (M) ommatidia; n≥3 (P) or n≥5 (M,N) retinas. In coefficient of variation plots (O,Q), for each genotype, and for each data point, measurements were made in at least 30 ommatidia/retina from at least four retinas. Data are mean±s.e.m. *P<0.05, **P<0.01, ***P<0.001, ****P<0.0001 (t-test with Welch's correction). The wild-type and ablnull datasets in M, N, O, P and Q were also used for Fig. 2F, Fig. 2E, Fig. 1I, Fig. 1K and Fig. 1O, respectively. Wild-type and ablnull datasets in O and P were also used for Fig. 4K and 4L, respectively. Wild-type and ablnull datasets in Q were also used for Fig. 6G,H. (R) False-colored stills from a time-lapse movie (see Movie 3) show that selective restoration of Abl to the IOPCs rescues retinal cell shapes and 3D tissue organization. Scale bar: 10 µm.
Fig. 6.
Fig. 6.
Feedback interactions coordinate photoreceptor and IOPC terminal differentiation programs to maintain tissue organization and integrity during retinal elongation. (A-F) F-actin highlights final basal network pattern. Scale bars: 10 µm (bar in A applies to A,C,E; bar in F applies to B,D,F). (G,H) Plots of basal ring size and coefficient of variation. For each genotype, and for each data point in H, measurements were made in at least 30 ommatidia/retina, n≥4 retinas; data for a single retina are plotted in G. For all genotypes, except for LL>enaRNAi, variation was significantly (****P<0.0001; t-test with Welch's correction) reduced relative to abl null. Data are mean±s.e.m. The wild-type and ablnull datasets in G and H were also used for Fig. 1O and Fig. 5Q, respectively. (I,J) Lateral views highlight the sufficiency of IOPC-specific expression of Abl to non-autonomously induce active remodeling of photoreceptor rhabdomeres and tissue elongation in an otherwise ablnull retina. Scale bars: 10 µm. (K) Plot showing retinal depth at 50% (dark-colored bars) and 100% (light-colored bars) p.d.. For each time point and genotype, measurements were made in the central-most 10 ommatidia/retina in three retinas. Data are mean±s.e.m. The wild-type and ablnull datasets in K were also used for Fig. 2G.
Fig. 7.
Fig. 7.
Model of photoreceptor-IOPC feedback interactions. (A) Schematic depicting the spatial organization of photoreceptors and IOPCs, and the feedback between them as the retina elongates and contracts basally. (B) Conceptualization of an orthogonally coupled ‘3D scaffold’. (C) Schematics showing how the 3D scaffold could communicate and coordinate morphogenetic change in different cell types across different tissue planes.

Update of

Similar articles

Cited by

References

    1. Aigouy, B., Farhadifar, R., Staple, D. B., Sagner, A., Röper, J.-C., Jülicher, F. and Eaton, S. (2010). Cell flow reorients the axis of planar polarity in the wing epithelium of Drosophila. Cell 142, 773-786. 10.1016/j.cell.2010.07.042 - DOI - PubMed
    1. Baena-López, L. A., Baonza, A. and García-Bellido, A. (2005). The orientation of cell divisions determines the shape of Drosophila organs. Curr. Biol. 15, 1640-1644. 10.1016/j.cub.2005.07.062 - DOI - PubMed
    1. Bagnat, M., Daga, B. and Talia, S. D. (2022). Morphogenetic roles of hydrostatic pressure in animal development. Annu. Rev. Cell Dev. Bi. 38, 375-394. 10.1146/annurev-cellbio-120320-033250 - DOI - PMC - PubMed
    1. Bainbridge, S. P. and Bownes, M. (1981). Staging the metamorphosis of Drosophila melanogaster. J. Embryol. Exp. Morphol. 66, 57-80. 10.1242/dev.66.1.57 - DOI - PubMed
    1. Banerjee, S., Bainton, R. J., Mayer, N., Beckstead, R. and Bhat, M. A. (2008). Septate junctions are required for ommatidial integrity and blood–eye barrier function in Drosophila. Dev. Biol. 317, 585-599. 10.1016/j.ydbio.2008.03.007 - DOI - PMC - PubMed

Substances

LinkOut - more resources