. 2024 Jul 1;14(7):1276-1301.
doi: 10.1158/2159-8290.CD-23-0216.

Paradoxical Activation of Oncogenic Signaling as a Cancer Treatment Strategy

Affiliations

Paradoxical Activation of Oncogenic Signaling as a Cancer Treatment Strategy

Matheus Henrique Dias et al. Cancer Discov. .

Abstract

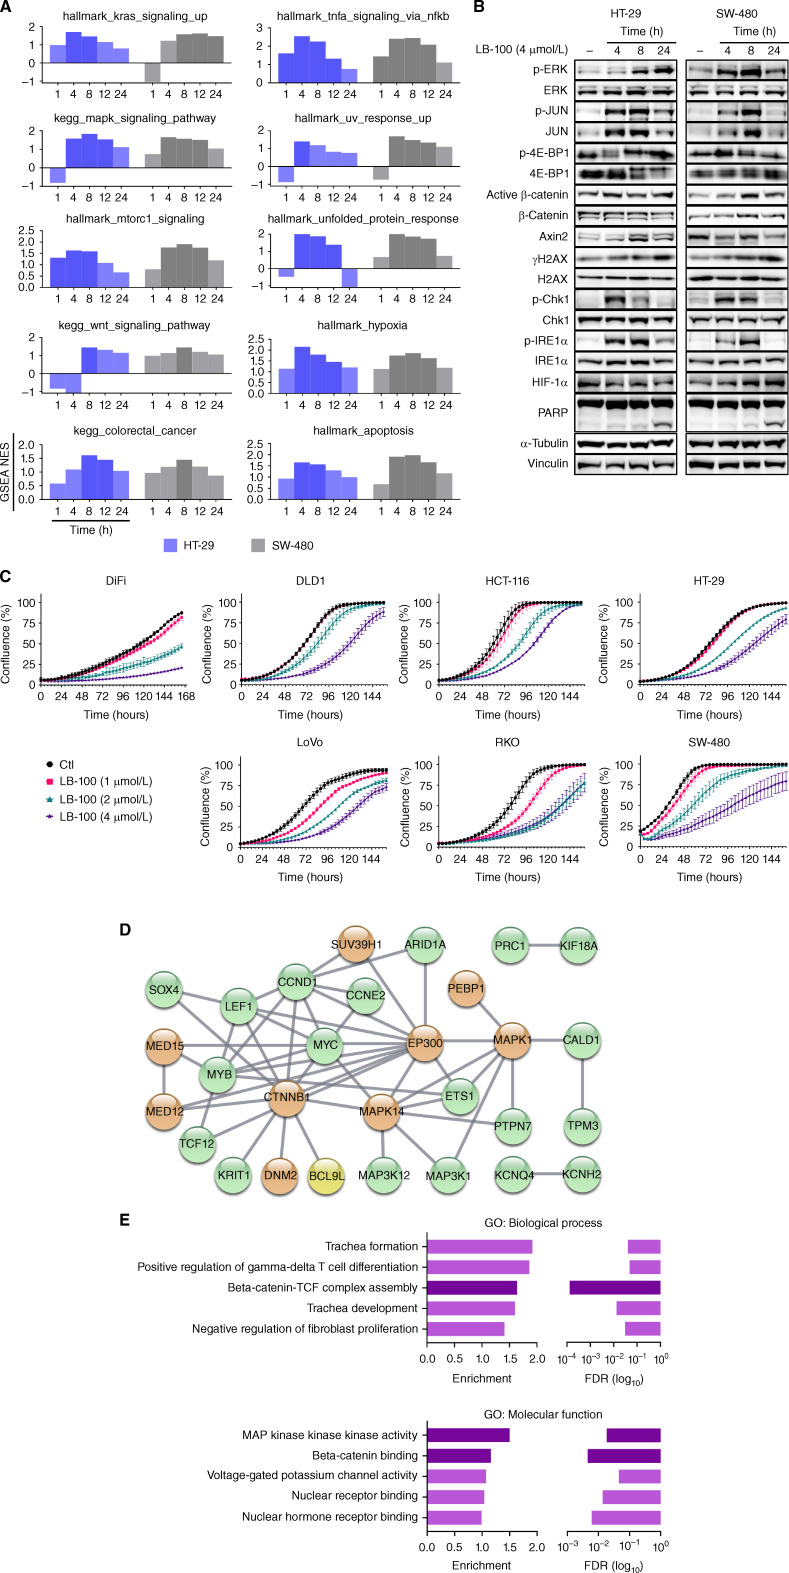
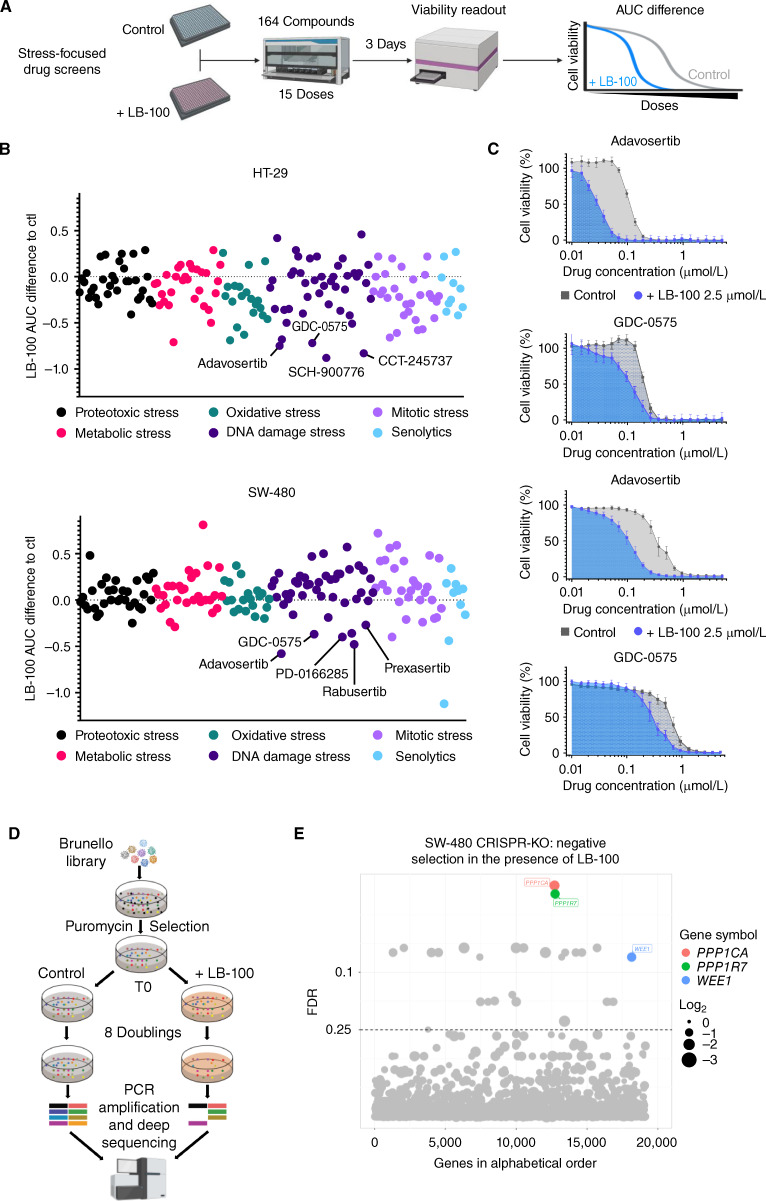
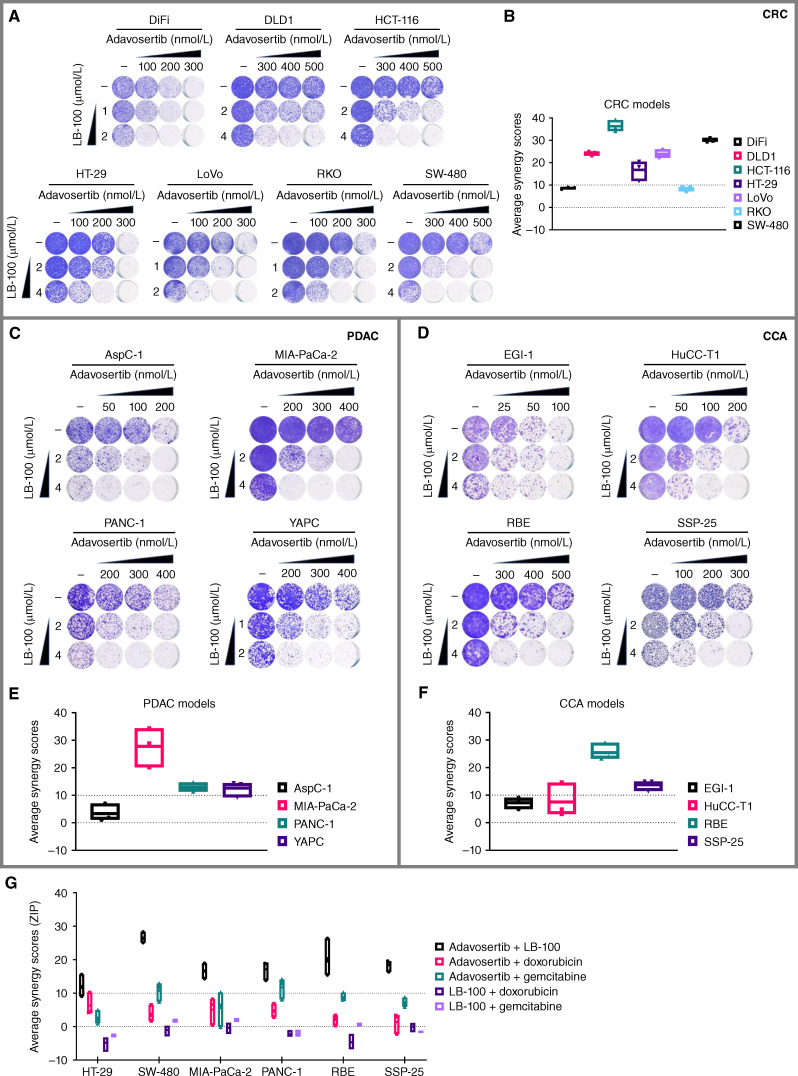
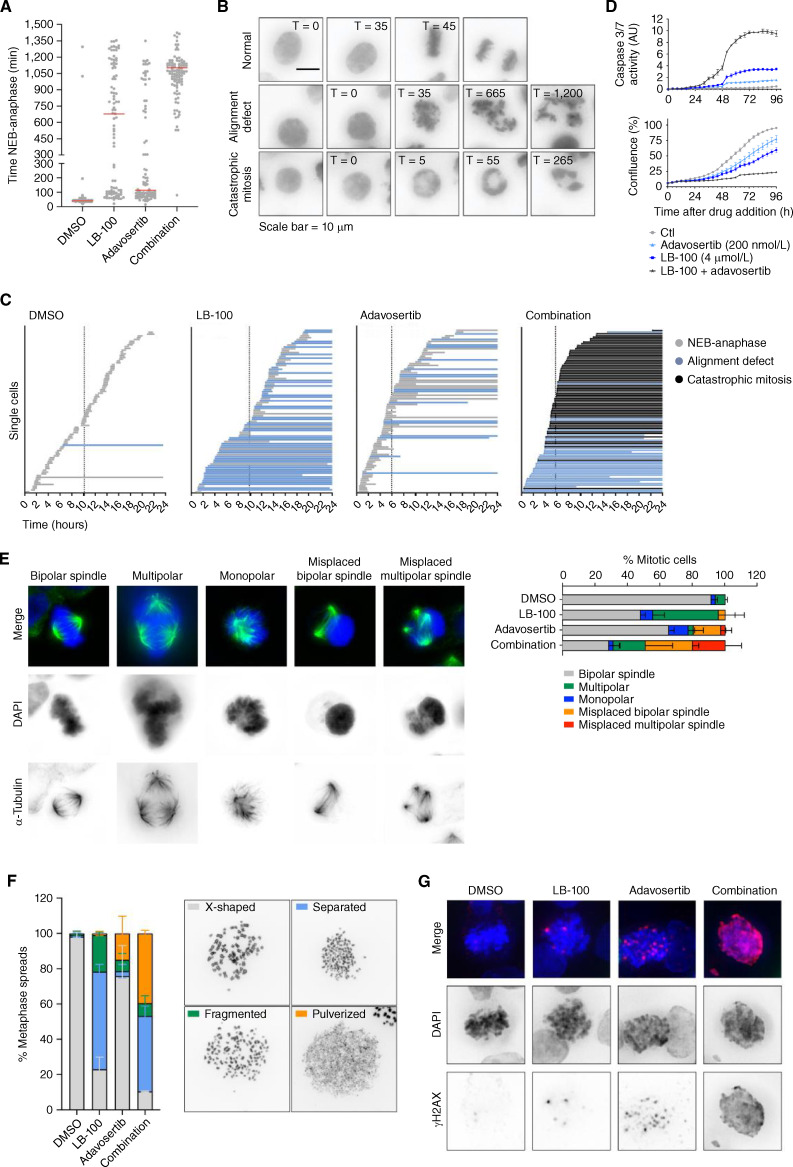
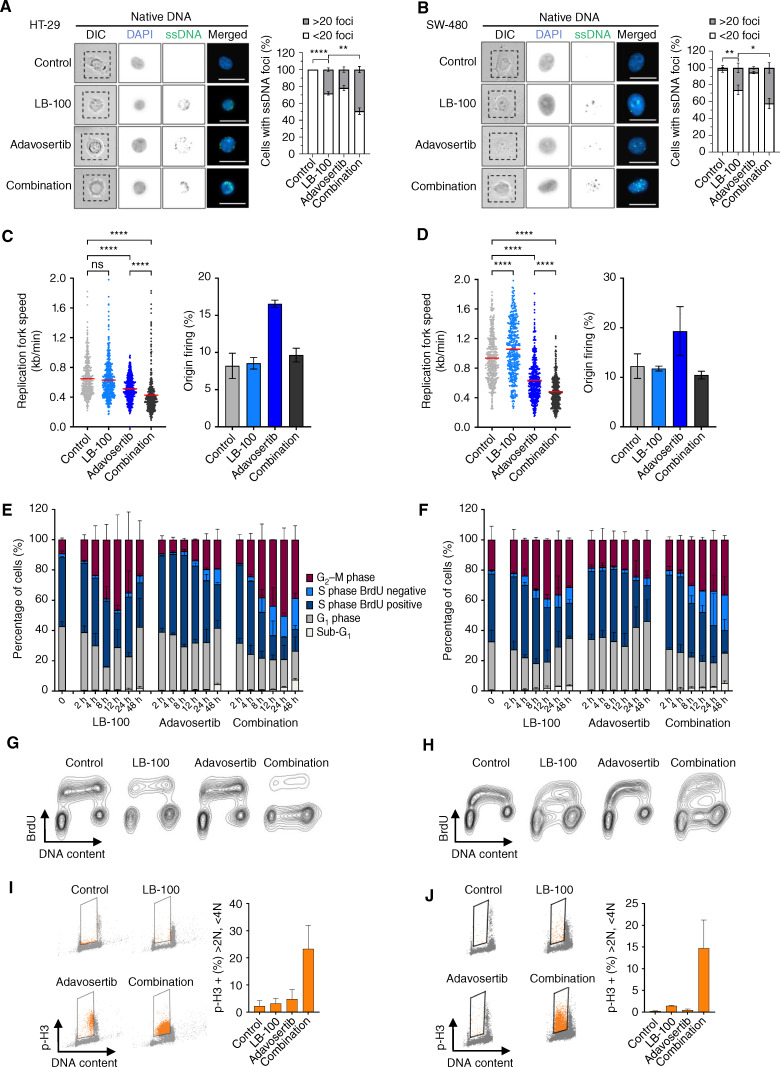
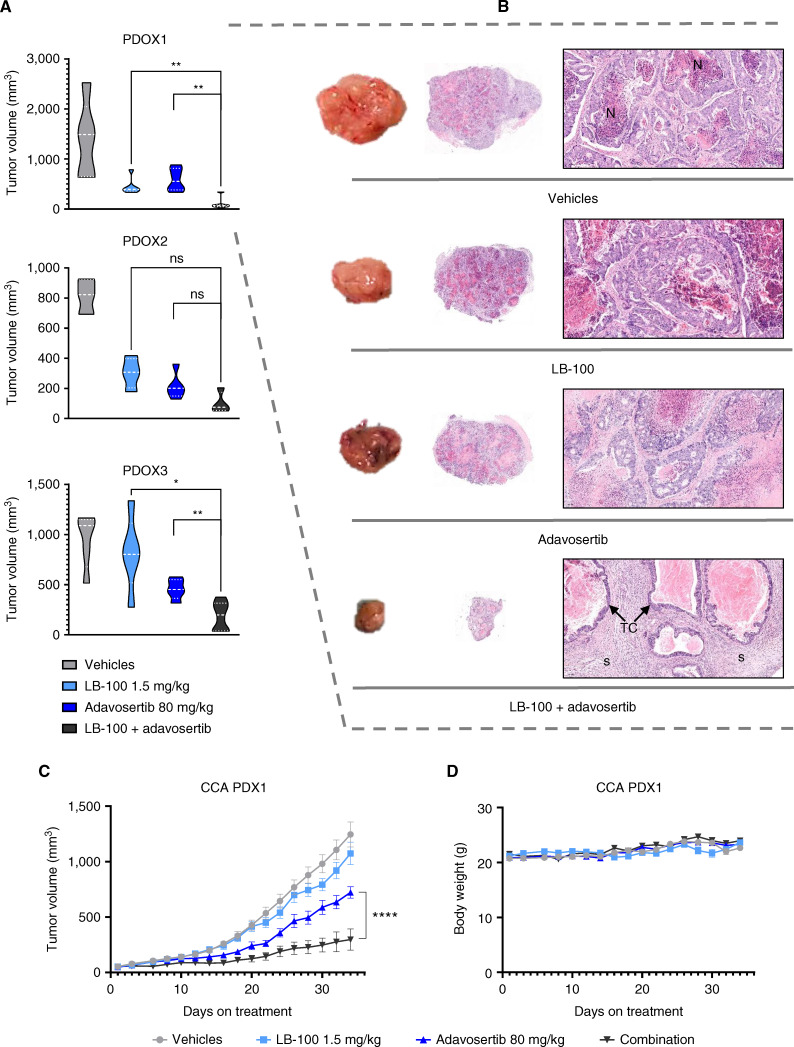
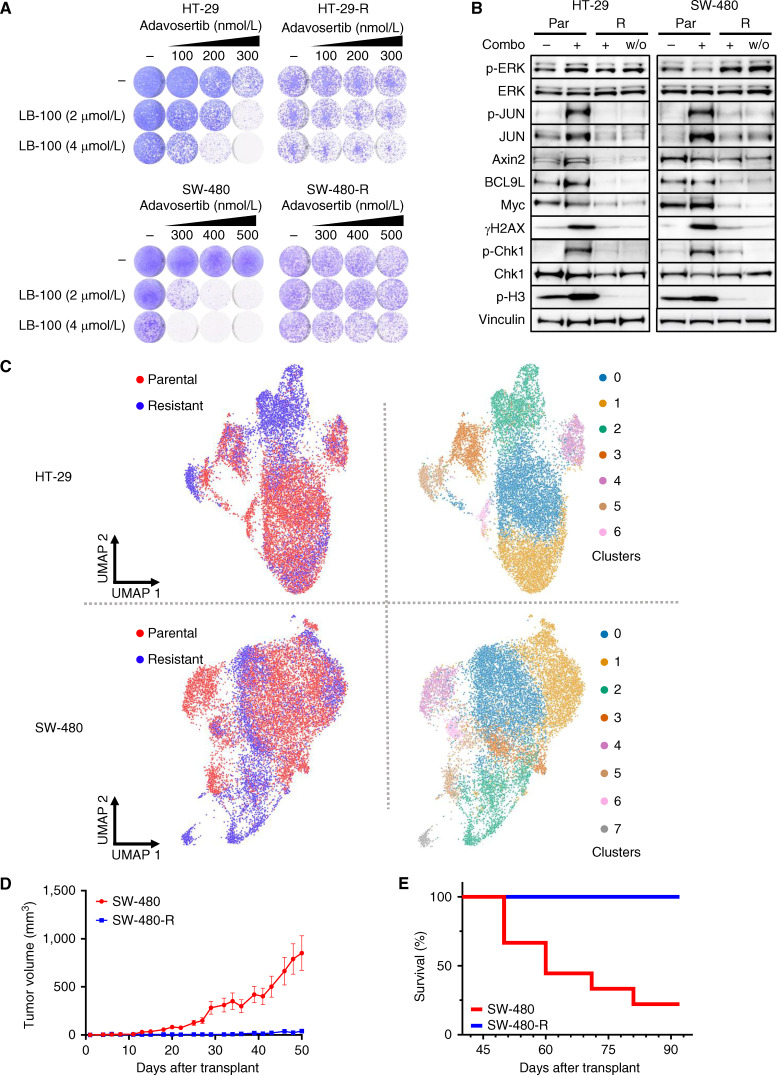
Cancer homeostasis depends on a balance between activated oncogenic pathways driving tumorigenesis and engagement of stress response programs that counteract the inherent toxicity of such aberrant signaling. Although inhibition of oncogenic signaling pathways has been explored extensively, there is increasing evidence that overactivation of the same pathways can also disrupt cancer homeostasis and cause lethality. We show here that inhibition of protein phosphatase 2A (PP2A) hyperactivates multiple oncogenic pathways and engages stress responses in colon cancer cells. Genetic and compound screens identify combined inhibition of PP2A and WEE1 as synergistic in multiple cancer models by collapsing DNA replication and triggering premature mitosis followed by cell death. This combination also suppressed the growth of patient-derived tumors in vivo. Remarkably, acquired resistance to this drug combination suppressed the ability of colon cancer cells to form tumors in vivo. Our data suggest that paradoxical activation of oncogenic signaling can result in tumor-suppressive resistance. Significance: A therapy consisting of deliberate hyperactivation of oncogenic signaling combined with perturbation of the stress responses that result from this is very effective in animal models of colon cancer. Resistance to this therapy is associated with loss of oncogenic signaling and reduced oncogenic capacity, indicative of tumor-suppressive drug resistance.


Conflict of interest statement

M.H. Dias has a patent for drug combination pending. R. Bernards reports grants from Lixte Biotechnology during the conduct of the study; personal fees from Lixte Biotechnology outside the submitted work; in addition, R. Bernards has a patent for Application pending. No disclosures were reported by the other authors.

Figures

Figure 1.
Figure 1.
LB-100 activates oncogenic signaling, engages stress response pathways, and restrains the proliferation of colorectal cancer cells. A, Gene set enrichment analyses on time-course transcriptome data from HT-29 and SW-480 cells show selected “Hallmarks” and “KEGG” molecular signatures modulated by LB-100 (4 μmol/L). Darker bars indicate time points for which the respective gene set was significantly enriched (P <0.05). B, Time-course western blots show selected oncogenic signaling and stress response pathways modulated by LB-100 (4 μmol/L) in HT-29 and SW-480 cells. α-Tubulin and Vinculin were used as loading controls. C, IncuCyte-based proliferation assays with the colorectal cancer models in the absence or presence of LB-100 at 1, 2, or 4 μmol/L for the indicated times. D, String network combining all hits identified by the two independent genome-wide CRISPR screens (Supplementary Fig. S2) as modulators of LB-100 toxicity. Only high-confidence interactions are shown and disconnected nodes are omitted. Green nodes: CRISPRa screen; orange nodes: CRISPR-KO screen; yellow node: identified on both screens. E, GO analyses using the full list of hits from both CRISPR screens (Supplementary Fig. S2) as input. The top 5 enriched Biological Processes and Molecular Functions terms are shown. Darker bars highlight WNT/β-catenin-and MAPK-related terms.
Figure 2.
Figure 2.
Stress-focused drug screen and genome-wide CRISPR screen converge to identify synthetic lethality between LB-100 and WEE1 inhibition. A, Schematic outline of the stress-focused drug screen. B, AUC difference for each compound in the presence of LB-100 (2.5 μmol/L) relative to untreated controls in HT-29 and SW-480 cells. In both cases, WEE1 and CHK1 inhibitors are annotated. C, Dose–response curves comparing the normalized AUC for adavosertib or GDC-0575 in the presence or absence of LB-100 (2.5 μmol/L) in HT-29 and SW-480 cells. Cell viability was estimated by resazurin fluorescence after 3 days in the presence of the drugs. D, Schematic outline of the CRISPR-KO screen. E, The bubble plot shows gRNAs significantly depleted in the LB-100–treated (2.5 μmol/L) arm compared with the untreated controls. Four different gRNAs per gene were tested in 3 replicates. Cells on both conditions were grown for at least 8 population doublings before DNA harvesting and sequencing. Hits were called based on a 0.25 false discovery rate (FDR) and at least 1 log2 fold-change difference between treated and untreated samples. Only the hits mentioned in the main text are named and colored, the full list of hits is presented in Supplementary Table S7.
Figure 3.
Figure 3.
The combination of LB-100 and adavosertib is synergistic in cancer cells from different tissues and diverse genetic background. A, Long-term viability assays show 7 colorectal cancer (CRC) models treated with LB-100, adavosertib, or the combination at the indicated concentrations. Cultures were refreshed every 2–3 days, and the cells were grown for 10–14 days before fixing, staining, and imaging. B, Synergy scores for the combination of LB-100 and adavosertib across 7 colorectal cancer models. Cells were treated with 5 concentrations of LB-100 (1, 2, 3, 4, and 5 μmol/L) or adavosertib (100, 200, 300, 400, and 500 nmol/L) and all respective permutations for 4 days. The percentage of cell viability for each condition was estimated by resazurin fluorescence and normalized to DMSO controls. Synergyfinder.org web tool was used to calculate the ZIP synergy scores. Three independent experiments are represented. C and D, Long-term viability assays for 4 PDAC and 4 CCA models, respectively, treated with LB-100, adavosertib, or the combination at the indicated concentrations. Cultures were refreshed every 2–3 days, and the cells were grown for 10–14 days before fixing, staining, and imaging. E and F, Synergy scores for the combination of LB-100 and adavosertib across 4 PDAC and 4 CCA models, respectively. Cells were treated with 5 concentrations of LB-100 (1, 2, 3, 4, and 5 μmol/L) or adavosertib (100, 200, 300, 400, and 500 nmol/L) and all respective permutations for 4 days. The percentage of cell viability for each condition was estimated by resazurin fluorescence and normalized by DMSO controls. Synergyfinder.org web tool was used to calculate the ZIP synergy scores. Three independent experiments are represented. G, Synergy scores for the indicated combinations of LB-100, adavosertib, doxorubicin, and gemcitabine across 6 cancer cell models. Cells were treated for 4 days with 10 concentrations of each drug: LB-100 (0.5, 1, 2, 3, 4, 5, 6, 7, 8, and 9 μmol/L); adavosertib (50, 100, 200, 300, 400, 500, 600, 700. 800, 900 nmol/L); doxorubicin (5, 10, 20, 30, 40,50, 60, 70, 80, and 90 nmol/L); gemcitabine (0.63, 1.25, 2.5, 5, 10, 20, 30, 40, 50, and 60 nmol/L); and all respective permutations for the combinations tested. The percentage of cell viability for each condition was estimated by resazurin fluorescence and normalized by DMSO controls. Synergyfinder.org web tool was used to calculate the ZIP synergy scores. Three independent experiments are represented.
Figure 4.
Figure 4.
The LB-100 and adavosertib combination leads to aberrant mitoses and cell death. A, Time from nuclear envelope breakdown (NEB) to anaphase for HT-29 cells untreated (DMSO) or treated with LB-100, adavosertib, or the combination. Each dot represents an individual cell followed by live-cell imaging. Red bars represent the average time spent from NEB to anaphase. Two independent experiments are compiled (n =100 cells per condition). B,Representative live-cell microscopy images of HT-29 cells. The examples highlight the two major mitotic phenotypes observed. The scalebar represents 10 μm. C,Representation of the time for mitotic entry and exit of HT-29 cells imaged every 5 minutes for 24 hours, starting immediately after the addition of DMSO, LB-100, adavosertib, or the combination. Each bar represents an individual cell. The colors of the bars indicate normal or aberrant mitoses. The beginning of the bars marks NEB and the end represents either anaphase or end of the experiment. Dashed vertical lines represent the average times for mitotic entry after the addition of the drugs. D,IncuCyte-based assay for caspase-3/7 activity. Cells were treated with DMSO, LB-100, adavosertib, or the combination in the presence of a caspase-3/7 apoptosis assay reagent. Green fluorescence from the apoptosis assay reagent divided by the total confluence was used to estimate apoptosis for 96 hours. E,Representative images (left) and quantification (right) of spindle defects in mitotic cells treated with DMSO, LB-100, adavosertib, or the combination. Cells were treated for 8 hours before fixation. DNA was stained with DAPI (blue) and α-Tubulin was immunostained (green). Quantification is based on 2 independent experiments each analyzing 50 cells per condition. F,Chromosome spreads from HT-29 cells treated with DMSO, LB-100, adavosertib, or the combination. On the left, quantification of chromosome integrity; on the right, are representative images. Drugs were added for 16 hours and then nocodazole was added for an additional hours to block cells in mitosis. Cells were harvested by mitotic shake-off for spreading.G,Representative images show HT-29 cells treated with DMSO, LB-100, adavosertib, or the combination for 24 hours. After fixation, total DNA was stained with DAPI (blue) and γ-H2AX was immunostained (red). Throughout the figure, LB-100 was used at 4 μmol/L and adavosertib at 200 nmol/L.
Figure 5.
Figure 5.
LB-100 and adavosertib promote concerted replication stress, priming for premature mitoses. Representative images and quantifications of single-strand DNA ssDNA foci in HT-29 (A) and SW-480 (B) cells. After incorporating BrdUrd for 48 hours, the cells were treated as indicated for 8 hours and then fixed. Total DNA was stained with DAPI (blue) and BrdUrd was immunostained (green) under non-denaturing conditions to indicate long fragments of ssDNA. Quantification is based on 2 independent experiments analyzing at least 100 cells per coverslip. Asterisks indicate significance level (*, P < 0.05; **, P < 0.01; ****, P < 0.0001) by two-tailed unpaired t test. C and D, DNA fiber assays show replication fork speed (left) and percentage of origin firing (right) of HT-29 and SW-480 cells, respectively, untreated (DMSO) or treated with LB-100, adavosertib, or the combination for 8 hours. For fork speed, track lengths of at least 380 ongoing forks from each condition were measured with ImageJ in 2 independent experiments that are shown combined. Red lines indicate the mean and asterisks indicate the significance level (****, P < 0.0001) by the nonparametric Kruskal–Wallis test. For origin firing, first-label and second-label origins are shown as a percentage of all labeled tracks. At least 1,000 labeled tracks per condition were analyzed. E and F, Quantification of time-course cell-cycle flow cytometry from HT-29 and SW-480 cells, respectively, treated with LB-100, adavosertib, or the combination. Cells were fixed at the indicated time points after the addition of the drugs. BrdUrd (10 μmol/L) was added 1 hour before fixation. Total DNA was stained by propidium iodide (PI) and BrdUrd was immunostained. Cell-cycle phases were gated using the FlowJo software. Error bars represent the standard deviation of 2 independent experiments. G and H, Representative image of the 12-hour time point from the time-course flow cytometry above. I and J, Flow cytometry assessment of p-H3 (Ser10) vs. DNA content in HT-29 and SW-480 cells, respectively, treated with LB-100, adavosertib, or the combination for 12 hours. Total DNA was stained by propidium iodide (PI) and p-H3 (Ser10) was immunostained. S-phase cells were gated using the FlowJo software. Error bars represent the standard deviation of 2 independent experiments. Throughout the figure, LB-100 was used at 4 μmol/L on both cell lines. Adavosertib was used at 200 nmol/L in HT-29 and 400 nmol/L in SW-480.
Figure 6.
Figure 6.
The LB-100 and adavosertib combination restrains tumor growth in vivo. A, Endpoint tumor volumes of 3 independent orthotopic colorectal cancer PDXs treated with LB-100, adavosertib, or the combination for 4 weeks. After transplantation and engraftment, the mice were randomized and treated as indicated. LB-100 was given on days 1, 3, and 5, whereas adavosertib was administered on days 1–5 in 7-day cycles. Asterisks indicate significance level (*, P <0.05; **, P<0.01) by two-tailed Mann–Whitney test. B,Representative tumors and hematoxylin and eosin stainings at endpoint from PDOX1 treated as indicated. Original magnification middle images: 15×, scale bar, 1,000 μm; right images: 200×. Nindicates necrotic areas, S indicates stroma, and the arrows point to the tumor-cell component. C,Tumor growth curves of cholangiocarcinoma PDX1 treated with LB-100, adavosertib, or the combination. After transplantation and engraftment, the mice were randomized and treated as indicated. LB-100 was given on day 1, adavosertib was given on days 1–3, in 4-day cycles. Tumors were measured 3 times per week. Graphs, mean and SEM. Asterisks indicate significance level (****, P<0.0001) by two-way ANOVA with Tukey multiple comparisons. D,Body weight variation of the CCA PDX1 across the experiment. Graphs, mean and SEM; PDOX, patient-derived orthotopic xenograft.
Figure 7.
Figure 7.
Acquired resistance to the combination of LB-100 and adavosertib is tumor-suppressive. A, Long-term viability assays show HT-29 and SW-480 parental and resistant cells treated with LB-100, adavosertib, or the combination at the indicated concentrations. Cultures were refreshed every 2–3 days, and the cells were grown for 10–14 days before fixing, staining, and imaging. B, Western blots show selected oncogenic signaling and stress response pathways in HT-29 and SW-480 parental and resistant cells. Parental cells were exposed to the combination for 24 hours, whereas for resistant cells, that grow in the presence of the combination, the drugs were washed out (w/o) 24 hours before harvesting. LB-100 was used at 4 μmol/L and adavosertib was used at 400 nmol/L. Vinculin was used as a loading control. C, UMAP representations of HT-29 (top) and SW-480 (bottom) parental and resistant cells colored by a sample of origin (left) or by clusters (right). Parental cells were harvested untreated and resistant cells were harvested 24 hours after the washout of the drugs. D, Tumor growth curves of SW-480 parental and resistant cells in the absence of drugs. Per cell line, 10 mice were injected subcutaneously with 3 million cells and we measured tumor size 3 times per week. Graph, mean and SEM of the measurements until the first mouse reached 1,500 mm3 (ethical sacrifice). E, Kaplan–Meier survival curves of the experiment above along 3 months considering the 1,500 mm3 ethical sacrifice.

References

    1. Hanahan D, Weinberg RA. The hallmarks of cancer. Cell 2000;100: 57–70. - PubMed
    1. Pagliarini R, Shao W, Sellers WR. Oncogene addiction: pathways of therapeutic response, resistance, and road maps toward a cure. EMBO Rep 2015;16:280–96. - PMC - PubMed
    1. Groenendijk FH, Bernards R. Drug resistance to targeted therapies: déjà vu all over again Mol Oncol 2014;8:1067–83. - PMC - PubMed
    1. Ito T, Young MJ, Li R, Jain S, Wernitznig A, Krill-Burger JM, et al. . Paralog knockout profiling identifies DUSP4 and DUSP6 as a digenic dependence in MAPK pathway-driven cancers. Nat Genet 2021;53:1664–72. - PubMed
    1. Chan LN, Murakami MA, Robinson ME, Caeser R, Sadras T, Lee J, et al. . Signalling input from divergent pathways subverts B cell transformation. Nature 2020;583:845–51. - PMC - PubMed

MeSH terms