

Enhanced transport of bacteria along root systems by protists can impact plant health
- PMID: 38534145
- PMCID: PMC11022564
- DOI: 10.1128/aem.02011-23
Enhanced transport of bacteria along root systems by protists can impact plant health
Abstract
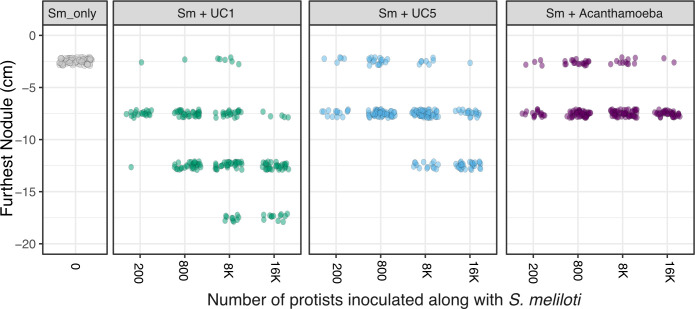
Soil protists have been shown to contribute to the structure and function of the rhizosphere in a variety of ways. Protists are key contributors to nutrient cycling through the microbial loop, where biomass is digested by protists and otherwise stored nutrients are returned to the environment. Protists have also been shown to feed on plant pathogenic bacteria and alter root microbiomes in ways that may benefit plants. Recently, a mechanism involving bacterial transport, facilitated by protists, has been hypothesized to contribute to the spatial distribution of bacteria in the rhizosphere. Here, we observe the differential abilities of three soil protists: a ciliate (Colpoda sp.), a flagellate (Cercomonas sp.), and a naked amoeba (Acanthamoeba castellanii) to transport nitrogen-fixing Sinorhizobium meliloti to infectible root tips. Co-inoculation of protists plus S. meliloti resulted in the movement of bacteria, as measured by the presence of nitrogen-fixing nodules, up to 15 cm farther down the root systems when compared to plants inoculated with S. meliloti alone. Co-inoculation of the ciliate, Colpoda sp., with S. meliloti, resulted in shoot weights that were similar to plants that grew in nitrogen-replete potting mix. Colpoda sp.-feeding style and motility likely contributed to their success at transporting bacteria through the rhizosphere. We observed that the addition of protists alone without the co-inoculum of S. meliloti resulted in plants with larger shoot weights than control plants. Follow-up experiments showed that protists plus their associated microbiomes were aiding in plant health, likely through means of nutrient cycling.IMPORTANCEProtists represent a significant portion of the rhizosphere microbiome and have been shown to contribute to plant health, yet they are understudied compared to their bacterial and fungal counterparts. This study elucidates their role in the rhizosphere community and suggests a mechanism by which protists can be used to move bacteria along plant roots. We found that the co-inoculation of protists with nitrogen-fixing beneficial bacteria, Sinorhizobium meliloti, resulted in nodules farther down the roots when compared to plants inoculated with S. meliloti alone, and shoot weights similar to plants that received nitrogen fertilizer. These data illustrate the ability of protists to transport viable bacteria to uninhabited regions of the root system.
Keywords: beneficial bacteria; protist; rhizosphere; transport.
Conflict of interest statement
Patent no. 9,603,368 to J.L.M., L.M.S., and D.J.G., "Microbial Carriers for Targeted Delivery of Agricultural Payloads," is related to this work.
Figures


Similar articles
-
Rhizosphere-colonizing bacteria persist in the protist microbiome.mSphere. 2025 May 27;10(5):e0003725. doi: 10.1128/msphere.00037-25. Epub 2025 Apr 30. mSphere. 2025. PMID: 40304530 Free PMC article.
-
Soil Protists Can Actively Redistribute Beneficial Bacteria along Medicago truncatula Roots.Appl Environ Microbiol. 2023 Mar 29;89(3):e0181922. doi: 10.1128/aem.01819-22. Epub 2023 Mar 6. Appl Environ Microbiol. 2023. PMID: 36877040 Free PMC article.
-
Identity and timing of protist inoculation affect plant performance largely irrespective of changes in the rhizosphere microbial community.Appl Environ Microbiol. 2025 Apr 23;91(4):e0024025. doi: 10.1128/aem.00240-25. Epub 2025 Mar 31. Appl Environ Microbiol. 2025. PMID: 40162835 Free PMC article.
-
Protists: Puppet Masters of the Rhizosphere Microbiome.Trends Plant Sci. 2019 Feb;24(2):165-176. doi: 10.1016/j.tplants.2018.10.011. Epub 2018 Nov 13. Trends Plant Sci. 2019. PMID: 30446306 Review.
-
Soil infiltration mechanisms under plant root disturbance in arid and semi-arid grasslands and the response of solute transport in rhizosphere soil.Sci Total Environ. 2024 Dec 20;957:177633. doi: 10.1016/j.scitotenv.2024.177633. Epub 2024 Dec 2. Sci Total Environ. 2024. PMID: 39579890 Review.
Cited by
-
Effects of Geosmin on the Behavior of Soil Protists.Microb Ecol. 2025 Mar 14;88(1):14. doi: 10.1007/s00248-025-02510-7. Microb Ecol. 2025. PMID: 40085287 Free PMC article.
-
Rhizosphere-colonizing bacteria persist in the protist microbiome.mSphere. 2025 May 27;10(5):e0003725. doi: 10.1128/msphere.00037-25. Epub 2025 Apr 30. mSphere. 2025. PMID: 40304530 Free PMC article.
-
Microbial drivers of root plasticity.New Phytol. 2025 Oct;248(1):52-67. doi: 10.1111/nph.70371. Epub 2025 Jul 21. New Phytol. 2025. PMID: 40686438 Free PMC article. Review.
References
-
- Ardley J, Sprent J. 2021. Evolution and biogeography of actinorhizal plants and legumes: a comparison. J Ecol 109:1098–1121. doi:10.1111/1365-2745.13600 - DOI
-
- Wilkinson DM, Creevy A, Valentine J. 2012. The past, present and future of soil protist ecology introduction to special issue. Acta Protozool 51:189–199. doi:10.4467/16890027AP.12.015.0761 - DOI
-
- Erktan A, Or D, Scheu S. 2020. The physical structure of soil: determinant and consequence of trophic interactions. Soil Biol Biochem 148:107876. doi:10.1016/j.soilbio.2020.107876 - DOI
Publication types
MeSH terms
Substances
Grants and funding
LinkOut - more resources
Full Text Sources
