. 2024 Feb 26;14(3):123.
doi: 10.3390/bios14030123.

Competitive Immunoassay in a Microfluidic Biochip for In-Field Detection of Abscisic Acid in Grapes

Affiliations

Competitive Immunoassay in a Microfluidic Biochip for In-Field Detection of Abscisic Acid in Grapes

Cristiana Domingues et al. Biosensors (Basel). .

Abstract

Viticulture and associated products are an important part of the economy in many countries. However, biotic and abiotic stresses impact negatively the production of grapes and wine. Climate change is in many aspects increasing both these stresses. Routine sample retrievals and analysis tend to be time-consuming and require expensive equipment and skilled personnel to operate. These challenges could be overcome through the development of a miniaturized analytic device for early detection of grapevine stresses in the field. Abscisic acid is involved in several plant processes, including the onset of fruit ripening and tolerance mechanisms against drought stress. This hormone can be detected through a competitive immunoassay and is found in plants in concentrations up to 10-1 mg/mL. A microfluidic platform is developed in this work which can detect a minimum of 10-11 mg/mL of abscisic acid in buffer. Grape samples were tested using the microfluidic system alongside benchmark techniques such as high-performance liquid chromatography. The microfluidic system could detect the increase to 10-5 mg/mL of abscisic acid present in real berry samples at the veraison stage of ripening.

Keywords: abscisic acid; agriculture; biosensing; competitive immunoassay; microfluidics.


Conflict of interest statement

The authors declare no conflict of interest.

Figures
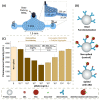
Figure 1
Figure 1
Competitive Immunoassay for ABA detection: (A) schematic of the microfluidic structures, packed with protein A microbeads for the detection of ABA; (B) schematic of the competitive fluorescence immunoassay: bead functionalization (the anti-ABA antibody is bound to the bead through the constant zone of the anti-ABA antibody, leaving the binding site available for binding to the target); control, non ABA-spiked assay (only the labelled ABA-BSA conjugate is present in the system, so only this ABA-BSA conjugate will bind to the anti-ABA antibody, resulting in the maximum signal in the absence of competition for the anti-ABA antibody sites); and ABA-spiked assay (both the labelled ABA-BSA conjugate and the free analyte are present in the system, so both will compete for the anti-ABA antibody binding sites: the higher the ABA concentration, the lower the fluorescence); (C) fluorescence response curve for different target ABA concentrations, ranging from 10−11 mg/mL to 10−1 mg/mL (n = 4). The excitation wavelength was 450–490 nm (blue). The error bars represent the ± standard deviation.
Figure 2
Figure 2
Sample treatment protocol and calibration curves for red and white treated table grapes: (A) overview of the steps carried out in the sample treatment: maceration of the sample; centrifugation (2000 rpm, 10 min); filtration (pore diameter: 0.2 µm); and bead cleaning step in a microfluidic channel (the columns used were 1 cm long, with a width of 0.1 cm, and a height of 100 µm, and, additionally, they had a smaller channel with 200 µm of width and a height of 20 µm designed to trap beads with diameters superior to 20 µm); (B) ABA detection competitive immunoassay performed in ABA-spiked and treated table grape samples, with ABA concentrations ranging from 10−6 at 10−2 mg/mL (n = 2). The excitation wavelength was 450–490 nm (blue). The error bars represent the ± standard deviation.
Figure 3
Figure 3
ABA detection method validation in real grape samples. The three tested samples, dark, intermediate, and green grapes, were selected from a grape bunch undergoing the veraison stage: (A) ABA concentration obtained from HPLC, where the peak area is directly proportional to the ABA concentration for each the tested samples; (B) ABA concentration obtained using microfluidic competitive immunoassay for ABA detection after the sample processing step; (C) microfluidic ABA detection competitive immunoassay performed in 10× diluted validation samples. The fluorescence intensity value of non-ABA spiked assay (table grape sample) was taken from Figure 2B, by averaging the fluorescence intensity of the non-ABA spiked of the treated red grapes with the fluorescence intensity non-ABA spiked of the treated white grapes. The error bars represent the ± standard deviation.

References

    1. Causas Das Alterações Climáticas. [(accessed on 9 November 2023)]. Available online: https://climate.ec.europa.eu/climate-change/causes-climate-change_pt.
    1. Lo Presti D., Di Tocco J., Massaroni C., Cimini S., De Gara L., Singh S., Raucci A., Manganiello G., Woo S.L., Schena E., et al. Current understanding, challenges and perspective on portable systems applied to plant monitoring and precision agriculture. Biosens. Bioelectron. 2023;222:115005. doi: 10.1016/j.bios.2022.115005. - DOI - PubMed
    1. OIV 2019 Statistical Report on World Vitiviniculture. [(accessed on 30 July 2023)]. Available online: https://www.oiv.int/public/medias/6782/oiv-2019-statistical-report-on-wo....
    1. Li J., Li C., Smith S.M. Hormone Metabolism and Signaling in Plants. Acdemic Press; Cambridge, MA, USA: 2017.
    1. Pieterse C.M.J., Leon-Reyes A., Van Der Ent S., Van Wees S.C.M. Networking by small-molecule hormones in plant immunity. Nat. Chem. Biol. 2009;5:308–316. doi: 10.1038/nchembio.164. - DOI - PubMed

LinkOut - more resources