Review
. 2024 Mar 2;14(3):130.
doi: 10.3390/bios14030130.

Plasmonic Fluorescence Sensors in Diagnosis of Infectious Diseases

Affiliations
Review

Plasmonic Fluorescence Sensors in Diagnosis of Infectious Diseases

Juiena Hasan et al. Biosensors (Basel). .

Abstract

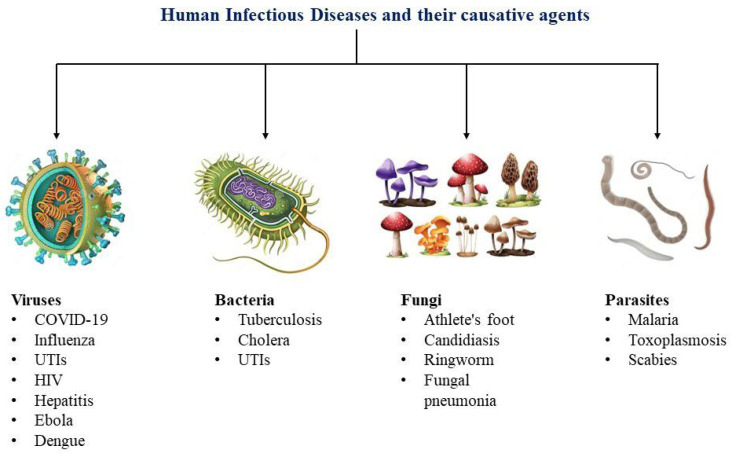
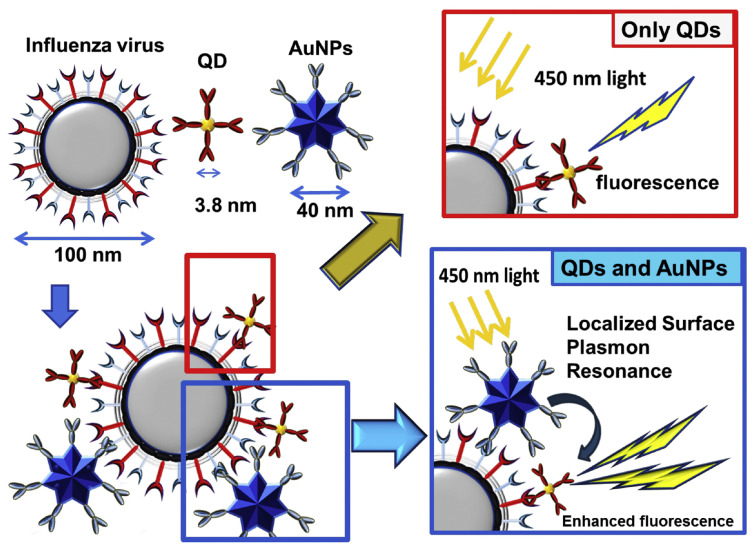
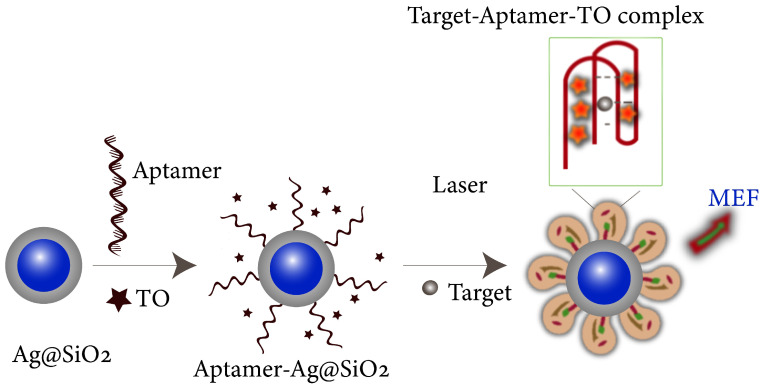
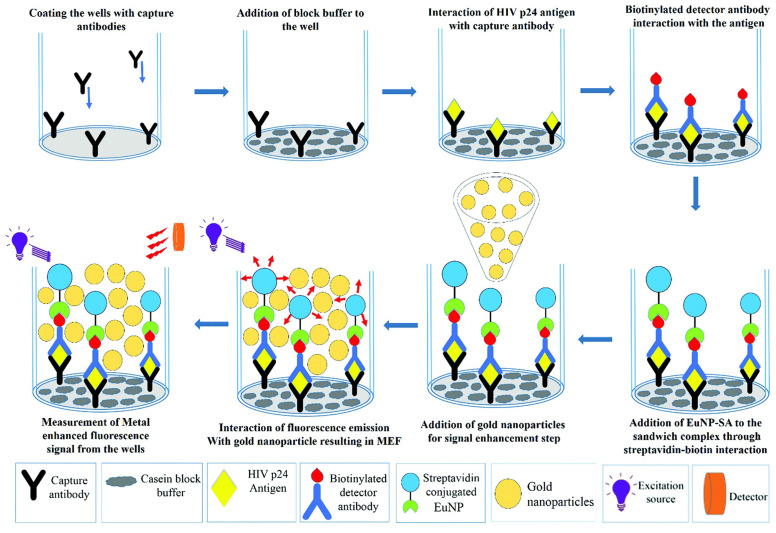
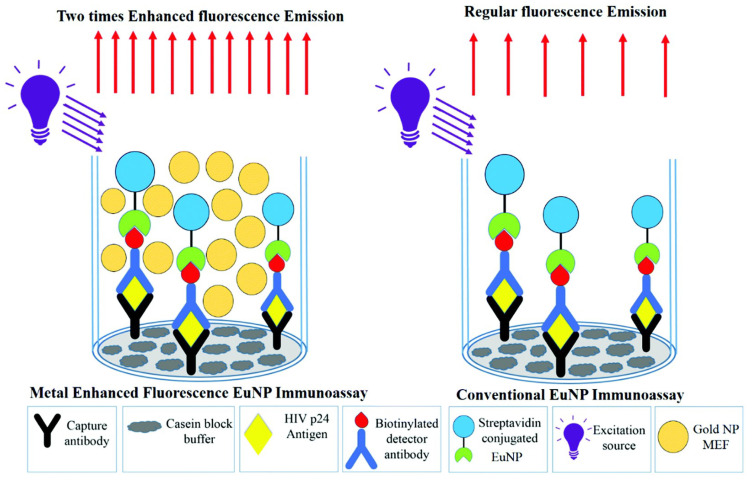
The increasing demand for rapid, cost-effective, and reliable diagnostic tools in personalized and point-of-care medicine is driving scientists to enhance existing technology platforms and develop new methods for detecting and measuring clinically significant biomarkers. Humanity is confronted with growing risks from emerging and recurring infectious diseases, including the influenza virus, dengue virus (DENV), human immunodeficiency virus (HIV), Ebola virus, tuberculosis, cholera, and, most notably, SARS coronavirus-2 (SARS-CoV-2; COVID-19), among others. Timely diagnosis of infections and effective disease control have always been of paramount importance. Plasmonic-based biosensing holds the potential to address the threat posed by infectious diseases by enabling prompt disease monitoring. In recent years, numerous plasmonic platforms have risen to the challenge of offering on-site strategies to complement traditional diagnostic methods like polymerase chain reaction (PCR) and enzyme-linked immunosorbent assays (ELISA). Disease detection can be accomplished through the utilization of diverse plasmonic phenomena, such as propagating surface plasmon resonance (SPR), localized SPR (LSPR), surface-enhanced Raman scattering (SERS), surface-enhanced fluorescence (SEF), surface-enhanced infrared absorption spectroscopy, and plasmonic fluorescence sensors. This review focuses on diagnostic methods employing plasmonic fluorescence sensors, highlighting their pivotal role in swift disease detection with remarkable sensitivity. It underscores the necessity for continued research to expand the scope and capabilities of plasmonic fluorescence sensors in the field of diagnostics.

Keywords: LSPR; SPR; biosensors; fluorescence; infectious disease; plasmonics.


Conflict of interest statement

The authors declare no conflicts of interest.

Figures

Figure 1
Figure 1
Human infectious diseases and their causative agents.
Figure 2
Figure 2
Schematic of the ordered GNR array chip for DNA detection via surface plasmon-enhanced fluorescence upon hybridization. Reprinted (adapted) from [176], Copyright (2017), with permission from American Chemical Society.
Figure 3
Figure 3
Three-dimensional (3D) gold nanohole-disc arrays (Au-NHDAs). Reprinted from ref. [182], Copyright (2019), American Chemical Society.
Figure 4
Figure 4
Surface and localized surface plasmon resonances. (a) On a 2D surface, electron oscillations create surface plasmon polaritons (SPPs) that couple with an electromagnetic field, propagating with reduced amplitude away from the interface. (c) SPPs are excited at specific wave vectors, leading to a field that decays exponentially from the surface. SPP resonance (e) is restricted to specific incident angles due to momentum matching. (b) LSPR arises when the metal nanoparticle is smaller than the incident wavelength, resulting in synchronized electron oscillations that lead to significant absorption, scattering capabilities and an intensified local electromagnetic field. In the case of small particles (less than 15 nm), (d) absorption is the predominant effect with a substantial absorption cross-section. Conversely, for larger nanoparticles (greater than 15 nm), (f) scattering becomes the dominant factor. Reproduced from ref. [168], Copyright (2015), with permission from the Royal Society of Chemistry.
Figure 5
Figure 5
Schematic illustration of the detection mechanism of influenza virus using the LSPR-induced fluorescence nanobiosensor. Reprinted from ref. [255], Copyright (2016), with permission from Elsevier.
Figure 6
Figure 6
A schematic representation showing the preparation of the aptamer-Ag@SiO2 sensor and the process for detecting the rHA protein of H5N1. Reproduced from ref. [256], Copyright (2016), with permission from Elsevier.
Figure 7
Figure 7
A schematic representation of the process involved in MEF based ENIA. Reprinted from ref. [259] under a CC-BY-NC 3.0 license, Copyright (2019), with permission from the Royal Society of Chemistry. Disclaimer: The licensor does not endorse you or your use. For the full license, please visit (accessed on 22 September 2023) https://creativecommons.org/licenses/by-nc/3.0/.
Figure 8
Figure 8
A schematic illustrating the contrast in fluorescence emissions between the conventional immunoassay and the MEF based ENIA. Reprinted from ref. [259] under a (CC-BY-NC) 3.0 license, Copyright (2019), with permission from the Royal Society of Chemistry. Disclaimer: The licensor does not endorse you or your use. For the full license, please visit (accessed on 21 September 2023) https://creativecommons.org/licenses/by-nc/3.0/.
Figure 9
Figure 9
(a) Target DNA sequences are exposed to the microarray, where capture probes are immobilized. (b) The functionalized AgNPs (Tag-A and Tag-B) are introduced to the microarray and form hybrids with the adjacent regions of the target DNA sequences. (c) The formation of AgNP aggregates is triggered by the hybridization process. Reprinted from ref. [260], Copyright (2019), with permission from Elsevier.
Figure 10
Figure 10
Illustrations showing a biosensor using plasmon-enhanced fluorescence spectroscopy, featuring an in-depth view of the sensor chip containing a binding matrix composed of poly(HPMA-co-CBMAA). Reprinted from ref. [261] under a (CC-BY) 4.0 International license, Copyright (2022), American Chemical Society. Disclaimer: The licensor does not endorse you or your use. For the full license, please visit (accessed on 15 November 2023) https://creativecommons.org/licenses/by-nc/4.0/.
Figure 11
Figure 11
Impact of HBV-antibody (Ab) on the formation of the immunosensor: (a) measuring experiment and (b) Control experiment. Reprinted from ref. [262], Copyright (2019), American Chemical Society.
Figure 12
Figure 12
Nanostructures and fluorescence sensing techniques for the EBOV sensor. (a) Nanoantenna array illustration. (b) Detailed view highlighting the features of individual nanopillar structures and an example of an on-chip EBOV sandwich assay configuration. Reprinted from ref. [263], Copyright (2019), with permission from WILEY-VCH Verlag GmbH & Co. KGaA, Weinheim, Germany.
Figure 13
Figure 13
(A) Schematic representation of the distance-based LSPR effect of AuNPs on CdSeTeS QDs. (B) Schematic of four hairpin probes for sensing purposes. (C) Fluorescent characteristics of CdSeTeS QDs and CdSeTeS QDs–dsDNA–AuNP nanocomposites with DENV 1 and DENV 2. Reprinted from ref. [264] under a (CC-BY-NC) 3.0 license, Copyright (2019), with permission from the Royal Society of Chemistry. Disclaimer: The licensor does not endorse you or your use. For the full license, please visit (accessed on 15 November 2023) https://creativecommons.org/licenses/by-nc/3.0/.
Figure 14
Figure 14
(a) A photographic representation of PMSSQ gratings created on glass slides measuring 1 inch by 1 inch, and (b) an illustration outlining the FLISA setup on the gratings, demonstrating the antibody sandwich structure used for detecting LAM. Reprinted from ref. [126], Copyright (2019). Disclaimer: The licensor does not endorse you or your use. For the full license, please visit (accessed on 1 December 2023) https://creativecommons.org/licenses/by-nc/4.0/.
Figure 15
Figure 15
Principle of the chemical sensor employing cascade signal amplification for the quantification of Cu2+. Reprinted from ref. [271], Copyright (2023), with permission from the Royal Society of Chemistry.

Similar articles

References

    1. Wang C., Liu M., Wang Z., Li S., Deng Y., He N. Point-of-care diagnostics for infectious diseases: From methods to devices. Nano Today. 2021;37:101092. doi: 10.1016/j.nantod.2021.101092. - DOI - PMC - PubMed
    1. Espinosa R., Tago D., Treich N. Infectious diseases and meat production. Environ. Resour. Econ. 2020;76:1019–1044. doi: 10.1007/s10640-020-00484-3. - DOI - PMC - PubMed
    1. Fonkwo P.N. Pricing infectious disease: The economic and health implications of infectious diseases. Embo Rep. 2008;9:S13–S17. doi: 10.1038/embor.2008.110. - DOI - PMC - PubMed
    1. Morens D.M., Folkers G.K., Fauci A.S. The challenge of emerging and re-emerging infectious diseases. Nature. 2004;430:242–249. doi: 10.1038/nature02759. - DOI - PMC - PubMed
    1. Smith K.M., Machalaba C.C., Seifman R., Feferholtz Y., Karesh W.B. Infectious disease and economics: The case for considering multi-sectoral impacts. One Health. 2019;7:100080. doi: 10.1016/j.onehlt.2018.100080. - DOI - PMC - PubMed