. 2024 Mar 11;13(6):487.
doi: 10.3390/cells13060487.

Exploring Regorafenib Responsiveness and Uncovering Molecular Mechanisms in Recurrent Glioblastoma Tumors through Longitudinal In Vitro Sampling

Affiliations

Exploring Regorafenib Responsiveness and Uncovering Molecular Mechanisms in Recurrent Glioblastoma Tumors through Longitudinal In Vitro Sampling

Mariangela Morelli et al. Cells. .

Abstract

Glioblastoma, a deadly brain tumor, shows limited response to standard therapies like temozolomide (TMZ). Recent findings from the REGOMA trial underscore a significant survival improvement offered by Regorafenib (REGO) in recurrent glioblastoma. Our study aimed to propose a 3D ex vivo drug response precision medicine approach to investigate recurrent glioblastoma sensitivity to REGO and elucidate the underlying molecular mechanisms involved in tumor resistance or responsiveness to treatment. Three-dimensional glioblastoma organoids (GB-EXPs) obtained from 18 patients' resected recurrent glioblastoma tumors were treated with TMZ and REGO. Drug responses were evaluated using NAD(P)H FLIM, stratifying tumors as responders (Resp) or non-responders (NRs). Whole-exome sequencing was performed on 16 tissue samples, and whole-transcriptome analysis on 13 GB-EXPs treated and untreated. We found 35% (n = 9) and 77% (n = 20) of tumors responded to TMZ and REGO, respectively, with no instances of TMZ-Resp being REGO-NRs. Exome analysis revealed a unique mutational profile in REGO-Resp tumors compared to NR tumors. Transcriptome analysis identified distinct expression patterns in Resp and NR tumors, impacting Rho GTPase and NOTCH signaling, known to be involved in drug response. In conclusion, recurrent glioblastoma tumors were more responsive to REGO compared to TMZ treatment. Importantly, our approach enables a comprehensive longitudinal exploration of the molecular changes induced by treatment, unveiling promising biomarkers indicative of drug response.

Keywords: NADP(H) FLIM; Regorafenib; drug response; glioblastoma; organoids.


Conflict of interest statement

The authors declare no conflicts of interest.

Figures
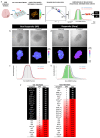
Figure 1
Figure 1
FLIM analysis of patient-derived GB-EXPs. (a) Workflow: Patient-derived GB-EXPs were obtained from surgical tissue, cultured in vitrogel, and treated for 72 h. FLIM analysis was performed on a range of 12 to 20 patient-derived GB-EXPs, including treated and control samples. Data were analyzed using the phasor approach, resulting in mean NAD(P)H fractional distribution curves for treated GB-EXPs (red) and control GB-EXPs (blue). The statistically significant leftward shift of the treated curve compared to the control curve is highlighted in green and indicates a more oxidative state in the treated GB-EXPs compared to the controls. The green area is indicative of the percentage of drug response (%DR). Tumors were stratified into non-responders (NRs, %DR ≤ 5) and responders (Resp, %DR > 5) using a cutoff of 5%DR. (be) Exemplary instances of one NR and one Resp tumor-derived GB-EXP post-treatment, featuring a brightfield image (top) and the corresponding phasor map (bottom). In the case of NRs, the NAD(P)H fractional mean distribution curves overlap between control (blue) and treated GB-EXPs (red), leading to a 0%DR (c). Conversely, in the case of Resp, the NAD(P)H fractional mean distribution curves exhibit a leftward shift of the red curves (treated GB-EXPs), resulting in a 74%DR (e). (f) Summary of %DR for all cases with both treatment modalities, TMZ (left) and REGO (right). The first column lists the sample identification number (Sample Nr), the second column displays the %DR, and the third column indicates the phenotype as NR or Resp. Cases are arranged from lower %DR at the top to higher %DR at the bottom, with color highlighting the %DR increase from white to red. NR sample cells are colored in black, with white characters; TMZ-NR samples are marked with an asterisk (*). Abbreviations: %DR, percentage of drug response; NR, non-responder; Resp, responder; cor, core portion of tumor; per, peripheral portion of the tumor; PR, primary tumor; REC, recurrent tumor.
Figure 2
Figure 2
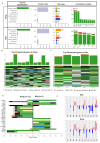
Mutational analysis of GB patients. (a) The mutation landscape of GB patients categorized as Resp (n = 11) and NRs (n = 5). This includes counts of each variant classification, variant type, single-nucleotide variant (SNV) classification, and the top 10 mutated genes. (b,c) Oncoplot illustrating the genes mutated in 100% (11/11) of Resp patients (b) and NR patients (c). (d) A co-bar plot indicating the genes significantly distinguishing between Resp and NR groups. Bars indicate the percentage of samples in which gene mutations were identified, with colors representing the types of mutation. (e) Heatmap displaying alterations in copy number of chromosome regions between Resp (n = 11) and NR (n = 5) groups (red indicates chromosome gains, and blue indicates losses). Abbreviations: Resp, responders; NRs, non-responders.
Figure 3
Figure 3
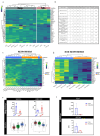
Gene expression analysis of GB-EXPs. (a) Heatmap of differentially expressed genes (DEGs) among Resp and NR samples in DMSO-treated GB-EXPs (controls). (b) Molecular pathways in which DEGsC are involved. (c) Heatmap of DEGs among controls and REGO-treated samples in responder GB-EXPs. (d) Heatmap of DEGs among controls and REGO-treated samples in NR GB-EXPs. (e) DUSP6 and RNF150 gene expression in GB-EXPs of Resp samples, and in GLIOVIS online database (TCGA samples and Agilent platform) according to tumor grade. (f) KI67 and ABCA4 gene expression in GB-EXPs of NR samples. Abbreviations: Resp, responders; NRs, non-responders; CTRL, controls; TREAT, treated GB-EXPs.

References

    1. Ostrom Q.T., Patil N., Cioffi G., Waite K., Kruchko C., Barnholtz-Sloan J.S. CBTRUS Statistical Report: Primary Brain and Other Central Nervous System Tumors Diagnosed in the United States in 2013–2017. Neuro Oncol. 2020;22((Suppl. S1)):iv1–iv96. doi: 10.1093/neuonc/noaa200. - DOI - PMC - PubMed
    1. Stupp R., Mason W.P., van den Bent M.J., Weller M., Fisher B., Taphoorn M.J.B., Belanger K., Brandes A.A., Marosi C., Bogdahn U., et al. Radiotherapy plus concomitant and adjuvant temozolomide for glioblastoma. N. Engl. J. Med. 2005;352:987–996. doi: 10.1056/NEJMoa043330. - DOI - PubMed
    1. Rønning P.A., Helseth E., Meling T.R., Johannesen T.B. A population-based study on the effect of temozolomide in the treatment of glioblastoma multiforme. Neuro Oncol. 2012;14:1178–1184. doi: 10.1093/neuonc/nos153. - DOI - PMC - PubMed
    1. Stupp R., Hegi M.E., Mason W.P., van den Bent M.J., Taphoorn M.J.B., Janzer R.C., Ludwin S.K., Allgeier A., Fisher B., Belanger K., et al. Effects of radiotherapy with concomitant and adjuvant temozolomide versus radiotherapy alone on survival in glioblastoma in a randomised phase III study: 5-year analysis of the EORTC-NCIC trial. Lancet Oncol. 2009;10:459–466. doi: 10.1016/S1470-2045(09)70025-7. - DOI - PubMed
    1. Batchelor T.T., Gerstner E.R., Ye X., Desideri S., Duda D.G., Peereboom D., Lesser G.J., Chowdhary S., Wen P.Y., Grossman S., et al. Feasibility, phase I, and phase II studies of tandutinib, an oral platelet-derived growth factor receptor-β tyrosine kinase inhibitor, in patients with recurrent glioblastoma. Neuro Oncol. 2017;19:567–575. doi: 10.1093/neuonc/now185. - DOI - PMC - PubMed

MeSH terms

LinkOut - more resources