. 2024 Feb 27;13(3):149.
doi: 10.3390/biology13030149.

KIF2A Upregulates PI3K/AKT Signaling through Polo-like Kinase 1 (PLK1) to Affect the Proliferation and Apoptosis Levels of Eriocheir sinensis Spermatogenic Cells

Affiliations

KIF2A Upregulates PI3K/AKT Signaling through Polo-like Kinase 1 (PLK1) to Affect the Proliferation and Apoptosis Levels of Eriocheir sinensis Spermatogenic Cells

Yan-Shuang Zhao et al. Biology (Basel). .

Abstract

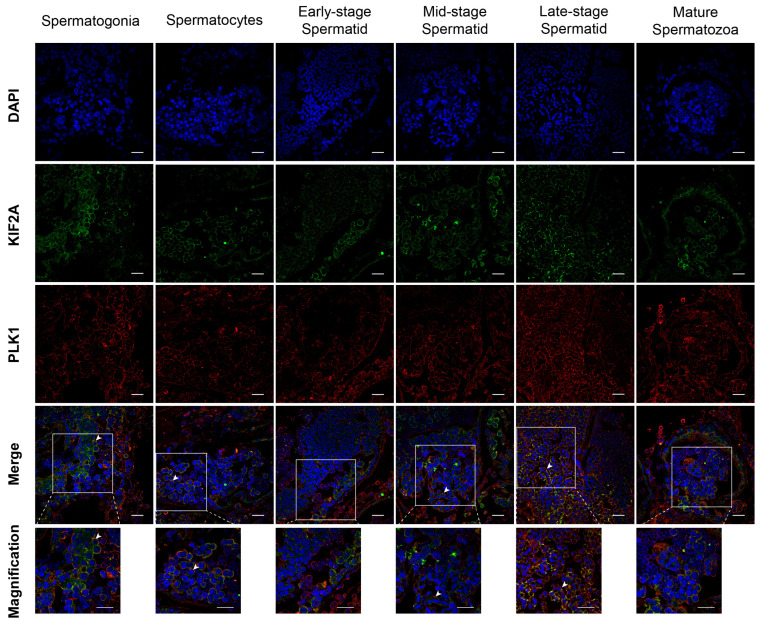
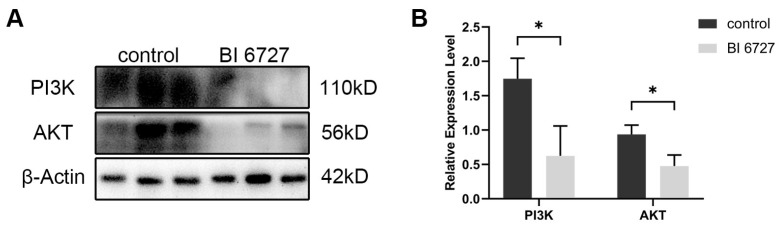
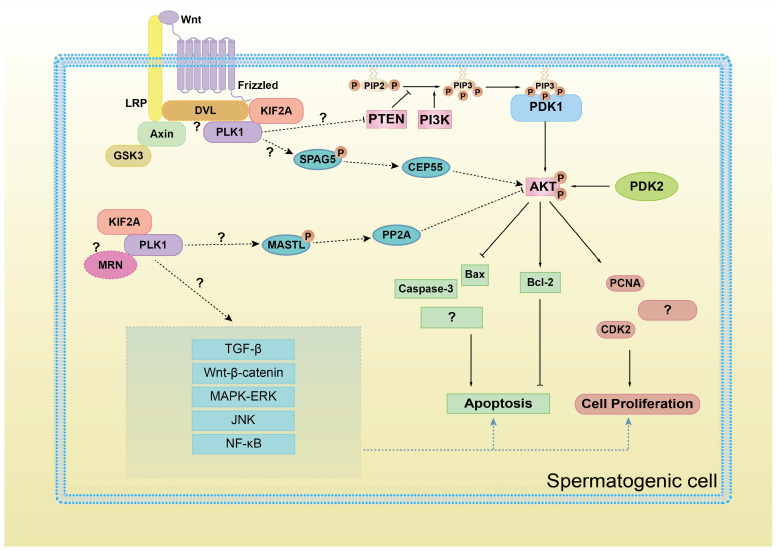
E. sinensis is an animal model for studying the reproduction and development of crustaceans. In this study, we knocked down the Es-Kif2a gene by injecting dsRNA into E. sinensis and inhibited Es-Plk1 gene expression by injecting PLK1 inhibitor BI6727 into E. sinensis. Then, the cell proliferation level, apoptosis level, and PI3K/AKT signaling expression level were detected. Our results showed that the proliferation level of spermatogenic cells decreased, while the apoptosis level increased after Es-Kif2a knockdown or Es-Plk1 inhibition. In order to verify whether these changes are caused by regulating the PI3K/AKT pathway, we detected the expression of PI3K and AKT proteins after Es-Kif2a knockdown or Es-Plk1 inhibition. Western Blot showed that in both the Es-Kif2a knockdown group and the Es-Plk1 inhibition group, the expression of PI3K and AKT proteins decreased. In addition, immunofluorescence showed that Es-KIF2A and Es-PLK1 proteins were co-localized during E. sinensis spermatogenesis. To further explore the upstream and downstream relationship between Es-KIF2A and Es-PLK1, we detected the expression level of Es-PLK1 after Es-Kif2a knockdown as well as the expression level of Es-KIF2A after Es-Plk1 inhibition. Western Blot showed that the expression of Es-PLK1 decreased after Es-Kif2a knockdown, while there was no significant change of Es-KIF2A after Es-Plk1 inhibition, indicating that Es-PLK1 may be a downstream factor of Es-KIF2A. Taken together, these results suggest that Es-KIF2A upregulates the PI3K/AKT signaling pathway through Es-PLK1 during the spermatogenesis of E. sinensis, thereby affecting the proliferation and apoptosis levels of spermatogenic cells.

Keywords: Eriocheir sinensis; KIF2A; PI3K/AKT signaling; PLK1; apoptosis; cell proliferation.


Conflict of interest statement

The authors declare no conflicts of interest.

Figures

Figure 1
Figure 1
The overall experimental design of our study. See text for details.
Figure 2
Figure 2
Location of the KIF2A protein during different stages of spermatogenesis in E. sinensis. The blue signal represents nuclei stained with DAPI; the red signal shows the distribution of Es-KIF2A protein; the white arrows represent the Merge signals. NC refers to the negative control group, which did not incubate the primary antibody, and no signals other than DAPI were detected. From top to bottom, the spermatogonia stage, spermatocyte stage, early-stage spermatids, mid-stage spermatids, and mature spermatozoa are shown. In the middle of this figure, the pattern diagram according to the results is shown. N: nucleus; MC: membrane complex; PV: pre-acrosomal vesicles; AC: acrosome cap; AT: acrosome tube; LS: sheet layer structure; AV: acrosome vesicle; ML: intermediate layer; FL: fibrous layer; NC: nuclear cup. Scale bar: 20 μm.
Figure 3
Figure 3
Es-Kif2a interference reduced spermatogenic cell proliferation and enhanced apoptosis level in the testes of E. sinensis. The control group was injected with 1× PBS solution, while the interference group (ds-Kif2a) was injected with equal dsRNA against Es-Kif2a. (A) Es-Kif2a interference effect detection. (a1) Western Blot detection of Es-KIF2A expression. (a2) Quantification analysis of transcriptional level of Es-Kif2a (n = 13, −0.2985 ± 0.1024, p = 0.0076). (a3) Quantification analysis of expression level of Es-KIF2A (n = 3, −0.4778 ± 0.08437, p = 0.0048). (B) Immunofluorescence detection of EdU cell proliferation signals. The blue signal represents the nucleus stained with DAPI, the red signal represents Edu-Alexa Fluor 555, and the Merge signal represents the fusion signal of the two. Scale bar: 20 μm. (C) Detection of proliferation-related gene expression. (c1) Western Blot detection of Es-PCNA, Es-CDK2 expression. (c2) Quantification analysis of transcriptional levels of Es-Pcna (n = 3, −0.2433 ± 0.06074, p = 0.0160) and Es-Cdk2 (n = 3, −0.5633 ± 0.1129, p = 0.0076). (c3) Quantification analysis of expression levels of Es-PCNA (n = 3, −1.413 ± 0.2269, p = 0.0034) and Es-CDK2 (n = 3, −0.3185 ± 0.08825, p = 0.0226). (D) Immunofluorescence detection of TUNEL apoptosis signals. The blue signal represents the nucleus stained with DAPI, the red signal represents Cy3, and the Merge signal represents the fusion signal of the two. Scale bar: 20 μm. (E) Detection of apoptosis-related proteins. (e1) Western Blot detection of Es-Bax, Es-Bcl-2, Es-Caspase-3 expression. (e2) Quantification analysis of expression levels of Es-Bax (n = 3, 0.5584 ± 0.1364, p = 0.0149), Es-Bcl-2 (n = 3, −0.8206 ± 0.1657, p = 0.0078), and Es-Caspase-3 (n = 3, 0.2217 ± 0.03205, p = 0.0023). (e3) Quantification analysis of Es-Bax/Es-Bcl-2 ratio (n = 3, 0.9760 ± 0.1549, p = 0.0032). The integrated density was analyzed by the software Image J, qPCR results were analyzed by Microsoft Excel, and the analyzed data were imported into GraphPad Prism 8 software for statistical analysis. The significant differences were analyzed using the unpaired Student’s t-test and expressed as mean ± SEM (n ≥ 3). “*” above the columns indicates p < 0.05, and “**” indicates p < 0.01.
Figure 4
Figure 4
The expression levels of PI3K and AKT proteins decreased after Es-Kif2a knockdown in the testes of E. sinensis. (A) Western Blot detection of Es-PI3K and Es-AKT expression after Es-Kif2a knockdown. (B) Quantification analysis of transcriptional levels of Es-Pi3k (n = 3, −0.7667 ± 0.1400, p = 0.0054) and Es-Akt (n = 3, −0.5000 ± 0.07134, p = 0.0022). (C) Quantification analysis of expression levels of Es-PI3K (n = 3, −0.3723 ± 0.09844, p = 0.0194) and Es-AKT (n = 3, −0.6544 ± 0.09454, p = 0.0023). The integrated density was analyzed by the software Image J, and the analyzed data were imported into GraphPad Prism 8 software for statistical analysis. The significant differences were analyzed using the unpaired Student’s t-test and expressed as mean ± SEM (n = 3). “*” above the columns indicates p < 0.05, and “**” indicates p < 0.01.
Figure 5
Figure 5
Co-localization of Es-KIF2A and Es-PLK1 during different stages of spermatogenesis in E. sinensis. The blue signal represents nuclei stained with DAPI; the green signal represents the distribution of the Es-KIF2A protein; the red signal represents the distribution of the Es-PLK1 protein. The white arrows show the Merge signals. From left to right, the spermatogonia stage, spermatocyte stage, early-stage spermatids, mid-stage spermatids, late-stage spermatids, and mature spermatozoa are shown. Scale bar: 20 μm.
Figure 6
Figure 6
Es-Plk1 inhibition reduced spermatogenic cell proliferation and enhanced the apoptosis level in the testes of E. sinensis. The control group was injected with 1× PBS solution, while the inhibition group (BI 6727) was injected with equal BI 6727 (a PLK1 inhibitor) solution. (A) Es-Plk1 inhibition effect detection. (a1) Western Blot detection of Es-PLK1 expression. (a2) Quantification analysis of expression level of Es-PLK1 (n = 3, −0.3385 ± 0.03686, p = 0.0008). (B) Detection of proliferation-related gene expression. (b1) Western Blot detection of Es-PCNA, Es-CDK2 expression. (b2) Quantification analysis of expression levels of Es-PCNA (n = 3, −0.3613 ± 0.1051, p = 0.0264) and Es-CDK2 (n = 3, −0.5614 ± 0.1304, p = 0.0126). (C) Immunofluorescence detection of EdU cell proliferation signals. The blue signal represents the nucleus stained with DAPI, the red signal represents Edu-Alexa Fluor 555, the Merge signal represents the fusion signal of the two, and the magnification is the amplification of the Merge signal. Scale bar: 20 μm. (D) Detection of apoptosis-related proteins. (d1) Western Blot detection of Es-Bax, Es-Bcl-2, and Es-Caspase-3 expression. (d2) Quantification analysis of expression levels of Es-Bax (n = 3, 0.8483 ± 0.1846, p = 0.0101), Es-Bcl-2 (n = 3, −0.6436 ± 0.1697, p = 0.0192), and Es-Caspase-3 (n = 3, 0.2181 ± 0.07804, p = 0.0491). (d3) Quantification analysis of Es-Bax/Es-Bcl-2 ratio (n = 3, 1.455 ± 0.1690, p = 0.0010). (E) Immunofluorescence detection of TUNEL apoptosis signals. The blue signal represents the nucleus stained with DAPI, the red signal represents Cy3, the Merge signal represents the fusion signal of the two, and the magnification is the amplification of the Merge signal. Scale bar: 20 μm. The integrated density was analyzed by the software Image J, qPCR results were analyzed by Microsoft Excel, and the analyzed data were imported into GraphPad Prism 8 software for statistical analysis. The significant differences were analyzed using the unpaired Student’s t-test and expressed as mean ± SEM (n = 3). “*” above the columns indicates p < 0.05, and “**” indicates p < 0.01, “***” indicates p < 0.001.
Figure 7
Figure 7
The expression level of PI3K and AKT proteins decreased after Es-Plk1 inhibition in the testes of E. sinensis. (A) Western Blot detection of Es-PI3K and Es-AKT expression levels after Es-Plk1 inhibition. (B) Quantification analysis of expression levels of Es-PI3K (n = 3, −1.122 ± 0.3040, p = 0.0210) and Es-AKT (n = 3, −0.4606 ± 0.1216, p = 0.0193). The integrated density was analyzed by the software Image J, and the analyzed data were imported into GraphPad Prism 8 software for statistical analysis. The significant differences were analyzed using the unpaired Student’s t-test and expressed as mean ± SEM (n = 3). “*” above the columns indicates p < 0.05.
Figure 8
Figure 8
Es-PLK1 is a downstream factor of Es-KIF2A. (A) Es-PLK1 detection after Es-Kif2a knockdown. (a1) Western Blot detection of Es-PLK1 expression. (a2) Quantification analysis of expression level of Es-PLK1 (n = 3, −0.1603 ± 0.04432, p = 0.0224). (B) Es-KIF2A detection after Es-Plk1 inhibition. (b1) Western Blot detection of Es-KIF2A expression. (b2) Quantification analysis of expression level of Es-KIF2A (n = 3, 0.3021 ± 0.2147, p = 0.2322). The integrated density was analyzed by the software Image J, and the analyzed data were imported into GraphPad Prism 8 software for statistical analysis. The significant differences were analyzed using the unpaired Student’s t-test and expressed as mean ± SEM (n = 3). “ns” above the columns indicates not statistically significant, and “*” above the columns indicates p < 0.05.
Figure 9
Figure 9
A schematic diagram of KIF2A/PLK1 complex co-regulating PI3K/AKT signaling and proliferation and apoptosis in spermatogenic cells. AKT activation, on the one hand, promotes the expression of proliferating proteins PCNA, CDK2, and anti-apoptotic protein Bcl-2 and on the other hand, inhibits the expression of pro-apoptotic proteins Bax and Caspase-3. However, whether other protein factors are involved in the regulation of PI3K/AKT pathway by KIF2A/PLK1 complex, whether KIF2A/PLK1 complex also regulate other signaling pathways, whether other cell proliferation/apoptosis proteins are also influenced, these questions still requires further study.

Similar articles

Cited by

References

    1. Du N.S. Congeneric species of Chinese mitten crab and their English names. Aquat. Sci. Technol. Inf. 1998;25:108–113. doi: 10.16446/j.cnki.1001-1994.1998.03.003. (In Chinese) - DOI
    1. Du N.S., Xue L.Z., Lai W. Histological study on the male reproductive system of Eriocheir sinensis. Acta Zool. Sin. 1988;34:329–333+389–390. (In Chinese)
    1. Du N.S., Xue L.Z., Lai W. Study on Sperm of Eriocheir sinensis II. Spermatogenesis. Oceanol. Limnol. Sin. 1988;19:71–75+103–104. (In Chinese)
    1. Ma D.D., Wang D.H., Yang W.X. Kinesins in spermatogenesis. Biol. Reprod. 2017;96:267–276. doi: 10.1095/biolreprod.116.144113. - DOI - PubMed
    1. Moores C.A., Milligan R.A. Lucky 13-microtubule depolymerisation by kinesin-13 motors. Pt 19J. Cell Sci. 2006;119:3905–3913. doi: 10.1242/jcs.03224. - DOI - PubMed

LinkOut - more resources