. 2024 Feb 27;11(3):224.
doi: 10.3390/bioengineering11030224.

Measurement of the Mapping between Intracranial EEG and fMRI Recordings in the Human Brain

Affiliations

Measurement of the Mapping between Intracranial EEG and fMRI Recordings in the Human Brain

David W Carmichael et al. Bioengineering (Basel). .

Abstract

There are considerable gaps in our understanding of the relationship between human brain activity measured at different temporal and spatial scales. Here, electrocorticography (ECoG) measures were used to predict functional MRI changes in the sensorimotor cortex in two brain states: at rest and during motor performance. The specificity of this relationship to spatial co-localisation of the two signals was also investigated. We acquired simultaneous ECoG-fMRI in the sensorimotor cortex of three patients with epilepsy. During motor activity, high gamma power was the only frequency band where the electrophysiological response was co-localised with fMRI measures across all subjects. The best model of fMRI changes across states was its principal components, a parsimonious description of the entire ECoG spectrogram. This model performed much better than any others that were based either on the classical frequency bands or on summary measures of cross-spectral changes. The region-specific fMRI signal is reflected in spatially and spectrally distributed EEG activity.

Keywords: BOLD; BOLD coupling; EEG-fMRI; Intracranial EEG; fMRI biophysics; functional MRI.


Conflict of interest statement

The authors declare no conflict of interest.

Figures

Figure 1
Figure 1
Analysis overview. The process of comparing fMRI to ECoG data is shown with ECoG data from the post-central ECoG (contact #22, subject #1 top left corner) transformed into time-frequency space via a wavelet transform before being convolved with the HRF. This yields a spectrally specific model of the fMRI changes (e.g., black line at the bottom) for correlation (or model comparison) with the fMRI signal in the hand sensorimotor region (red line at bottom; average from task activated region, p < 0.05 FWE corrected). This region was used due to the strong evidence that it is commonly active both during rest and task [30]. The correlation between ECoG power at 20 Hz and fMRI signal during the task is shown to be strong and negative. This correlation analysis was repeated for each frequency during the task and rest to establish spectral specificity (see Figure 2a–c) and then for each electrode contact to establish spatial specificity (see Figure 3 and Figure 4).
Figure 2
Figure 2
Frequency-specific sensorimotor cortex correlations between colocalised ECoG and fMRI during task and rest. For each subject (ac) the fMRI signal from the fMRI task activation defined hand motor area was correlated with the co-localised ECoG data from a single electrode contact. The location of the electrode contact used is highlighted by a yellow circle on a reconstruction of the individual’s cortical surface and ECoG contact locations a photo is also provided where available (subjects #1 and #3). Stars indicate significant correlation p < 0.001 which corresponds to p < 0.05 corrected for multiple comparisons, circles non-significant correlation values. Black represents the correlation during the task and red points correlation during rest. Black circles with green infill are non-significant task values.
Figure 2
Figure 2
Frequency-specific sensorimotor cortex correlations between colocalised ECoG and fMRI during task and rest. For each subject (ac) the fMRI signal from the fMRI task activation defined hand motor area was correlated with the co-localised ECoG data from a single electrode contact. The location of the electrode contact used is highlighted by a yellow circle on a reconstruction of the individual’s cortical surface and ECoG contact locations a photo is also provided where available (subjects #1 and #3). Stars indicate significant correlation p < 0.001 which corresponds to p < 0.05 corrected for multiple comparisons, circles non-significant correlation values. Black represents the correlation during the task and red points correlation during rest. Black circles with green infill are non-significant task values.
Figure 3
Figure 3
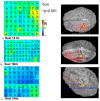
Spatial pattern of correlations between ECoG and fMRI during finger tapping.
Figure 4
Figure 4
Spatial pattern of correlations between ECoG and fMRI during rest. In (ac) the correlation for each subject was mapped spatially over the cortex for the significant negative peak in correlation (beta frequency range). Note positive correlations in the gamma range were not in general significant at rest and so were not spatially mapped.
Figure 5
Figure 5
Spatial performance of different BOLD predictor models. Maps of the model evidence for a particular model and subject across the cortical grid, for the task (left hand side 4 × 3 panels) and rest (right hand side 4 × 3 panel) conditions. Each row represents a different model. Colour scale: dark red means strong evidence for the model and blue, that the model is less predictive than the null (noise only) model.

References

    1. Friston K.J. Modalities, modes, and models in functional neuroimaging. Science. 2009;326:399–403. doi: 10.1126/science.1174521. - DOI - PubMed
    1. Logothetis N.K. What we can do and what we cannot do with fMRI. Nature. 2008;453:869–878. doi: 10.1038/nature06976. - DOI - PubMed
    1. Logothetis N.K., Pauls J., Augath M., Trinath T., Oeltermann A. Neurophysiological investigation of the basis of the fMRI signal. Nature. 2001;412:150–157. doi: 10.1038/35084005. - DOI - PubMed
    1. Niessing J., Ebisch B., Schmidt K.E., Niessing M., Singer W., Galuske R.A.W. Hemodynamic signals correlate tightly with synchronized gamma oscillations. Science. 2005;309:948–951. doi: 10.1126/science.1110948. - DOI - PubMed
    1. Mukamel R., Gelbard H., Arieli A., Hasson U., Fried I., Malach R. Coupling between neuronal firing, field potentials, and FMRI in human auditory cortex. Science. 2005;309:951–954. doi: 10.1126/science.1110913. - DOI - PubMed

LinkOut - more resources