

Shear Stress Quantification in Tissue Engineering Bioreactor Heart Valves: A Computational Approach
- PMID: 38535269
- PMCID: PMC10971346
- DOI: 10.3390/jfb15030076
Shear Stress Quantification in Tissue Engineering Bioreactor Heart Valves: A Computational Approach
Abstract
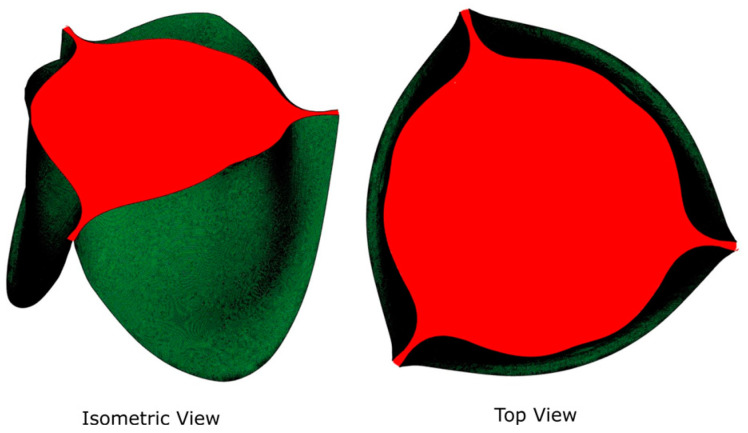
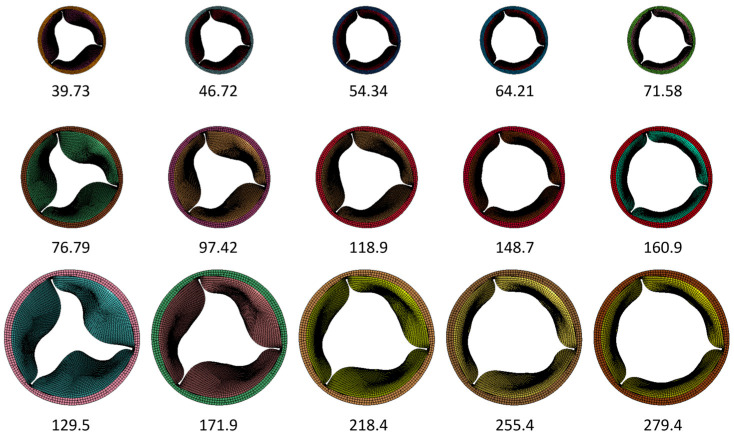
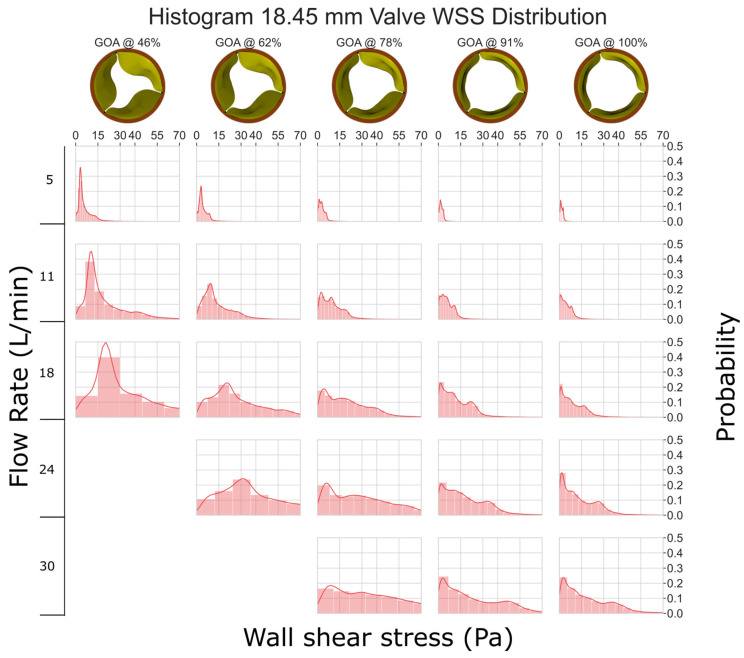
Tissue-engineered heart valves can grow, repair, and remodel after implantation, presenting a more favorable long-term solution compared to mechanical and porcine valves. Achieving functional engineered valve tissue requires the maturation of human cells seeded onto valve scaffolds under favorable growth conditions in bioreactors. The mechanical stress and strain on developing valve tissue caused by different pressure and flow conditions in bioreactors are currently unknown. The aim of this study is to quantify the wall shear stress (WSS) magnitude in heart valve prostheses under different valve geometries and bioreactor flow rates. To achieve this, this study used fluid-structure interaction simulations to obtain the valve's opening geometries during the systolic phase. These geometries were then used in computational fluid dynamics simulations with refined near-wall mesh elements and ranges of prescribed inlet flow rates. The data obtained included histograms and regression curves that characterized the distribution, peak, and median WSS for various flow rates and valve opening configurations. This study also found that the upper region of the valve near the commissures experienced higher WSS magnitudes than the rest of the valve.
Keywords: CFD; FSI; TEHV; computational model; wall shear stress quantification.
Conflict of interest statement
Author Leslie Sierad was employed by the company Aptus, LLC. The remaining authors declare that the research was conducted in the absence of any commercial or financial relationships that could be construed as a potential conflict of interest.
Figures


Similar articles
-
A novel flex-stretch-flow bioreactor for the study of engineered heart valve tissue mechanobiology.Ann Biomed Eng. 2008 May;36(5):700-12. doi: 10.1007/s10439-008-9447-6. Epub 2008 Feb 6. Ann Biomed Eng. 2008. PMID: 18253834 Free PMC article.
-
Computational simulations predict a key role for oscillatory fluid shear stress in de novo valvular tissue formation.J Biomech. 2014 Nov 7;47(14):3517-23. doi: 10.1016/j.jbiomech.2014.08.028. Epub 2014 Sep 16. J Biomech. 2014. PMID: 25262874
-
Osteogenic Activity on NaOH-Etched Three-Dimensional-Printed Poly-ɛ-Caprolactone Scaffolds in Perfusion or Spinner Flask Bioreactor.Tissue Eng Part C Methods. 2023 Jun;29(6):230-241. doi: 10.1089/ten.tec.2023.0062. Epub 2023 May 30. Tissue Eng Part C Methods. 2023. PMID: 37253166
-
Designing Biocompatible Tissue Engineered Heart Valves In Situ: JACC Review Topic of the Week.J Am Coll Cardiol. 2023 Mar 14;81(10):994-1003. doi: 10.1016/j.jacc.2022.12.022. J Am Coll Cardiol. 2023. PMID: 36889879 Free PMC article. Review.
-
A comparison of 4D flow MRI-derived wall shear stress with computational fluid dynamics methods for intracranial aneurysms and carotid bifurcations - A review.Magn Reson Imaging. 2018 May;48:62-69. doi: 10.1016/j.mri.2017.12.005. Epub 2017 Dec 6. Magn Reson Imaging. 2018. PMID: 29223732 Review.
Cited by
-
Mechanical Stimulation of Red Blood Cells Aging: Focusing on the Microfluidics Application.Micromachines (Basel). 2025 Feb 25;16(3):259. doi: 10.3390/mi16030259. Micromachines (Basel). 2025. PMID: 40141870 Free PMC article. Review.
References
-
- Rodríguez-Caulo E.A., Otero-Forero J.J., Sánchez-Espín G., Mataró M.J., Guzón A., Porras C., Villaescusa J., Such M., Melero J.M. 15 Years Outcomes Following Bioprosthetic versus Mechanical Aortic Valve Replacement in Patients Aged 50–65 Years with Isolated Aortic Stenosis. Cir. Cardiovasc. 2018;25:135–140. doi: 10.1016/j.circv.2018.03.002. - DOI
Grants and funding
LinkOut - more resources
Full Text Sources
Research Materials
Miscellaneous
