Relationships and Mendelian Randomization of Gut Microbe-Derived Metabolites with Metabolic Syndrome Traits in the METSIM Cohort
- PMID: 38535334
- PMCID: PMC10972019
- DOI: 10.3390/metabo14030174
Relationships and Mendelian Randomization of Gut Microbe-Derived Metabolites with Metabolic Syndrome Traits in the METSIM Cohort
Abstract
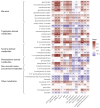
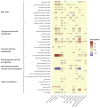
The role of gut microbe-derived metabolites in the development of metabolic syndrome (MetS) remains unclear. This study aimed to evaluate the associations of gut microbe-derived metabolites and MetS traits in the cross-sectional Metabolic Syndrome In Men (METSIM) study. The sample included 10,194 randomly related men (age 57.65 ± 7.12 years) from Eastern Finland. Levels of 35 metabolites were tested for associations with 13 MetS traits using lasso and stepwise regression. Significant associations were observed between multiple MetS traits and 32 metabolites, three of which exhibited particularly robust associations. N-acetyltryptophan was positively associated with Homeostatic Model Assessment for Insulin Resistant (HOMA-IR) (β = 0.02, p = 0.033), body mass index (BMI) (β = 0.025, p = 1.3 × 10⁻¹⁶), low-density lipoprotein cholesterol (LDL-C) (β = 0.034, p = 5.8 × 10⁻¹⁰), triglyceride (0.087, p = 1.3 × 10⁻¹⁶), systolic (β = 0.012, p = 2.5 × 10⁻⁶) and diastolic blood pressure (β = 0.011, p = 3.4 × 10⁻⁶). In addition, 3-(4-hydroxyphenyl) lactate yielded the strongest positive associations among all metabolites, for example, with HOMA-IR (β = 0.23, p = 4.4 × 10⁻³³), and BMI (β = 0.097, p = 5.1 × 10-52). By comparison, 3-aminoisobutyrate was inversely associated with HOMA-IR (β = -0.19, p = 3.8 × 10-51) and triglycerides (β = -0.12, p = 5.9 × 10-36). Mendelian randomization analyses did not provide evidence that the observed associations with these three metabolites represented causal relationships. We identified significant associations between several gut microbiota-derived metabolites and MetS traits, consistent with the notion that gut microbes influence metabolic homeostasis, beyond traditional risk factors.
Keywords: GWAS; Mendelian randomization; gut metabolites; gut microbes; insulin resistance; metabolic syndrome.
Conflict of interest statement
The authors declare no conflicts of interest.
Figures


References
-
- Expert Panel on Detection, Evaluation, Treatment of High Blood Cholesterol in Adults, Executive Summary of The Third Report of The National Cholesterol Education Program (NCEP) Expert Panel on Detection, Evaluation, and Treatment of High Blood Cholesterol In Adults (Adult Treatment Panel III) JAMA. 2001;285:2486–2497. - PubMed
-
- Dallmeier D., Larson M.G., Vasan R.S., Keaney J.F., Jr., Fontes J.D., Meigs J.B., Fox C.S., Benjamin E.J. Metabolic syndrome and inflammatory biomarkers: A community-based cross-sectional study at the Framingham Heart Study. Diabetol. Metab. Syndr. 2012;4:28. doi: 10.1186/1758-5996-4-28. - DOI - PMC - PubMed

