. 2024 Feb 22;22(3):100.
doi: 10.3390/md22030100.

The Peptide LLTRAGL Derived from Rapana venosa Exerts Protective Effect against Inflammatory Bowel Disease in Zebrafish Model by Regulating Multi-Pathways

Affiliations

The Peptide LLTRAGL Derived from Rapana venosa Exerts Protective Effect against Inflammatory Bowel Disease in Zebrafish Model by Regulating Multi-Pathways

Yongna Cao et al. Mar Drugs. .

Abstract

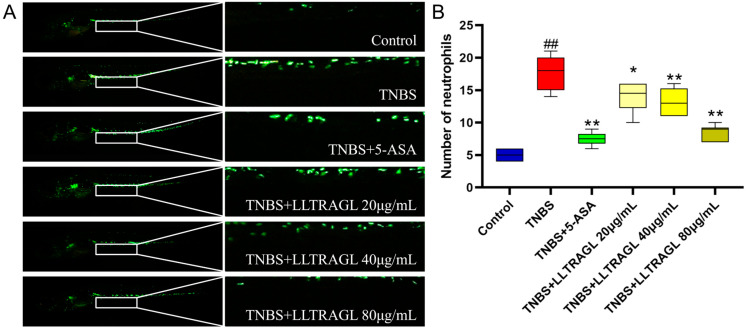
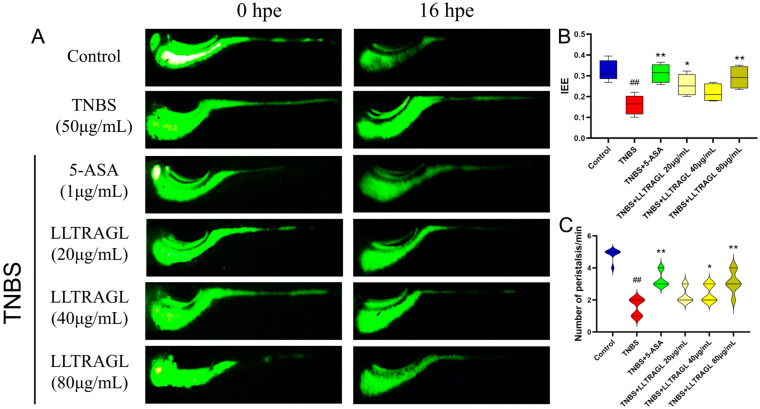
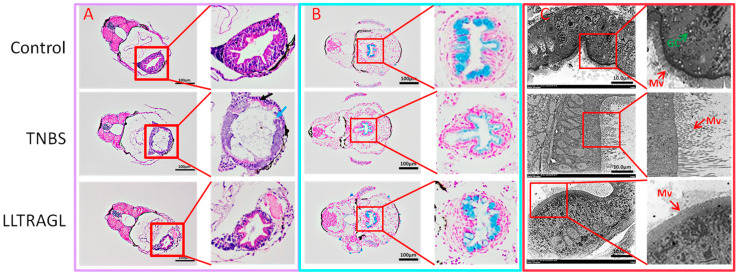
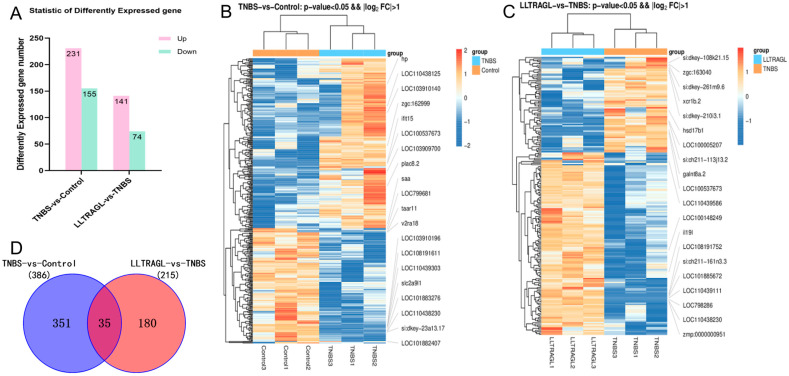
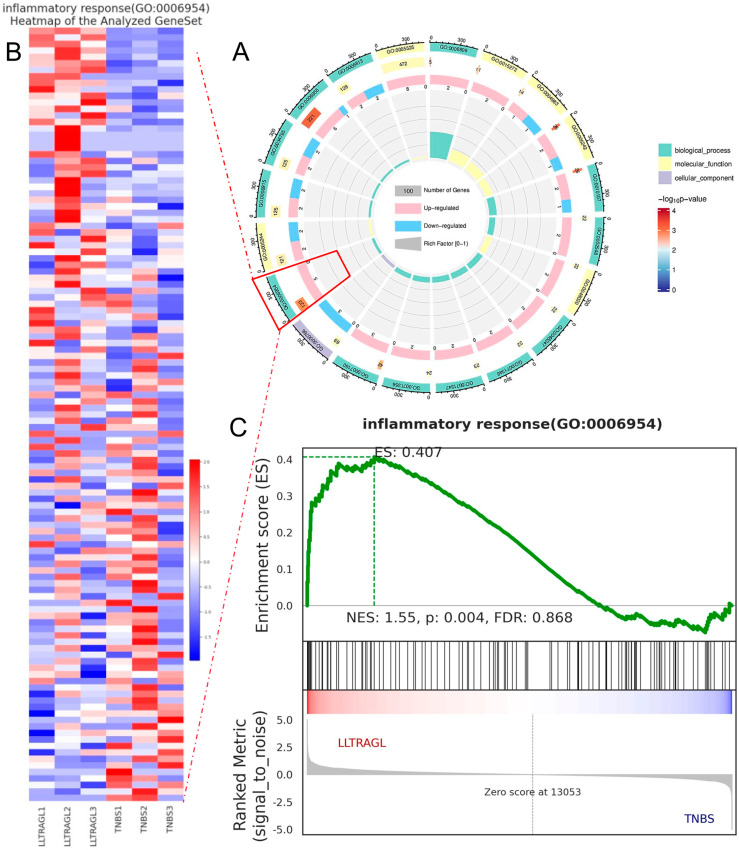
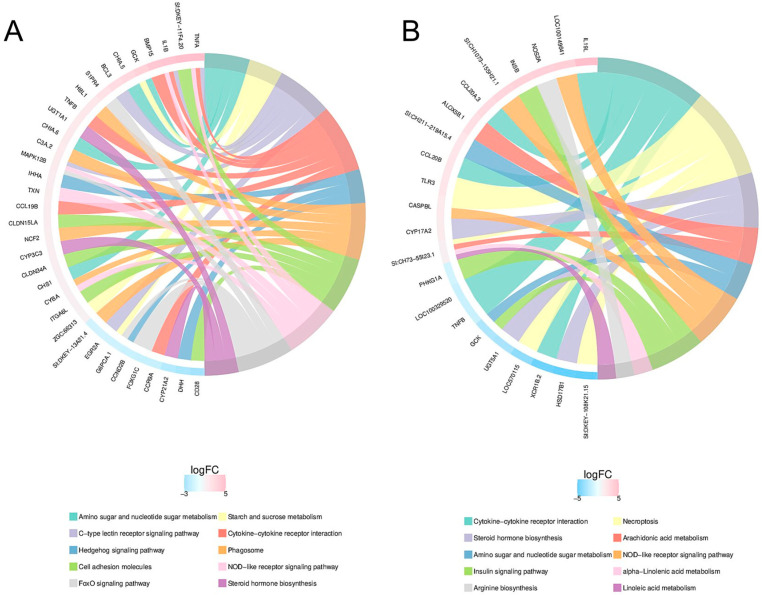
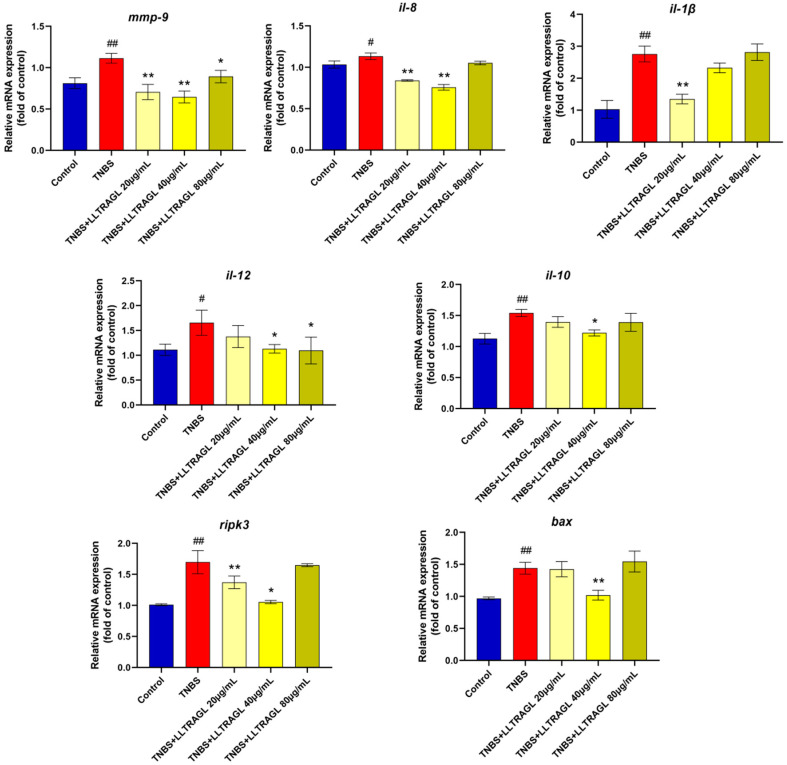
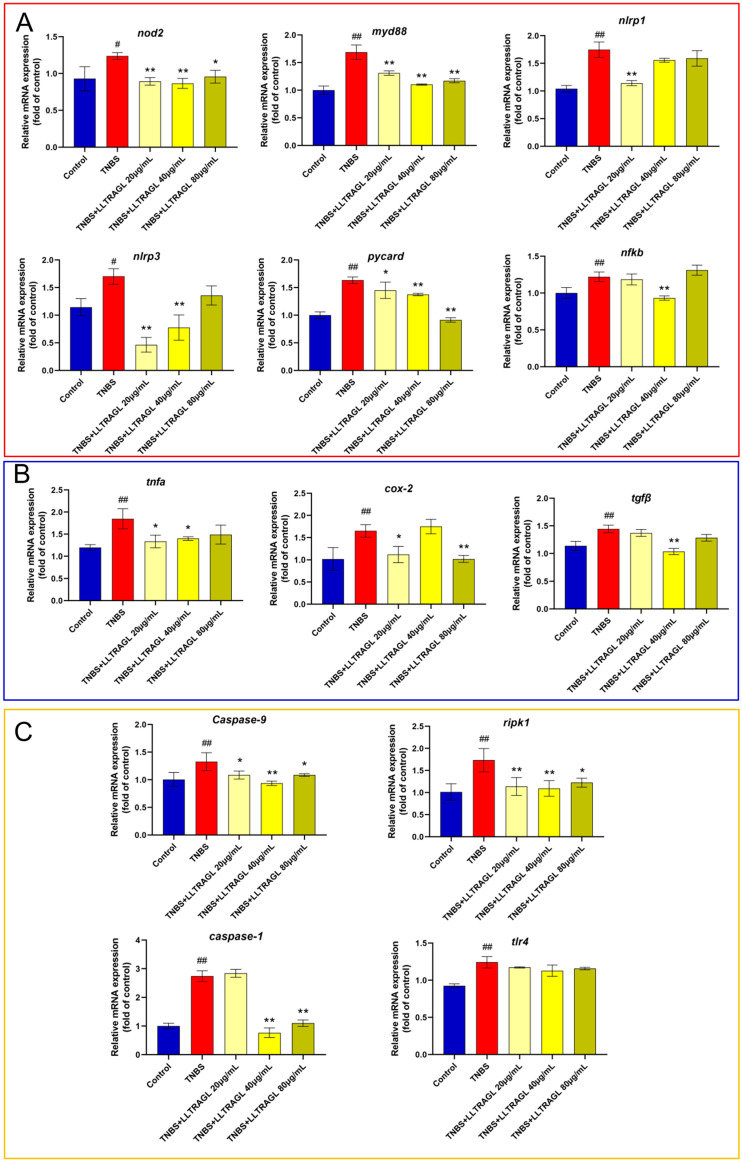
Inflammatory bowel disease (IBD) is a chronic inflammatory bowel disease with unknown pathogenesis which has been gradually considered a public health challenge worldwide. Peptides derived from Rapana venosa have been shown to have an anti-inflammatory effect. In this study, peptide LLTRAGL derived from Rapana venosa was prepared by a solid phase synthesis technique. The protective effects of LLTRAGL were studied in a 2,4,6-trinitrobenzene sulfonic acid (TNBS)-induced zebrafish colitis model. The underlying mechanisms of LLTRAGL were predicted and validated by transcriptome, real-time quantitative PCR assays and molecular docking. The results showed that LLTRAGL reduced the number of macrophages migrating to the intestine, enhanced the frequency and rate of intestinal peristalsis and improved intestinal inflammatory damage. Furthermore, transcriptome analysis indicated the key pathways (NOD-like receptor signal pathway and necroptosis pathway) that link the underlying protective effects of LLTRAGL's molecular mechanisms. In addition, the related genes in these pathways exhibited different expressions after TNBS treatment. Finally, molecular docking techniques further verified the RNA-sequencing results. In summary, LLTRAGL exerted protective effects in the model of TNBS-induced colitis zebrafish. Our findings provide valuable information for the future application of LLTRAGL in IBD.

Keywords: 2,4,6 trinitrobenzene sulfonic acid; LLTRAGL; NOD-like receptor; Rapana venosa; inflammatory bowel disease; necroptosis; transcriptome analysis; zebrafish.


Conflict of interest statement

The authors declare no conflicts of interest.

Figures

Figure 1
Figure 1
Effect of peptide LLTRAGL on TNBS-induced migration of zebrafish to intestinal macrophages. (A) Typical fluorescence images of Tg (zlyz: EGFP) macrophage migration in transgenic zebrafish juveniles. (B) Box chart showing the number of macrophages migrating from zebrafish larvae to the intestine. (A) the image on the right is an enlarged image of the white box on the left. Compared with the blank group, ## p ≤ 0.01; compared with the TNBS group, * p ≤ 0.05 and ** p ≤ 0.01.
Figure 2
Figure 2
LLTRAGL improves TNBS-induced intestinal peristalsis damage. (A) Typical fluorescence images of intestinal efflux rate (IEE) of wild zebrafish juveniles. The blue box shows that after staining with calcein for 1.5 h, the drug was administered for 16 h. (B) Box chart showing the intestinal efflux rate of zebrafish juveniles. (C) Violin chart showing the number of intestinal peristalses in zebrafish juveniles. Compared with the blank group, ## p ≤ 0.01; compared with the TNBS group, * p ≤ 0.05 and ** p ≤ 0.01.
Figure 3
Figure 3
Effects of the peptide on TNBS-induced intestinal tissue pathology and ultrastructure of zebrafish. (A) H&E staining of intestinal tissues. Black arrow: sparse arrangement of cells; Blue arrow: Mucosal layer necrosis, cell lysis, enhanced cytoplasmic basophilia, disappearance of intestinal folds. Scale bar is 100 µm. (B) Alcian blue (AB) staining of intestinal tissues. Scale bar is 100 µm. (C) Electron microscopy of intestinal ultrastructure. Red arrow: intestinal microvilli status; Mv represents microvilli; Green arrow: goblet cell state; GC stands for goblet cell. Scale bar is 10.0 µm.
Figure 4
Figure 4
The differentially expressed genes among the control group, TNBS group and peptide treatment group in RNA-Seq. (A) Statistical histogram of differentially expressed genes in TNBS vs. Control and LLTRAGL vs. TNBS. (B) TNBS vs. Control differential gene grouping cluster diagram. (C) LLTRAGL vs. TNBS differential gene grouping cluster diagram. (D) Venn diagram of common and unique differentially expressed genes between the TNBS vs. Control and LLTRAGL vs. TNBS comparative groups. The red color in the figure represents genes encoding relatively high expression proteins, while the blue color represents genes encoding relatively low expression proteins.
Figure 5
Figure 5
GO enrichment analysis of DEGs and GSEA of all tested genes. (A) Circle plots of the distribution of DEGs in different GO categories. The circle chart shows the distribution of DEGs in the molecular function (MF), biological process (BP), and cellular composition (CC) categories. (B) Grouping clustering diagram of inflammatory response in the GSEA analysis. (C) Analysis Results of the Inflammatory Response Gene Set, mainly including the distribution map of enrichment score (ES), gene distribution map of gene set, and distribution map of the measurement and control bar sorting matrix.
Figure 6
Figure 6
KEGG pathway enrichment analysis of DEGs. (A) KEGG-enriched top 10 chord diagram of TNBS vs. Control. (B) KEGG-enriched top 10 chord diagram of LLTRAGL-vs-TNBS. KEGG, Kyoto Encyclopedia of Genes and Genomes.
Figure 7
Figure 7
Effect of LLTRAG on the inflammation-related gene expression in zebrafish, determined by RT-PCR. Compared with the blank group, # p ≤ 0.05 and ## p ≤ 0.01; compared with the TNBS group, * p ≤ 0.05 and ** p ≤ 0.01.
Figure 8
Figure 8
Effect of LLTRAG on gene expression in TNBS-induced colitis in zebrafish. (A) NOD-like receptor signal pathway-related genes. (B) Inflammatory factors-related genes. (C) necroptosis signal pathway-related gene. Compared with the blank group, # p ≤ 0.05 and ## p ≤ 0.01; compared with the TNBS group, * p ≤ 0.05 and ** p ≤ 0.01.

Similar articles

Cited by

References

    1. Hodson R. Inflammatory bowel disease. Nature. 2016;540:S97. doi: 10.1038/540S97a. - DOI - PubMed
    1. Liu D., Saikam V., Skrada K.A., Merlin D., Iyer S.S. Inflammatory bowel disease biomarkers. Med. Res. Rev. 2022;42:1856–1887. doi: 10.1002/med.21893. - DOI - PMC - PubMed
    1. Kudelka M.R., Stowell S.R., Cummings R.D., Neish A.S. Intestinal epithelial glycosylation in homeostasis and gut microbiota interactions in IBD. Nat. Rev. Gastroenterol. Hepatol. 2020;17:597–617. doi: 10.1038/s41575-020-0331-7. - DOI - PMC - PubMed
    1. Bilal M., Nunes L.V., Duarte M.T.S., Ferreira L.F.R., Soriano R.N., Iqbal H.M.N. Exploitation of Marine-Derived Robust Biological Molecules to Manage Inflammatory Bowel Disease. Mar. Drugs. 2021;19:196. doi: 10.3390/md19040196. - DOI - PMC - PubMed
    1. Jimenez K.M., Gasche C. Management of Iron Deficiency Anaemia in Inflammatory Bowel Disease. Acta Haematol. 2019;142:30–36. doi: 10.1159/000496728. - DOI - PubMed

Supplementary concepts

LinkOut - more resources