Oral Microbiome Stamp in Alzheimer's Disease
- PMID: 38535538
- PMCID: PMC10975384
- DOI: 10.3390/pathogens13030195
Oral Microbiome Stamp in Alzheimer's Disease
Abstract
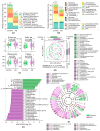
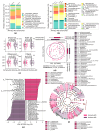
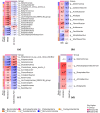
Recent studies have suggested that periodontal disease and alterations in the oral microbiome may be associated with cognitive decline and Alzheimer's disease (AD) development. Here, we report a case-control study of oral microbiota diversity in AD patients compared to healthy seniors from Central Asia. We have characterized the bacterial taxonomic composition of the oral microbiome from AD patients (n = 64) compared to the healthy group (n = 71) using 16S ribosomal RNA sequencing. According to our results, the oral microbiome of AD has a higher microbial diversity, with an increase in Firmicutes and a decrease in Bacteroidetes in the AD group. LEfSe analysis showed specific differences at the genus level in both study groups. A region-based analysis of the oral microbiome compartment in AD was also performed, and specific differences were identified, along with the absence of differences in bacterial richness and on the functional side. Noteworthy findings demonstrated the decrease in periodontitis-associated bacteria in the AD group. Distinct differences were revealed in the distribution of metabolic pathways between the two study groups. Our study confirms that the oral microbiome is altered in AD. However, a comprehensive picture of the complete composition of the oral microbiome in patients with AD requires further investigation.
Keywords: 16S rRNA; Alzheimer’s disease; Kazakhstan population; metabolic pathways; microbiome; oral cavity; sequencing.
Conflict of interest statement
The authors declare no conflicts of interest.
Figures


Similar articles
-
A distinctive subgingival microbiome in patients with periodontitis and Alzheimer's disease compared with cognitively unimpaired periodontitis patients.J Clin Periodontol. 2024 Jan;51(1):43-53. doi: 10.1111/jcpe.13880. Epub 2023 Oct 18. J Clin Periodontol. 2024. PMID: 37853506
-
Analysis of Salivary Microbiome in Patients with Alzheimer's Disease.J Alzheimers Dis. 2019;72(2):633-640. doi: 10.3233/JAD-190587. J Alzheimers Dis. 2019. PMID: 31594229
-
Distinct blood and oral microbiome profiles reveal altered microbial composition and functional pathways in myocardial infarction patients.Front Cell Infect Microbiol. 2025 Apr 14;15:1506382. doi: 10.3389/fcimb.2025.1506382. eCollection 2025. Front Cell Infect Microbiol. 2025. PMID: 40297611 Free PMC article.
-
The oral microbiome and human health.J Oral Sci. 2017;59(2):201-206. doi: 10.2334/josnusd.16-0856. J Oral Sci. 2017. PMID: 28637979 Review.
-
Gene Sequence Analyses of the Healthy Oral Microbiome in Humans and Companion Animals.J Vet Dent. 2016 Jun;33(2):97-107. doi: 10.1177/0898756416657239. Epub 2016 Aug 6. J Vet Dent. 2016. PMID: 28326980 Review.
Cited by
-
Balancing the Oral-Gut-Brain Axis with Diet.Nutrients. 2024 Sep 22;16(18):3206. doi: 10.3390/nu16183206. Nutrients. 2024. PMID: 39339804 Free PMC article. Review.
-
Oral Biofilm and Its Connection to Alzheimer's Disease.Cureus. 2024 Nov 1;16(11):e72841. doi: 10.7759/cureus.72841. eCollection 2024 Nov. Cureus. 2024. PMID: 39618743 Free PMC article. Review.
-
Association Between Oral Dysbiosis and Alzheimer's Disease: A Systematic Review.J Clin Med. 2025 May 13;14(10):3415. doi: 10.3390/jcm14103415. J Clin Med. 2025. PMID: 40429409 Free PMC article. Review.
-
Gut microbiome-immune interactions and their role in rheumatoid arthritis development.PeerJ. 2024 Jul 11;12:e17477. doi: 10.7717/peerj.17477. eCollection 2024. PeerJ. 2024. PMID: 39006008 Free PMC article.
-
Salivaomics: New Frontiers in Studying the Relationship Between Periodontal Disease and Alzheimer's Disease.Metabolites. 2025 Jun 10;15(6):389. doi: 10.3390/metabo15060389. Metabolites. 2025. PMID: 40559413 Free PMC article. Review.
References
-
- Prince M., Wimo A., Guerchet M., Ali G.-C., Wu Y.-T., Prina M. Alzheimer’s Disease International; [(accessed on 1 November 2015)]. World Alzheimer Report 2015—The Global Impact of Dementia. Available online: https://www.Alz.Co.Uk/Research/WorldAlzheimerReport2015.Pdf.
MeSH terms
Substances
LinkOut - more resources
Full Text Sources
Medical

