

Myocardial Strain for the Differentiation of Myocardial Involvement in the Post-Acute Sequelae of COVID-19-A Multiparametric Cardiac MRI Study
- PMID: 38535768
- PMCID: PMC10974260
- DOI: 10.3390/tomography10030026
Myocardial Strain for the Differentiation of Myocardial Involvement in the Post-Acute Sequelae of COVID-19-A Multiparametric Cardiac MRI Study
Abstract
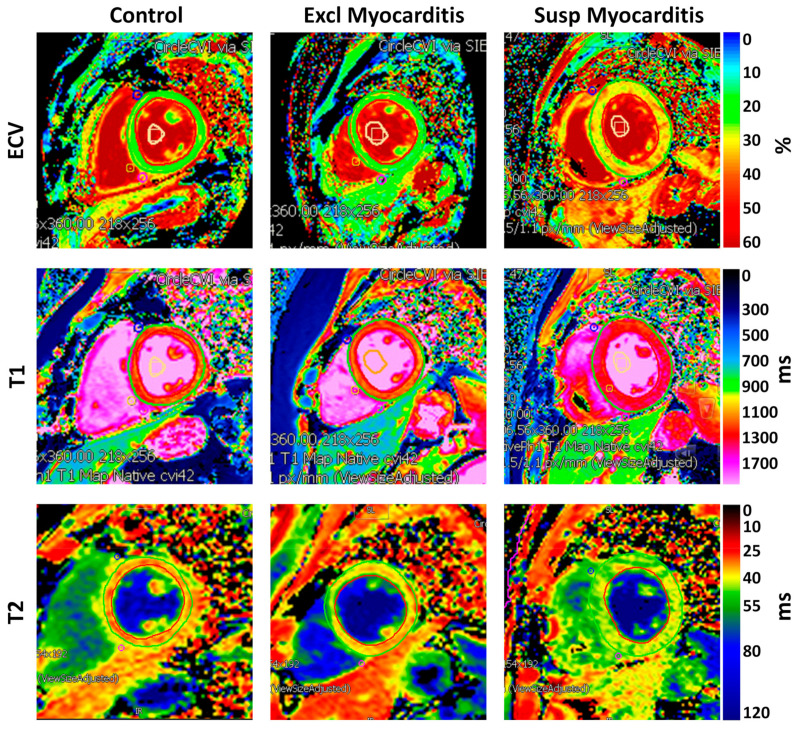
Myocardial involvement was shown to be associated with an unfavorable prognosis in patients with COVID-19, which could lead to fatal outcomes as in myocardial injury-induced arrhythmias and sudden cardiac death. We hypothesized that magnetic resonance imaging (MRI) myocardial strain parameters are sensitive markers for identifying subclinical cardiac dysfunction associated with myocardial involvement in the post-acute sequelae of COVID-19 (PASC). This study evaluated 115 subjects, including 65 consecutive COVID-19 patients, using MRI for the assessment of either post-COVID-19 myocarditis or other cardiomyopathies. Subjects were categorized, based on the results of the MRI exams, as having either 'suspected' or 'excluded' myocarditis. A control group of 50 matched individuals was studied. Along with parameters of global cardiac function, the MRI images were analyzed for measurements of the myocardial T1, T2, extracellular volume (ECV), strain, and strain rate. Based on the MRI late gadolinium enhancement and T1/T2/ECV mappings, myocarditis was suspected in 7 out of 22 patients referred due to concern of myocarditis and in 9 out of 43 patients referred due to concern of cardiomyopathies. The myocardial global longitudinal, circumferential, and radial strains and strain rates in the suspected myocarditis group were significantly smaller than those in the excluded myocarditis group, which in turn were significantly smaller than those in the control group. The results showed significant correlations between the strain, strain rate, and global cardiac function parameters. In conclusion, this study emphasizes the value of multiparametric MRI for differentiating patients with myocardial involvement in the PASC based on changes in the myocardial contractility pattern and tissue structure.
Keywords: COVID-19; MRI; myocarditis; strain; strain rate.
Conflict of interest statement
The authors declare no conflicts of interest.
Figures


Similar articles
-
Photon-counting CT-derived extracellular volume in acute myocarditis: Comparison with cardiac MRI.Diagn Interv Imaging. 2025 Jul-Aug;106(7-8):255-263. doi: 10.1016/j.diii.2025.03.001. Epub 2025 Mar 18. Diagn Interv Imaging. 2025. PMID: 40102107
-
The utility of cardiac magnetic resonance imaging in the diagnosis of adult patients with acute myocarditis: a systematic review and meta-analysis.Int J Cardiol. 2022 Sep 15;363:225-239. doi: 10.1016/j.ijcard.2022.06.047. Epub 2022 Jun 18. Int J Cardiol. 2022. PMID: 35724801
-
Evolving Myocardial Injury in Chronic Kidney Disease Assessed by Multiparameter Magnetic Resonance in a Rabbit Model.J Magn Reson Imaging. 2025 Aug;62(2):444-454. doi: 10.1002/jmri.29768. Epub 2025 Mar 20. J Magn Reson Imaging. 2025. PMID: 40114358
-
Cardiac MRI Findings in COVID-19 Vaccine-Related Myocarditis: A Pooled Analysis of 468 Patients.J Magn Reson Imaging. 2022 Oct;56(4):971-982. doi: 10.1002/jmri.28268. Epub 2022 May 25. J Magn Reson Imaging. 2022. PMID: 35612967 Free PMC article.
-
Evaluation of subclinical myocardial involvement in systemic lupus erythematosus using multiparametric cardiac magnetic resonance imaging.BMC Cardiovasc Disord. 2025 Aug 9;25(1):597. doi: 10.1186/s12872-025-05033-8. BMC Cardiovasc Disord. 2025. PMID: 40783685 Free PMC article.
References
-
- Kravchenko D., Isaak A., Zimmer S., Mesropyan N., Reinert M., Faron A., Pieper C.C., Heine A., Velten M., Nattermann J., et al. Cardiac MRI in Patients with Prolonged Cardiorespiratory Symptoms after Mild to Moderate COVID-19. Radiology. 2021;301:E419–E425. doi: 10.1148/radiol.2021211162. - DOI - PMC - PubMed
-
- Tan Z., Huang S., Mei K., Liu M., Ma J., Jiang Y., Zhu W., Yu P., Liu X. The Prevalence and Associated Death of Ventricular Arrhythmia and Sudden Cardiac Death in Hospitalized Patients With COVID-19: A Systematic Review and Meta-Analysis. Front. Cardiovasc. Med. 2021;8:795750. doi: 10.3389/fcvm.2021.795750. - DOI - PMC - PubMed
-
- Writing C., Gluckman T.J., Bhave N.M., Allen L.A., Chung E.H., Spatz E.S., Ammirati E., Baggish A.L., Bozkurt B., Cornwell W.K., 3rd, et al. 2022 ACC Expert Consensus Decision Pathway on Cardiovascular Sequelae of COVID-19 in Adults: Myocarditis and Other Myocardial Involvement, Post-Acute Sequelae of SARS-CoV-2 Infection, and Return to Play: A Report of the American College of Cardiology Solution Set Oversight Committee. J. Am. Coll. Cardiol. 2022;79:1717–1756. - PMC - PubMed
-
- Zhou F., Yu T., Du R., Fan G., Liu Y., Liu Z., Xiang J., Wang Y., Song B., Gu X., et al. Clinical course and risk factors for mortality of adult inpatients with COVID-19 in Wuhan, China: A retrospective cohort study. Lancet. 2020;395:1054–1062. doi: 10.1016/S0140-6736(20)30566-3. - DOI - PMC - PubMed
Publication types
MeSH terms
Substances
Grants and funding
LinkOut - more resources
Full Text Sources
Medical
