. 2024 May 15;84(10):1699-1718.
doi: 10.1158/0008-5472.CAN-23-1976.

NPEPPS Is a Druggable Driver of Platinum Resistance

Affiliations

NPEPPS Is a Druggable Driver of Platinum Resistance

Robert T Jones et al. Cancer Res. .

Abstract

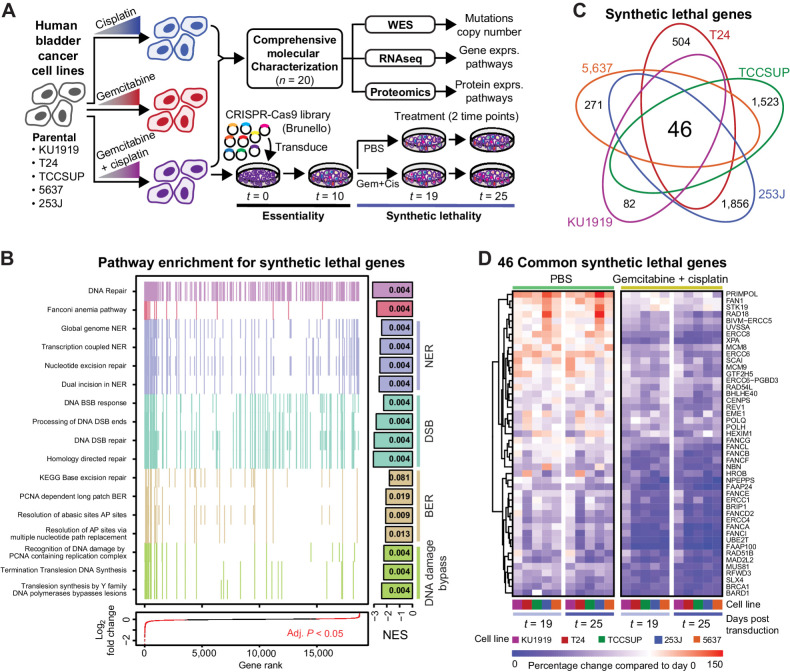
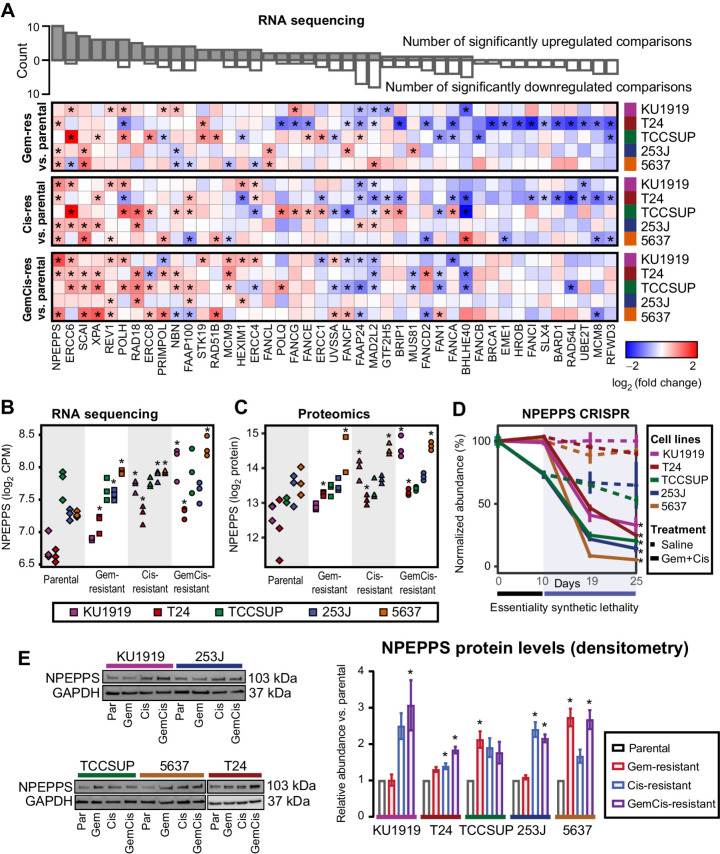
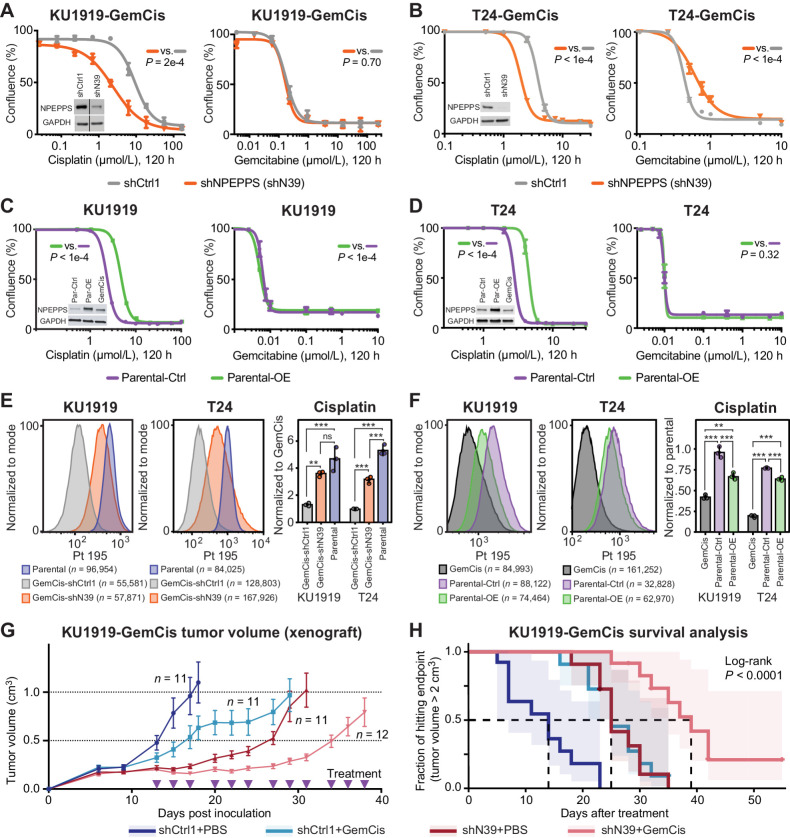
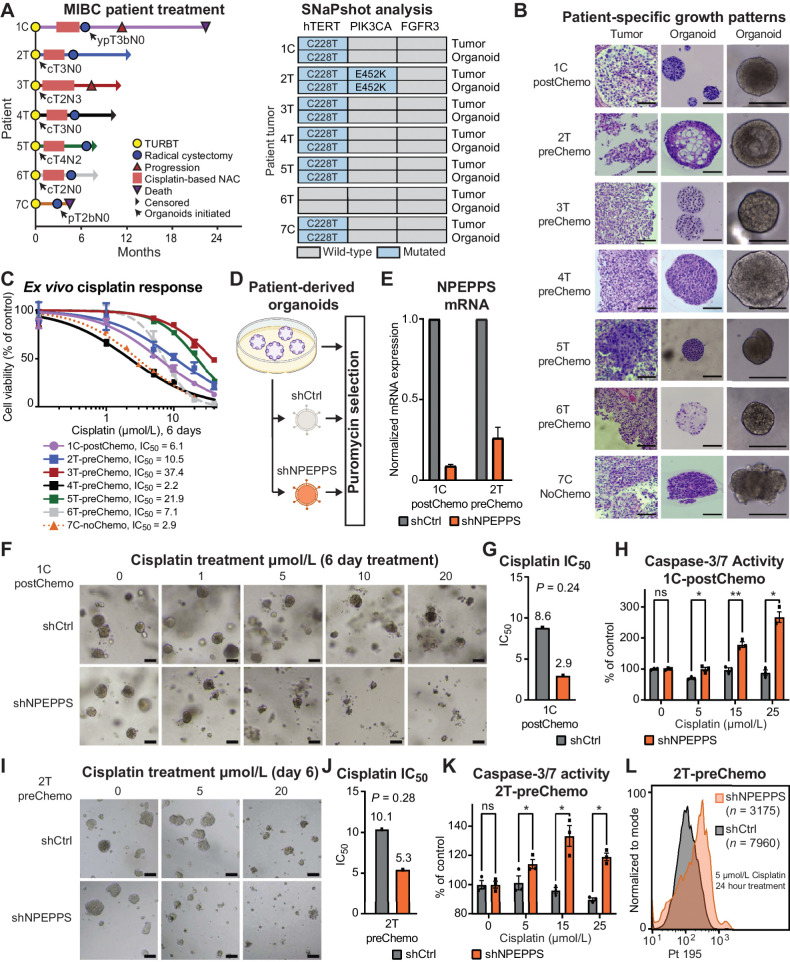
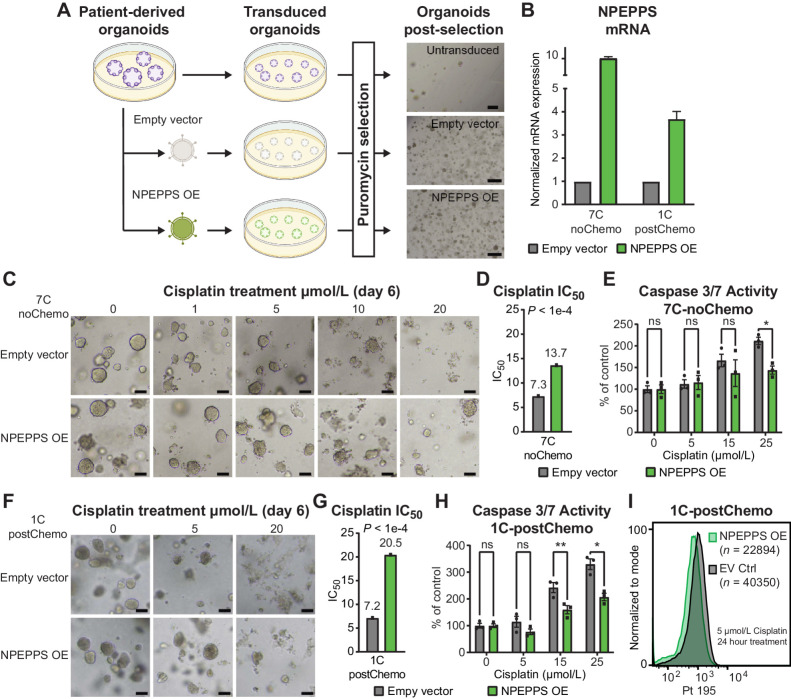
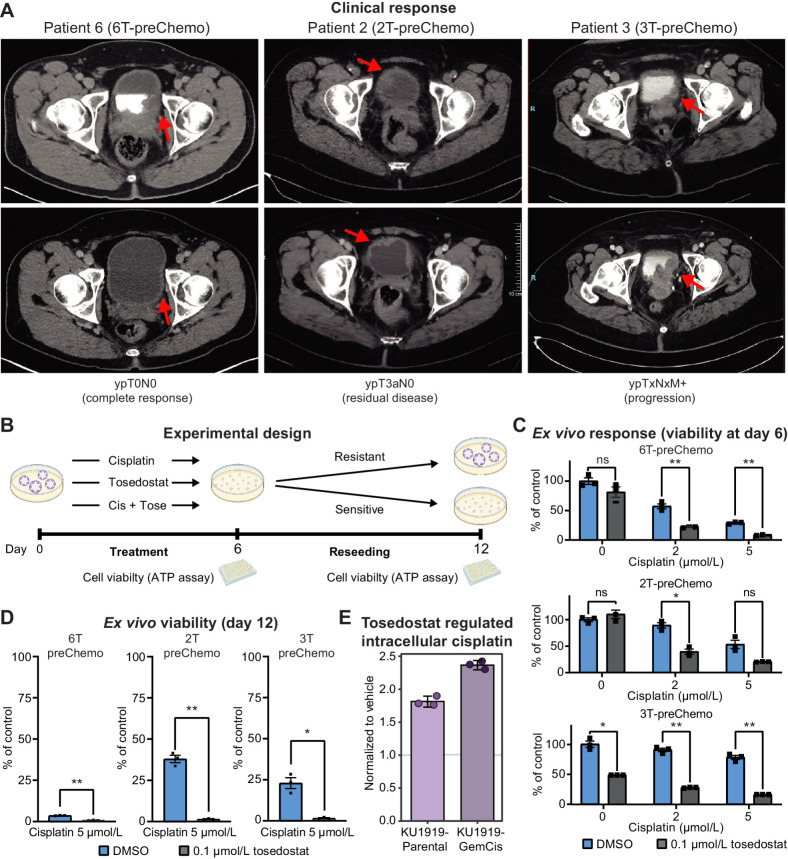
There is an unmet need to improve the efficacy of platinum-based cancer chemotherapy, which is used in primary and metastatic settings in many cancer types. In bladder cancer, platinum-based chemotherapy leads to better outcomes in a subset of patients when used in the neoadjuvant setting or in combination with immunotherapy for advanced disease. Despite such promising results, extending the benefits of platinum drugs to a greater number of patients is highly desirable. Using the multiomic assessment of cisplatin-responsive and -resistant human bladder cancer cell lines and whole-genome CRISPR screens, we identified puromycin-sensitive aminopeptidase (NPEPPS) as a driver of cisplatin resistance. NPEPPS depletion sensitized resistant bladder cancer cells to cisplatin in vitro and in vivo. Conversely, overexpression of NPEPPS in sensitive cells increased cisplatin resistance. NPEPPS affected treatment response by regulating intracellular cisplatin concentrations. Patient-derived organoids (PDO) generated from bladder cancer samples before and after cisplatin-based treatment, and from patients who did not receive cisplatin, were evaluated for sensitivity to cisplatin, which was concordant with clinical response. In the PDOs, depletion or pharmacologic inhibition of NPEPPS increased cisplatin sensitivity, while NPEPPS overexpression conferred resistance. Our data present NPEPPS as a druggable driver of cisplatin resistance by regulating intracellular cisplatin concentrations.

Significance: Targeting NPEPPS, which induces cisplatin resistance by controlling intracellular drug concentrations, is a potential strategy to improve patient responses to platinum-based therapies and lower treatment-associated toxicities.


Figures

Figure 1. Project overview and synthetic lethal screen results. A, Human bladder cancer cell lines were made resistant to cisplatin, gemcitabine, or gemcitabine plus cisplatin through dose escalation. All cell lines were profiled using -omic technologies. The gemcitabine plus cisplatin-resistant cells were subjected to a pooled CRISPR screen to identify synthetic lethal gene-to-drug relationships. B, Aggregate gene set enrichment results for the synthetic lethal screen ranked by log2-fold change across all cell lines reveal DNA damage response and repair pathways. Each tick mark represents a gene in the associated pathway. The bars at the right are normalized enrichment scores (NES), with the FDR-corrected P values reported in the bars. C, The intersection across the CRISPR screen results identified 46 common synthetic lethal genes; all counts and gene annotations are reported in Supplementary Fig. S2. D, The percentage change in the aggregate of the sgRNAs targeting the 46 commonly synthetic lethal genes are reported across PBS or gemcitabine plus cisplatin treatment arms of the CRISPR screen. Cell lines are coded with the same colors throughout all figures.
Figure 1.
Project overview and synthetic lethal screen results. A, Human bladder cancer cell lines were made resistant to cisplatin, gemcitabine, or gemcitabine plus cisplatin through dose escalation. All cell lines were profiled using -omic technologies. The gemcitabine plus cisplatin-resistant cells were subjected to a pooled CRISPR screen to identify synthetic lethal gene-to-drug relationships. B, Aggregate gene set enrichment results for the synthetic lethal screen ranked by log2-fold change across all cell lines reveal DNA damage response and repair pathways. Each tick mark represents a gene in the associated pathway. The bars at the right are normalized enrichment scores (NES), with the FDR-corrected P values reported in the bars. C, The intersection across the CRISPR screen results identified 46 common synthetic lethal genes; all counts and gene annotations are reported in Supplementary Fig. S2. D, The percentage change in the aggregate of the sgRNAs targeting the 46 commonly synthetic lethal genes are reported across PBS or gemcitabine plus cisplatin treatment arms of the CRISPR screen. Cell lines are coded with the same colors throughout all figures.
Figure 2. NPEPPS is identified as a commonly upregulated and synthetic lethal hit. A, Differential gene expression of 43 common synthetic lethal genes as measured by RNA-seq across all cell lines (43 of 46 genes mapped between RNA-seq and the CRISPR screen), comparing the treatment-resistant derivative (Gem-, Cis-, GemCis-resistant) with the associated parental cell line. Asterisks indicate a statistically significant result (moderated t test; *, FDR < 0.05). The bar plot on top is the aggregate count of significant results across all 15 comparisons. Genes are ranked by the count of statistically significant upregulated hits. B–D, RNA-seq (moderated t test compared with parentals; *, FDR < 0.05; B), mass spectrometry proteomics (moderated t test compared with parentals, *, FDR < 0.25; C), and CRISPR screen results for NPEPPS (mean ± SD; moderated t test; *, FDR < 0.05; D). E, Representative immunoblots and densitometry quantification for independent triplicates (mean ± SEM) for NPEPPS in all cell lines. Comparisons using a one-way ANOVA were made to the parental cell lines (*, FDR < 0.05).
Figure 2.
NPEPPS is identified as a commonly upregulated and synthetic lethal hit. A, Differential gene expression of 43 common synthetic lethal genes as measured by RNA-seq across all cell lines (43 of 46 genes mapped between RNA-seq and the CRISPR screen), comparing the treatment-resistant derivative (Gem-, Cis-, GemCis-resistant) with the associated parental cell line. Asterisks indicate a statistically significant result (moderated t test; *, FDR < 0.05). The bar plot on top is the aggregate count of significant results across all 15 comparisons. Genes are ranked by the count of statistically significant upregulated hits. B–D, RNA-seq (moderated t test compared with parentals; *, FDR < 0.05; B), mass spectrometry proteomics (moderated t test compared with parentals, *, FDR < 0.25; C), and CRISPR screen results for NPEPPS (mean ± SD; moderated t test; *, FDR < 0.05; D). E, Representative immunoblots and densitometry quantification for independent triplicates (mean ± SEM) for NPEPPS in all cell lines. Comparisons using a one-way ANOVA were made to the parental cell lines (*, FDR < 0.05).
Figure 3. Genetic inhibition of NPEPPS resensitizes GemCis-resistant cells in vitro and in vivo. A and B, KU1919-GemCis (full immunoblot reported in Supplementary Fig. S4B) or T24-GemCis cells with knockdown of NPEPPS treated with increasing doses of cisplatin or gemcitabine. A total of three technical replicates per dose (mean ± SEM). C and D, KU1919 or T24 parental cells with overexpression of NPEPPS treated with increasing doses of cisplatin or gemcitabine. A total of three technical replicates per dose (mean ± SEM). Independent experiments are reported in Supplementary Fig. S4. P values comparing IC50 values using the sum-of-squares F test. E and F, Intracellular cisplatin levels in KU1919 and T24 cells were measured after 4 hours of 10 μmol/L cisplatin treatment using CyTOF, with the number of live cells analyzed as indicated. Group comparisons were made for triplicate experiments by normalizing intracellular cisplatin levels to the GemCis-resistant or parental cells and compared using a one-way ANOVA (*, FDR < 0.05; **, FDR < 0.01; ***, FDR < 0.001; ns, nonsignificant). G, Tumor volume (mean ± SEM) of KU1919-GemCis xenografts measured over time and across four treatment groups considering nontargeting shRNA controls (shCtrl1), shRNA targeting NPEPPS (shN39), PBS vehicle control (PBS), or gemcitabine plus cisplatin treatment (GemCis). H, Survival analysis of xenograft models with a defined endpoint of a tumor volume > 2 cm3. The log-rank test was applied to test significance.
Figure 3.
Genetic inhibition of NPEPPS resensitizes GemCis-resistant cells in vitro and in vivo. A and B, KU1919-GemCis (full immunoblot reported in Supplementary Fig. S4B) or T24-GemCis cells with knockdown of NPEPPS treated with increasing doses of cisplatin or gemcitabine. A total of three technical replicates per dose (mean ± SEM). C and D, KU1919 or T24 parental cells with overexpression of NPEPPS treated with increasing doses of cisplatin or gemcitabine. A total of three technical replicates per dose (mean ± SEM). Independent experiments are reported in Supplementary Fig. S4. P values comparing IC50 values using the sum-of-squares F test. E and F, Intracellular cisplatin levels in KU1919 and T24 cells were measured after 4 hours of 10 μmol/L cisplatin treatment using CyTOF, with the number of live cells analyzed as indicated. Group comparisons were made for triplicate experiments by normalizing intracellular cisplatin levels to the GemCis-resistant or parental cells and compared using a one-way ANOVA (*, FDR < 0.05; **, FDR < 0.01; ***, FDR < 0.001; ns, nonsignificant). G, Tumor volume (mean ± SEM) of KU1919-GemCis xenografts measured over time and across four treatment groups considering nontargeting shRNA controls (shCtrl1), shRNA targeting NPEPPS (shN39), PBS vehicle control (PBS), or gemcitabine plus cisplatin treatment (GemCis). H, Survival analysis of xenograft models with a defined endpoint of a tumor volume > 2 cm3. The log-rank test was applied to test significance.
Figure 4. NPEPPS depletion sensitizes ex vivo models of bladder cancer to cisplatin. A, Clinical course of MIBC for patients including the point at which the patient tumor-derived organoid lines were generated (black arrow). Notation is the patient number followed by the tumor source, either TURBT, transurethral resection of bladder tumor (T), or radical cystectomy (C). B, Representative brightfield images of organoids together with H&E staining of patient tumor-PDO pairs illustrating patient-specific growth patterns. Most PDOs exhibited round and dense structures, as represented by 1C-postChemo (Chemo, cisplatin-based chemotherapy regimen), although there was notable variation in growth and morphology. Scale bar, 100 μm. C, Ex vivo response of all seven PDOs treated with increasing concentrations of cisplatin. Cell viability, as a percentage of untreated control, was measured using CellTiter-Glo. The fitted dose-response curves represent viability corresponding to three biological replicate experiments and data are represented as mean ± SEM. D, Experimental workflow for lentiviral, shRNA-mediated NPEPPS depletion in PDOs and representative images after puromycin selection. E, NPEPPS expression was evaluated by RT-PCR in shNPEPPS and shCtrl PDO lines normalized to cyclophilin. Error bars, mean ± SD. F, Representative brightfield images of the control and NPEPPS-depleted 1C-postChemo PDO treated with the indicated cisplatin concentrations. Scale bar, 400 μm. G, IC50 values estimated from dose curves for cell viability measured through CellTiter-Glo (biological triplicates; mean ± SEM). H, Relative caspase-3 and -7 activity in cisplatin-treated shCtrl and shNPEPPS PDOs. Caspase activity was measured by Caspase-Glo and normalized to untreated PDOs. (biological triplicates; mean ± SEM). I, J, and K, Replicate experimental conditions as in F, G, and H, but with the 2T-preChemo PDO. L, Intracellular cisplatin levels were measured after 24 hours of 5 μmol/L cisplatin treatment using CyTOF, with the number of live cells analyzed as indicated. *, P < 0.05; **, P < 0.01; ns, nonsignificant.
Figure 4.
NPEPPS depletion sensitizes ex vivo models of bladder cancer to cisplatin. A, Clinical course of MIBC for patients including the point at which the patient tumor-derived organoid lines were generated (black arrow). Notation is the patient number followed by the tumor source, either TURBT, transurethral resection of bladder tumor (T), or radical cystectomy (C). B, Representative brightfield images of organoids together with H&E staining of patient tumor-PDO pairs illustrating patient-specific growth patterns. Most PDOs exhibited round and dense structures, as represented by 1C-postChemo (Chemo, cisplatin-based chemotherapy regimen), although there was notable variation in growth and morphology. Scale bar, 100 μm. C,Ex vivo response of all seven PDOs treated with increasing concentrations of cisplatin. Cell viability, as a percentage of untreated control, was measured using CellTiter-Glo. The fitted dose-response curves represent viability corresponding to three biological replicate experiments and data are represented as mean ± SEM. D, Experimental workflow for lentiviral, shRNA-mediated NPEPPS depletion in PDOs and representative images after puromycin selection. E,NPEPPS expression was evaluated by RT-PCR in shNPEPPS and shCtrl PDO lines normalized to cyclophilin. Error bars, mean ± SD. F, Representative brightfield images of the control and NPEPPS-depleted 1C-postChemo PDO treated with the indicated cisplatin concentrations. Scale bar, 400 μm. G, IC50 values estimated from dose curves for cell viability measured through CellTiter-Glo (biological triplicates; mean ± SEM). H, Relative caspase-3 and -7 activity in cisplatin-treated shCtrl and shNPEPPS PDOs. Caspase activity was measured by Caspase-Glo and normalized to untreated PDOs. (biological triplicates; mean ± SEM). I, J, and K, Replicate experimental conditions as in F, G, and H, but with the 2T-preChemo PDO. L, Intracellular cisplatin levels were measured after 24 hours of 5 μmol/L cisplatin treatment using CyTOF, with the number of live cells analyzed as indicated. *, P < 0.05; **, P < 0.01; ns, nonsignificant.
Figure 5. Ex vivo NPEPPS overexpression enhances cisplatin resistance. A, Schematic representation of the experimental procedure for NPEPPS overexpression in PDOs and representative images after puromycin selection. Scale bar, 400 μm. B, NPEPPS expression was evaluated by RT-PCR in empty vector and NPEPPS overexpression PDO lines normalized to cyclophilin. Error bars, mean ± SD. C, Representative brightfield images of empty vector control and NPEPPS-overexpressing 7C-noChemo PDO treated with the indicated cisplatin concentrations. Scale bar, 400 μm. D, IC50 values estimated from dose curves for cell viability measured through CellTiter-Glo (biological triplicates; mean ± SEM). E, Relative caspase-3 and -7 activity in cisplatin-treated empty vector control and NPEPPS-overexpressing PDOs. Caspase activity was measured by Caspase-Glo and normalized to untreated PDOs (biological triplicates; mean ± SEM). F, G, and H, Replicate experimental conditions as in C, D, and E, but with the 1C-postChemo PDO. I, Intracellular cisplatin levels were measured after 24 hours of 5 μmol/L cisplatin treatment using CyTOF, with the number of live cells analyzed as indicated. *, P < 0.05; **, P < 0.01; ns, nonsignificant.
Figure 5.
Ex vivo NPEPPS overexpression enhances cisplatin resistance. A, Schematic representation of the experimental procedure for NPEPPS overexpression in PDOs and representative images after puromycin selection. Scale bar, 400 μm. B,NPEPPS expression was evaluated by RT-PCR in empty vector and NPEPPS overexpression PDO lines normalized to cyclophilin. Error bars, mean ± SD. C, Representative brightfield images of empty vector control and NPEPPS-overexpressing 7C-noChemo PDO treated with the indicated cisplatin concentrations. Scale bar, 400 μm. D, IC50 values estimated from dose curves for cell viability measured through CellTiter-Glo (biological triplicates; mean ± SEM). E, Relative caspase-3 and -7 activity in cisplatin-treated empty vector control and NPEPPS-overexpressing PDOs. Caspase activity was measured by Caspase-Glo and normalized to untreated PDOs (biological triplicates; mean ± SEM). F,G, and H, Replicate experimental conditions as in C, D, and E, but with the 1C-postChemo PDO. I, Intracellular cisplatin levels were measured after 24 hours of 5 μmol/L cisplatin treatment using CyTOF, with the number of live cells analyzed as indicated. *, P < 0.05; **, P < 0.01; ns, nonsignificant.
Figure 6. NPEPPS inhibitor tosedostat overcomes cisplatin resistance ex vivo. A, Clinical response to cisplatin-based chemotherapy in three MIBC patients. Pathologic preoperative chemotherapy response is annotated according to pathologic stage following radical cystectomy or metastatic biopsy. Response is illustrated by pre- (top) and posttreatment (bottom) computerized tomography scans. Red arrows, bladder wall thickening and subsequence response. B, Experimental design for treating PDOs with cisplatin and tosedostat alone or in combination. PDOs were withdrawn from treatment, dissociated into single cells, and reseeded after 6 days. Cell viability was measured using CellTiter-Glo at days 6 and 12. C, Ex vivo response of PDOs treated with the indicated concentrations of cisplatin with or without the addition of tosedostat. After 6 days, viability was measured by CellTiter-Glo (biological triplicates; mean ± SEM). D, Cisplatin response in reseeded organoids treated at the indicated concentrations of drug, with viability measured by CellTiter-Glo (biological triplicates; mean ± SEM). E, CyTOF results for KU1919-Parental or -GemCis cells treated with 1 μmol/L tosedostat or DMSO for 72 hours, followed by 10 μmol/L cisplatin for 4 hours. Median values of three replicates were normalized to the vehicle control treatment. One-way ANOVA; *, P < 0.05; **, P < 0.005; ns, nonsignificant.
Figure 6.
NPEPPS inhibitor tosedostat overcomes cisplatin resistance ex vivo. A, Clinical response to cisplatin-based chemotherapy in three MIBC patients. Pathologic preoperative chemotherapy response is annotated according to pathologic stage following radical cystectomy or metastatic biopsy. Response is illustrated by pre- (top) and posttreatment (bottom) computerized tomography scans. Red arrows, bladder wall thickening and subsequence response. B, Experimental design for treating PDOs with cisplatin and tosedostat alone or in combination. PDOs were withdrawn from treatment, dissociated into single cells, and reseeded after 6 days. Cell viability was measured using CellTiter-Glo at days 6 and 12. C,Ex vivo response of PDOs treated with the indicated concentrations of cisplatin with or without the addition of tosedostat. After 6 days, viability was measured by CellTiter-Glo (biological triplicates; mean ± SEM). D, Cisplatin response in reseeded organoids treated at the indicated concentrations of drug, with viability measured by CellTiter-Glo (biological triplicates; mean ± SEM). E, CyTOF results for KU1919-Parental or -GemCis cells treated with 1 μmol/L tosedostat or DMSO for 72 hours, followed by 10 μmol/L cisplatin for 4 hours. Median values of three replicates were normalized to the vehicle control treatment. One-way ANOVA; *, P < 0.05; **, P < 0.005; ns, nonsignificant.

References

    1. Dilruba S, Kalayda GV. Platinum-based drugs: past, present and future. Cancer Chemother Pharmacol 2016;77:1103–24. - PubMed
    1. Rottenberg S, Disler C, Perego P. The rediscovery of platinum-based cancer therapy. Nat Rev Cancer 2021;21:37–50. - PubMed
    1. Tran L, Xiao J-F, Agarwal N, Duex JE, Theodorescu D. Advances in bladder cancer biology and therapy. Nat Rev Cancer 2021;21:104–21. - PMC - PubMed
    1. Sung H, Ferlay J, Siegel RL, Laversanne M, Soerjomataram I, Jemal A, et al. . Global cancer statistics 2020: GLOBOCAN estimates of incidence and mortality worldwide for 36 cancers in 185 countries. CA Cancer J Clin 2021;71:209–49. - PubMed
    1. Dyrskjøt L, Hansel DE, Efstathiou JA, Knowles MA, Galsky MD, Teoh J, et al. . Bladder cancer. Nat Rev Dis Primers 2023;9:58. - PMC - PubMed

LinkOut - more resources