. 2024 Mar 27:12:RP90632.
doi: 10.7554/eLife.90632.

Synaptotagmin 7 docks synaptic vesicles to support facilitation and Doc2α-triggered asynchronous release

Affiliations

Synaptotagmin 7 docks synaptic vesicles to support facilitation and Doc2α-triggered asynchronous release

Zhenyong Wu et al. Elife. .

Abstract

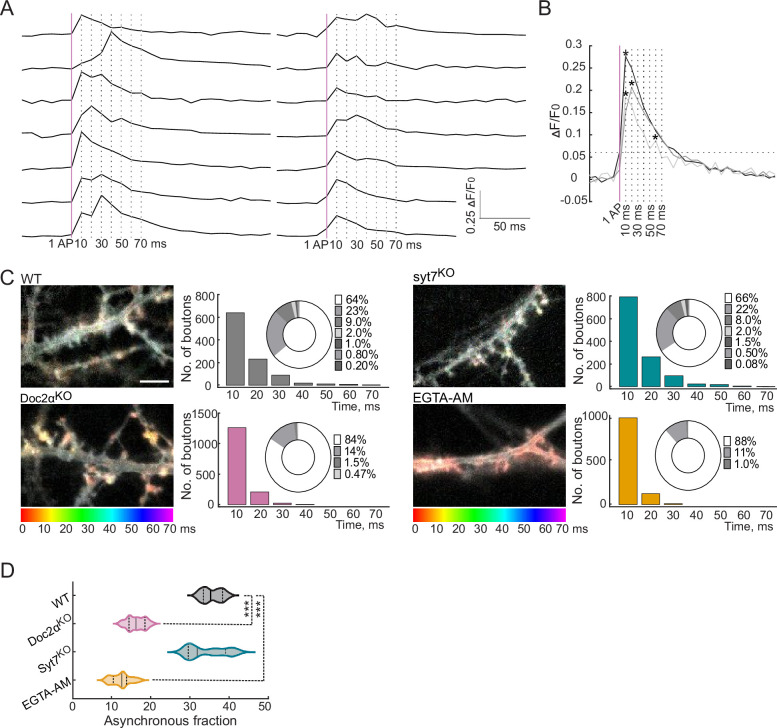
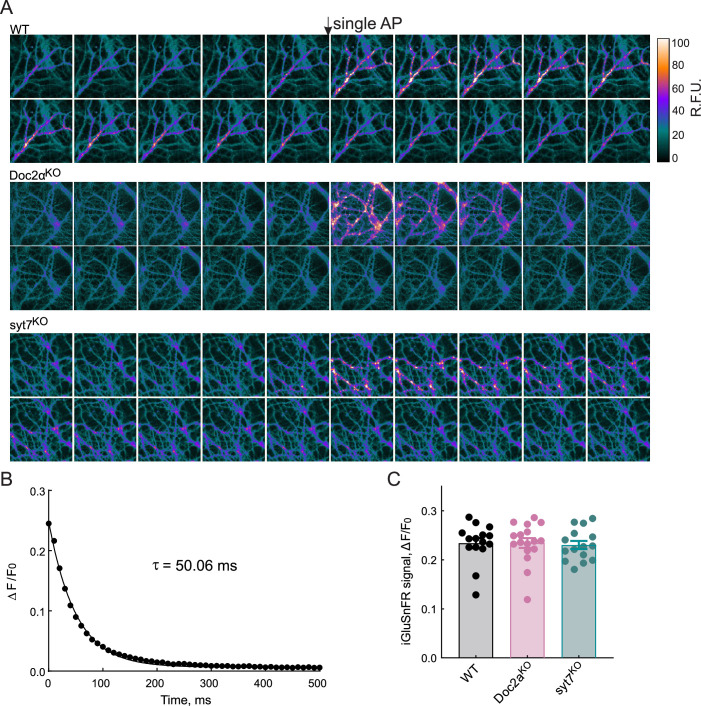
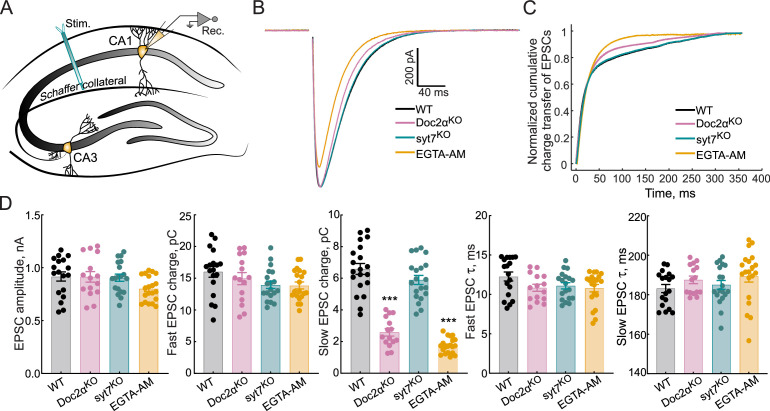
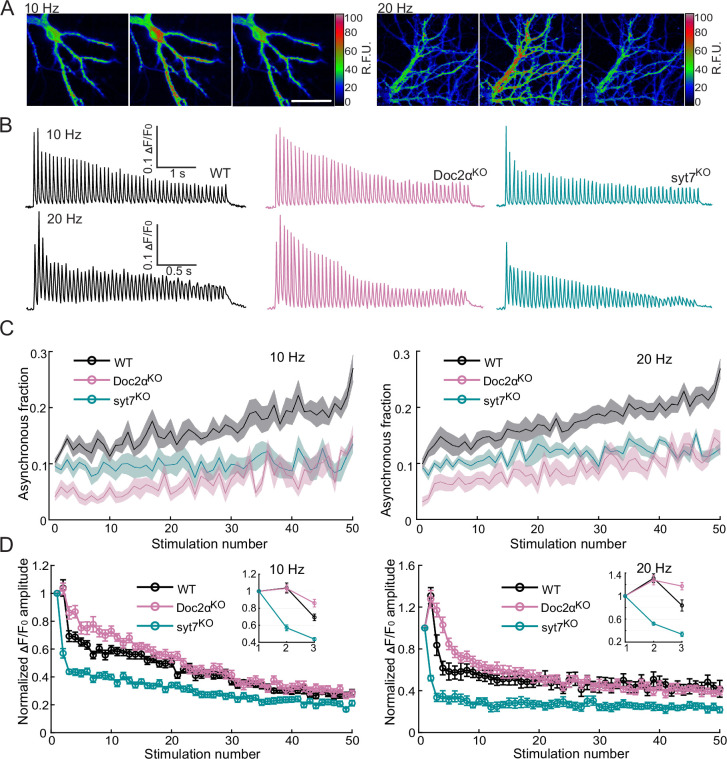
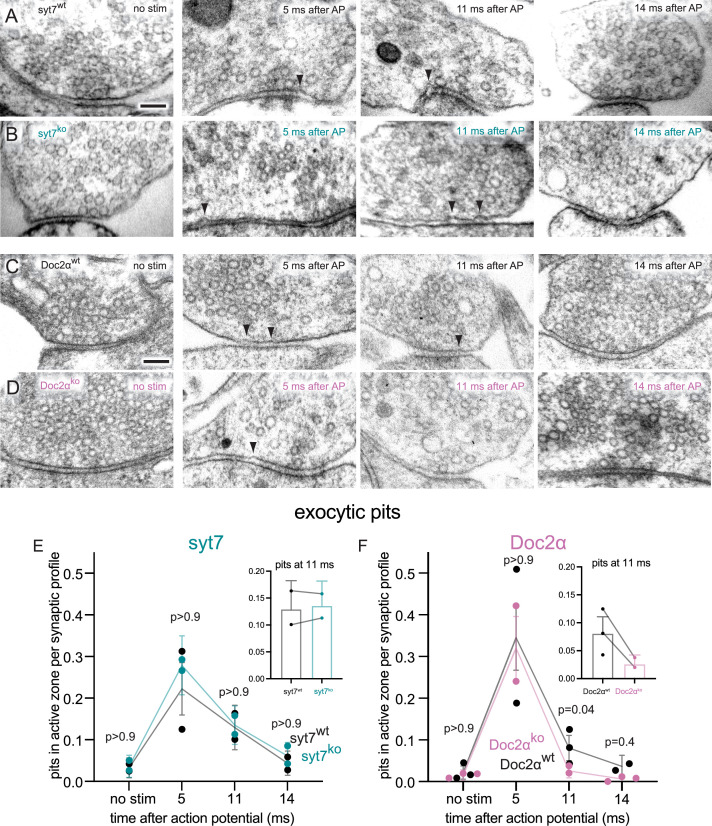
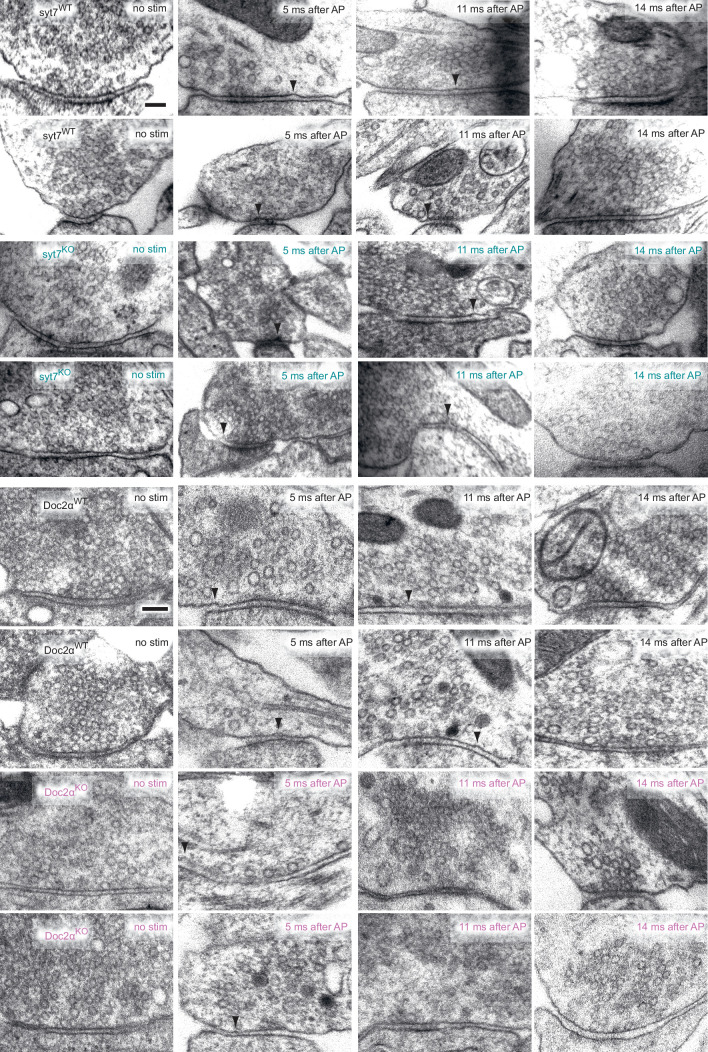
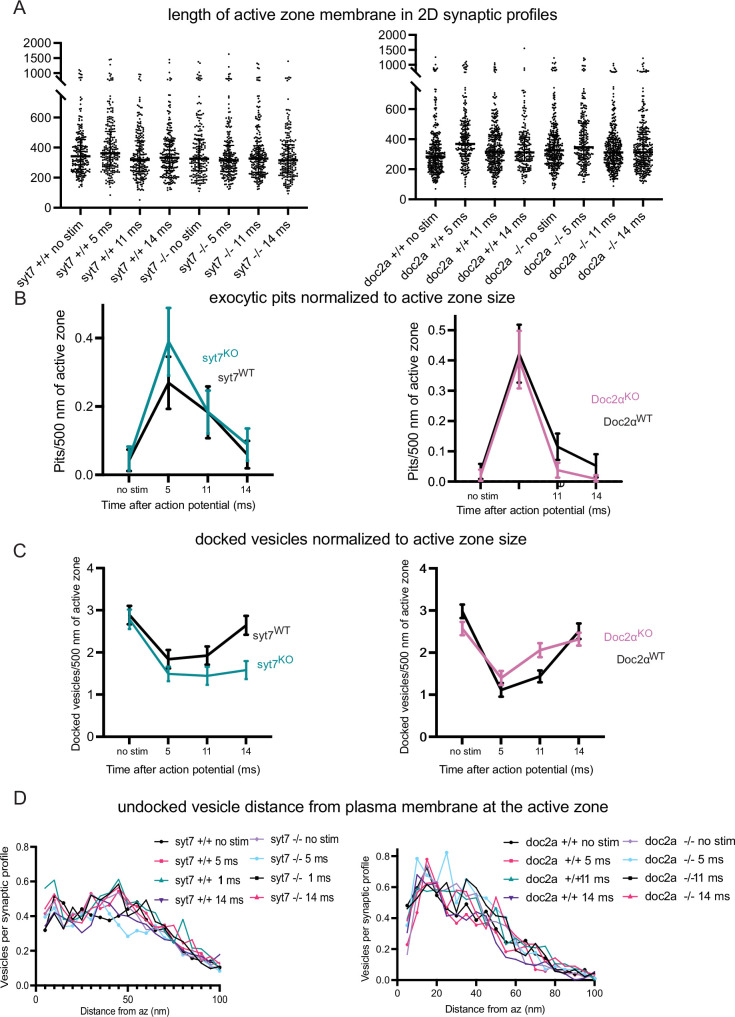
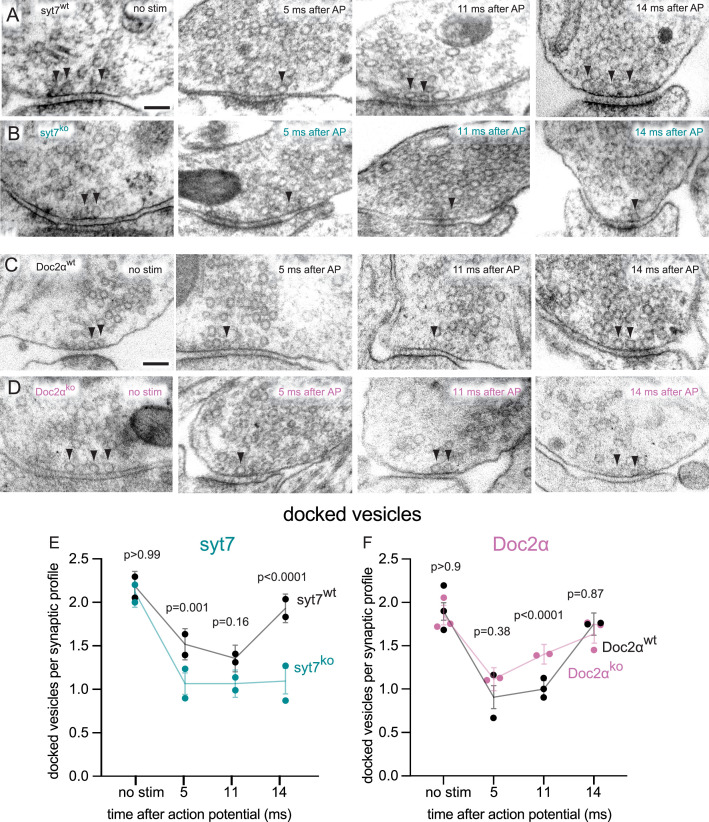
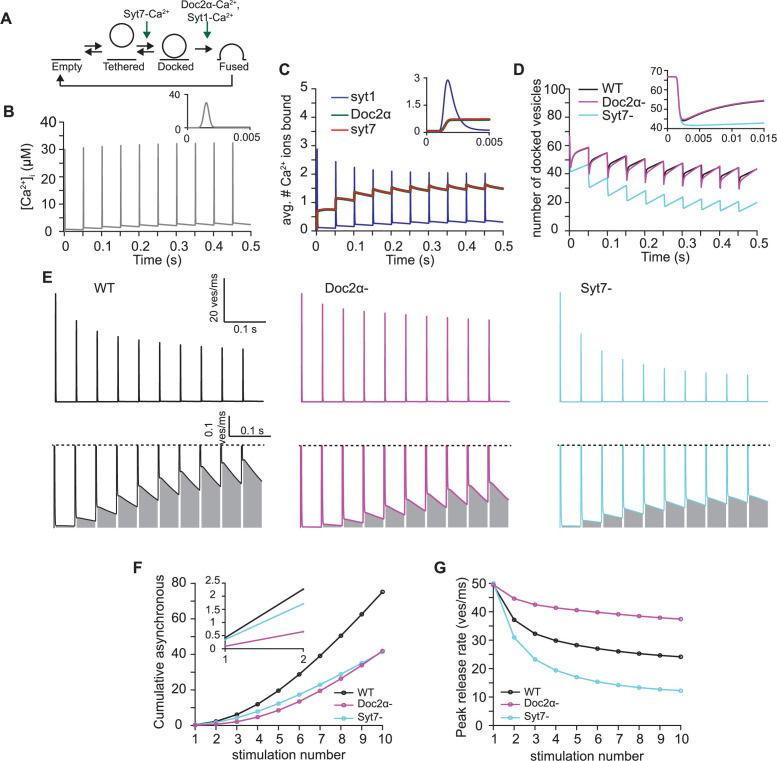
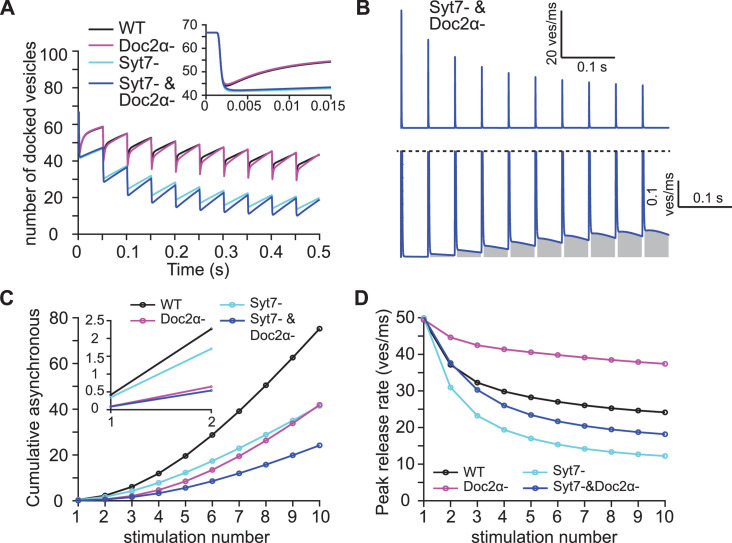
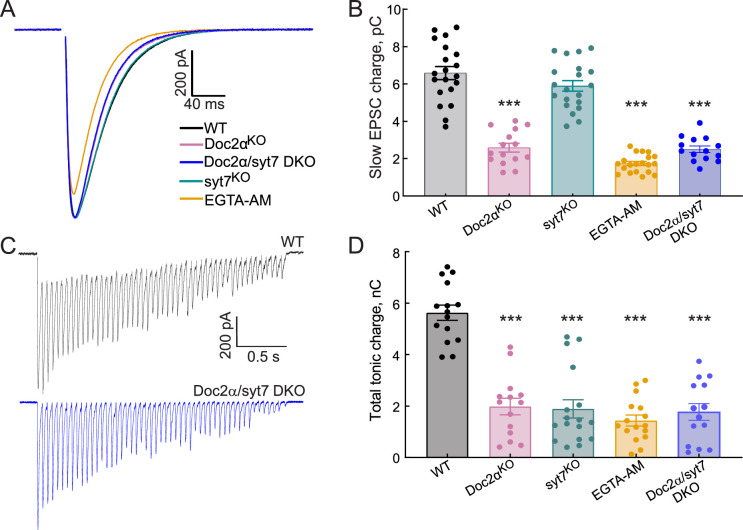
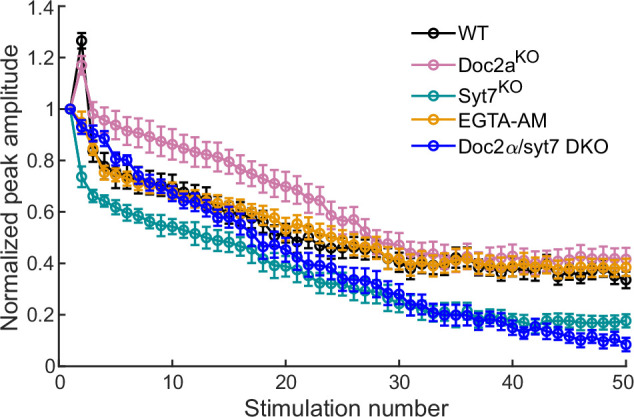
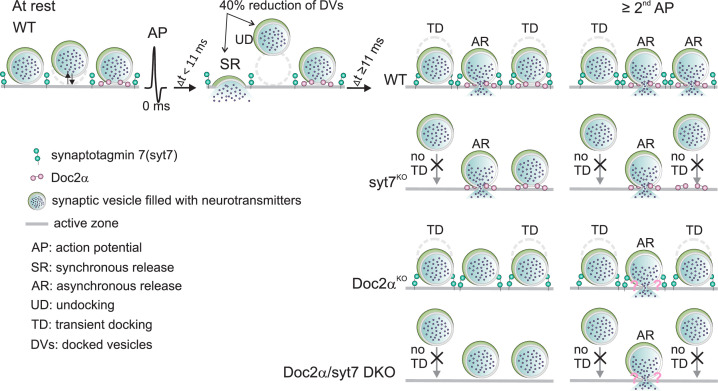
Despite decades of intense study, the molecular basis of asynchronous neurotransmitter release remains enigmatic. Synaptotagmin (syt) 7 and Doc2 have both been proposed as Ca2+ sensors that trigger this mode of exocytosis, but conflicting findings have led to controversy. Here, we demonstrate that at excitatory mouse hippocampal synapses, Doc2α is the major Ca2+ sensor for asynchronous release, while syt7 supports this process through activity-dependent docking of synaptic vesicles. In synapses lacking Doc2α, asynchronous release after single action potentials is strongly reduced, while deleting syt7 has no effect. However, in the absence of syt7, docked vesicles cannot be replenished on millisecond timescales. Consequently, both synchronous and asynchronous release depress from the second pulse onward during repetitive activity. By contrast, synapses lacking Doc2α have normal activity-dependent docking, but continue to exhibit decreased asynchronous release after multiple stimuli. Moreover, disruption of both Ca2+ sensors is non-additive. These findings result in a new model whereby syt7 drives activity-dependent docking, thus providing synaptic vesicles for synchronous (syt1) and asynchronous (Doc2 and other unidentified sensors) release during ongoing transmission.

Keywords: asynchronous release; cell biology; iGluSnFR; mouse; neuroscience; short-term plasticity; synaptic vesicle docking; synaptotagmin; zap-and-freeze.


Conflict of interest statement

ZW, GK, MB, SR, KI, AW, EC, SW No competing interests declared

Figures

Figure 1.
Figure 1.. Doc2α, and not syt7, drives most of the asynchronous glutamate release triggered by a single action potential (AP) in cultured hippocampal neurons.
(A) Raw iGluSnFR (A184V) traces from cultured WT mouse hippocampal neurons. A single AP was applied, and images were captured every 10 ms. Peaks that appeared at the first 10 ms time point were defined as synchronous release events; peaks that appeared at later time points were defined as asynchronous release (AR) events. The vertical magenta line indicates the stimulus, and the vertical dashed lines indicate the imaging frames at 10, 20, 30, 40, 50, 60, and 70 ms. (B) Three representative traces illustrate synchronous release and AR peaks. The horizontal dashed line is five times the standard deviation of the baseline noise. Individual peaks are indicated by asterisks. Traces of single synchronous (black) and asynchronous peaks (gray), along with a trace in which both kinds of events occurred (light gray), are shown. (C) Color coding and binning the temporal changes in iGluSnFR signals within 70 ms after a single stimulus for WT (n = 15 fields of view/coverslips; from four independent litters), Doc2αKO (n = 17; from five independent litters), syt7KO (n = 15; from four independent litters), and EGTA-AM-treated neurons (n = 18; from four independent litters). The temporal color code is red (initiation of stimulus) to purple (70 ms after the stimulus); scale bar, 5 µm. Histograms of iGluSnFR (ΔF/F0) peaks were generated using 10 ms binning. Samples were color-coded as follows: WT (gray), Doc2αKO (reddish), syt7KO (cyan), and EGTA-AM (orange)-treated neurons. The histograms include donut graph insets to display the fraction of release in each bin. (D) Violin plot showing the % AR (release after 10 ms) for each condition. ns are same number of fields of view as in (C). Solid bar: median, dotted bars: 25th and 75th percentiles, ends of the violin: minimum and maximum. n = boutons. One-way ANOVA, followed by Dunnett’s test, was used to compare mutants against WT. ***p<0.001. Exact p-values: Doc2αKO: <0.0001, syt7KO: 0.39, EGTA-AM: <0.0001. All data, summary statistics, test statistics, and p-values are listed in Figure 1—source data 1.
Figure 1—figure supplement 1.
Figure 1—figure supplement 1.. Expression of iGluSnFR in cultured hippocampal neurons.
(A) Representative serial frames of iGluSnFR fluorescence from the WT, Doc2αKO, and syt7KO neurons, before and after eliciting a single action potential (AP; arrow); the heatmap is shown on the right. (B) The relaxation rate of iGluSnFR (A184V). Averaged iGluSnFR signals from 254 boutons from WT hippocampal neurons after a single stimulus (filled circles). Data were fitted with a single exponential function (solid line), and the decay τ value is indicated. (C) iGluSnFR peak amplitudes (ΔF/F0 at 10 ms) after a single AP, from WT (n = 15 fields of view/coverslips; from four independent litters), Doc2a KO (n = 17; from five independent litters), and syt7 KO (n = 15; from four independent litters) neurons. Error bars are mean ± the standard error of the mean. All data, summary statistics, and p-values are listed in Figure 1—figure supplement 1—source data 1.
Figure 2.
Figure 2.. Doc2α, and not syt7, drives most of the asynchronous release (AR) triggered by a single action potential at Schaffer collaterals.
(A) Schematic of the recording scheme of hippocampal slices showing stimulation of the Schaffer collateral fibers and whole-cell patch-clamp recordings of CA1 pyramidal neurons. (B) Averaged traces of evoked excitatory postsynaptic currents (EPSCs) recorded from WT (n = 18 recordings; from five independent litters), Doc2αKO (n = 15; from four independent litters), syt7KO (n = 19; from six independent litters), and EGTA-AM-treated neurons (n = 20; from four independent litters). (C) Normalized cumulative EPSC charge transfer over 400 ms. (D) Bar graphs, from corresponding groups in panels (B–C), summarizing the amplitude, fast and slow EPSC charge, and the fast and slow EPSC t-values. Error bars are mean ± standard error of the mean. One-way ANOVA, followed by Dunnett’s test, was used to compare mutants against WT. ** and *** indicate p< 0.01 and p<0.001. Exact p-value for syt7 slow EPSC charge = 0.15. All data, summary statistics, and p-values are listed in Figure 2—source data 1.
Figure 2—figure supplement 1.
Figure 2—figure supplement 1.. Recording setup for electrophysiology of acute hippocampal slices.
(A) Representative hippocampal slice from a WT mouse. (B) A stimulating electrode was placed in the Schaffer collateral pathway and transmission to CA1 neurons was monitored via whole-cell patch-clamp recordings.
Figure 3.
Figure 3.. Both Doc2α and syt7 contribute to asynchronous glutamate release during train stimulation but have opposite effects on short-term plasticity in cultured hippocampal neurons.
(A) Representative iGluSnFR images from trains of 50 action potentials (APs) at 10 Hz (left) or 20 Hz (right). Images on the left, middle, and right each show a sum of 20 frames (200 ms) before, during, and after stimulation, respectively; scale bar, 40 µm. (B) Representative iGluSnFR responses from WT (10 Hz: n = 12 fields of view/coverslips; from three independent litters; 20 Hz: n = 17; from four independent litters), Doc2αKO (n = 14; from four independent litters; 20 Hz: n = 16; from four independent litters), and syt7KO neurons (n = 15; from three independent litters; 20 Hz: n = 12; from three independent litters), stimulated at 10 Hz (top) and 20 Hz (bottom). (C) The asynchronous release (AR) fraction was defined as iGluSnFR peaks that occurred after the first 10 ms time point (i.e., from the 20 ms time point onward), divided by the total number of peaks that occurred at all time points between each stimulus. These data are plotted as a function of the stimulus number. Mean values (bold lines) ± standard error of the mean (shaded regions) are indicated. (D) Plot of the normalized amplitude (with 1 being the amplitude of the first response) of iGluSnFR signals evoked by 50 stimuli at 10 and 20 Hz. Dots and error bars are mean ± standard error of the mean. Insets show the first three points of each trace on expanded scales.
Figure 3—figure supplement 1.
Figure 3—figure supplement 1.. Additional raw iGluSnFR traces during 20 Hz train stimulation, and paired-pulse ratios from the first two responses at 10 and 20 Hz.
(A) Raw 20 Hz iGluSnFR traces from cultured WT, Doc2αKO, and syt7KO hippocampal neurons. In the lower panel, responses from the last five stimuli are overlayed, revealing a qualitative reduction in asynchronous release (AR) peaks in Doc2α and syt7 KO neurons. (B) Mean paired-pulse ratios (peak iGluSnFR signal from the second stimulus divided by peak signal from the first stimulus during the 10 Hz and 20 Hz train stimulation) at different interstimulus intervals (Δt) recorded in cultured hippocampal neurons isolated from WT (10 Hz: n = 12 fields of view/coverslips; from three independent litters; 20 Hz: n = 17; from four independent litters), Doc2αKO (n = 14; from four independent litters; 20 Hz: n = 16; from four independent litters), and syt7KO (n = 15; from three independent litters; 20 Hz: n = 12; from three independent litters) mice. Data points here are mean values ± SEM. One-way ANOVA, followed by Dunnett’s test, was used to compare mutants against WT. ***p<0.001. Exact p-values for Doc2αKO: at 50 ms = 0.92, at 100 ms > 0.99. Summary statistics and p-values are listed in Figure 3—figure supplement 1—source data 1.
Figure 3—figure supplement 2.
Figure 3—figure supplement 2.. Spatial distribution of asynchronous release (AR), measured via iGluSnFR imaging, in cultured hippocampal neurons.
Schematic illustrating AR distribution patterns at axon terminals; the large shaded gray circles depict the soma; small circles depict presynaptic boutons. For this analysis, only AR was analyzed using data collected from 923 ROIs that were initially identified because they yielded at least one evoked response (AR, synchronous, or both) in the first three stimuli from a 10 Hz train. Boutons that exhibit AR, for the indicated position and stimulus, are orange; open circles indicate boutons that did not exhibit AR at the indicated position or stimulus. All of the AR distribution patterns in each of the four subpanels are from the same boutons at the same fixed positions. For convenience, only 12 boutons are shown, and these are numbered 1–12 to emphasize that the same boutons are analyzed in each of the sub-panels. The organization of these boutons was artificially grouped to some extent to better visualize the patterns of release between each stimulus. The bottom-left table quantifies the ratio of AR patterns: AR to AR, AR to no AR, no AR to AR, and no AR to no AR, from the first to the second stimulus. The same analysis, but between the second and third stimulus, is provided in the bottom-right table. The distribution of AR to target cells in the first versus the second pulses is similar to the distribution between the third and fourth pulses. These data suggest that AR during the first pulse, while molecularly distinct, does not segregate to different target cells compared to AR elicited by subsequent stimuli. (A) Table summarizing the fraction of boutons with the same responses after the initial three stimuli. AR only; represents pure AR that successively occurred three times at the same bouton, in the absence of SR. Synchronous release (SR) only; indicates boutons that exhibited purely SR during the first three stimuli, in the absence of AR. AR; reflects AR that occurred at the same bouton for all three successive stimuli regardless of the presence or absence of SR. Interpretation: in the main text, we noted that spatial segregation of AR during the first two responses was not observed. Expanding on this further, the same pattern was observed when comparing the second and third responses. Moreover, nearly 70% of all responding boutons exhibited AR at least once during the first three stimuli in a train, either with or without a concurrent synchronous component (A). So, even though AR presents only a third of the charge transfer in our experiments (Figures 1C, E, 2D), this mode of release is widespread. In addition, 40% of all responding boutons analyzed exhibited AR in all three of the initial stimuli in a train, and approximately half of the boutons that had AR after the first stimulus also yielded AR during the second stimulus (B). In contrast, only 6 and 8% of boutons exhibited pure AR or synchronous responses, respectively, in response to all three initial stimuli in a train (B). While our data argue against the segregation of AR during the first response, it remains possible that further analysis, of much larger data sets, using sensitive algorithms, could reveal more subtle differences that might have escaped detection.
Figure 4.
Figure 4.. Both Doc2α and syt7 contribute to asynchronous release (AR) during train stimulation but have opposite effects on short-term plasticity at Schaffer collaterals.
(A) Representative excitatory postsynaptic currents (EPSCs) triggered by 20 Hz stimulus trains using WT, Doc2αKO, syt7KO, and EGTA-AM-treated neurons. The shaded gray areas indicate the tonic charge component that likely corresponds to AR. (B) The peak amplitude of each EPSC during the train was normalized to the first EPSC from WT (n = 12 recordings; from four independent litters), Doc2αKO (n = 11; from three independent litters), syt7KO (n = 10; from three independent litters), and EGTA-AM-treated neurons (n = 11, from three independent litters). Dots and error bars are mean ± standard error of the mean. (C) Bar graph showing the total tonic charge transfer (indicated by the gray areas in (A)), as a measure of cumulative AR from the train, from WT, Doc2αKO, syt7KO, and EGTA-AM-treated hippocampal slices. Error bars are mean ± standard error of the mean. One-way ANOVA, followed by Dunnett’s test, was used to compare mutants against WT. ***p<0.001. All data, summary statistics, and p-values are listed in Figure 4—source data 1.
Figure 5.
Figure 5.. Doc2α, but not syt7, is important for asynchronous synaptic vesicle fusion triggered by a single action potential (AP) in cultured hippocampal neurons.
(A–D) Example transmission electron micrographs of syt7WT (A), syt7KO (B), Doc2αWT (C), and Doc2αKO (D) synapses frozen at the indicated time points after an AP or without stimulation (no stim). Arrows indicate pits in the active zone, which are presumed to be synaptic vesicles that have fused with the plasma membrane. (E) The number of pits in the active zone per synaptic profile (part of the synapse captured in a 2D section) in syt7 wild-type littermate controls and knockouts. Error bars indicate 95% confidence interval of the mean for all data pooled together; each dot indicates the mean from a single biological replicate. Inset: same data from the 11 ms time point from each genotype, with lesser y-axis range; lines indicate data are from the same biological replicate (experiment), not that they are paired. p-Values are from comparisons between wild-type controls (nostim, n = 217; 5 ms, n = 216; 11 ms, n = 217; 14 ms, n = 230 synaptic profiles) and knockouts (no stim, n = 193; 5 ms, n = 215; 11 ms, n = 230; 14 ms, n = 212 synaptic profiles) frozen at the same time point. (F) Same as (E), but for Doc2α wild-type controls (no stim, n = 327; 5 ms, n = 229; 11 ms, n = 336; 14 ms, n = 192 synaptic profiles) and knockouts (no stim, n = 330; 5 ms, n = 231; 11 ms, n = 352; 14 ms, n = 321 synaptic profiles). Number of biological replicates (from separate cultures frozen on different days and analyzed in separate randomized batches): 2 for each of the syt7 time points, 2 for 5 ms and 14 ms Doc2 WT, 2 for 5 ms and 11 ms Doc2 KO, 3 for Doc2 WT no stim and 11 ms, 3 for Doc2 KO no stim and 14 ms. The number of pits between wild type and knockout was compared using Brown–Forsythe ANOVAs with post hoc Games–Howell’s multiple-comparisons tests. In pairwise tests, the same time point for wild type vs. knockout as well as each time point within each genotype were compared against each other. Only comparisons between the same time point for wild type vs. knockout are shown. See Figure 5—source data 2 for all pairwise comparisons, summary statistics, and test statistics. See Figure 5—figure supplement 2A for active zone sizes from each condition and Figure 5—figure supplement 2B for pit data normalized to the size of active zones. See Figure 5—figure supplement 1 for more example micrographs. See Figure 5—source data 1 for all data used to generate the figures.
Figure 5—figure supplement 1.
Figure 5—figure supplement 1.. Additional example transmission electron micrographs.
From the experiments described in Figures 5 and 6. Scale bar: 100 nm.
Figure 5—figure supplement 2.
Figure 5—figure supplement 2.. Additional quantification from electron microscopy.
From the experiments described in Figures 5 and 6. (A) Size of the active zone in each synaptic profile from each condition. Each dot indicates a single synaptic profile. Error bars: median and interquartile range. (B) Same pit data from Figure 5, normalized to the size of the active zone in each condition. ‘Per 500 nm of active zone’ calculation was performed by multiplying the count from each synaptic profile by 500 and dividing by the mean active zone size from the data set (i.e., normalization was not performed by the size of the active zone in each individual synaptic profile). (C) Same as (B), but for docked vesicle data from Figure 6. (D) Distances of undocked synaptic vesicles from the plasma membrane at the active zone, not including docked vesicles (which are 0 nm from the plasma membrane). Distances are binned in 5 nm increments (‘5’ indicates vesicles 0.1–5 nm from the membrane, ‘10’ indicates 6–10 nm, etc.). Each dot indicates the mean number of synaptic vesicles per synaptic profile in that distance range from the active zones.
Figure 6.
Figure 6.. Syt7 is absolutely required for transient docking, while docked vesicles recover more quickly without Doc2α.
(A–D) Example transmission electron micrographs of syt7WT (A), syt7KO (B), Doc2αWT (C), and Doc2αKO (D) synapses frozen at the indicated time points after an action potential (AP) or without stimulation (no stim). Arrows indicate docked vesicles (synaptic vesicles with no visible distance between their membrane and the plasma membrane). (E) The number of docked vesicles per synaptic profile (part of the synapse captured in a 2D section) in syt7 wild-type littermate controls and knockouts. Error bars indicate 95% confidence interval of the mean for all data pooled together; each dot indicates the mean from a single biological replicate. p-Values are from comparisons between wild-type controls (no stim, n = 217; 5 ms, n = 216; 11 ms, n = 217; 14 ms, n = 230 synaptic profiles) and knockouts (no stim, n = 193; 5 ms, n = 215; 11 ms, n = 230; 14 ms, n = 212 synaptic profiles) frozen at the same time point. (F) same as (E), but for Doc2α wild-type controls (no stim, n = 327; 5 ms, n = 229; 11 ms, n = 336; 14 ms, n = 192 synaptic profiles) and knockouts (no stim, n = 330; 5 ms, n = 231; 11 ms, n = 352; 14 ms, n = 321 synaptic profiles). Number of biological replicates (from separate cultures frozen on different days and analyzed in separate randomized batches): 2 for each of the syt7 time points, 2 for 5 ms and 14 ms Doc2 WT, 2 for 5 ms and 11ms Doc2 KO, 3 for Doc2 WT no stim and 11 ms, and 3 for Doc2 KO no stim and 14 ms. The numbers of pits between wild type and knockout were compared using Brown–Forsythe ANOVAs with post hoc Games–Howell’s multiple-comparisons tests. In pairwise tests, the same time point for wild type vs. knockout as well as each time point within each genotype were compared against each other. Only comparisons between the same time point for wild type vs. knockout are shown. See Figure 6—source data 2 for all pairwise comparisons, summary statistics, and test statistics. See Figure 5—figure supplement 2A for active zone sizes from each condition, Figure 5—figure supplement 2C for docked vesicle data normalized to the size of active zones, and Figure 5—figure supplement 2D for distribution of undocked vesicles. See Figure 5—figure supplement 1 for more example micrographs. See Figure 6—source data 1 for all data used to generate the figures.
Figure 7.
Figure 7.. A mathematical model in which syt7 catalyzes synaptic vesicle docking and Doc2α promotes fusion that can qualitatively explain the observed phenotypes.
(A) Simplified scheme of the model in which syt7 acts as a catalyst of synaptic vesicle docking (increasing both docking and undocking rates) and Doc2α regulates fusion together with syt1. All proteins only exert their effect when bound to Ca2+. In the model, a release site can either be empty or occupied by a tethered or a docked vesicle. For full model scheme, see Figure 7—figure supplement 1. (B) Ca2+ transient used to perform the simulations. The transient corresponds to a signal induced by 10 action potentials (APs) at 20 Hz. Inset shows a zoom-in over the first 5 ms of the transient. (C) Average number of Ca2+ ions bound to syt1, Doc2α, and syt7 over time. All syt1s expressed per synaptic vesicle can maximally bind five Ca2+ ions in total, Doc2α and syt7 can each bind two Ca2+ ions per release site. Inset shows zoom-in over the first 5 ms of the simulation. (D) The number of docked vesicles over time for simulations including functionality of all proteins (black, WT), simulations lacking Doc2α (magenta, Doc2α-), and simulations lacking syt7 (cyan, syt7-). Inset shows a zoom-in over the first 15 ms of the simulation. (E) Simulated release rates obtained using the full model (WT, left, black), the model lacking Doc2α (Doc2α -, middle, magenta), and the model lacking syt7 (syt7, right, cyan) simulations. Top line shows the entire trace. Bottom panels show a zoom-in to illustrate the asynchronous release component, which is indicated by the gray area. (F) Cumulative number of asynchronously released vesicles per stimulus. Asynchronous release is quantified as the release between 5 ms after the start of the AP and the start of the next AP. Inset shows zoom-in over the first two pulses. (G) Peak release rates per stimulus for stimulations using the full model (WT, black), the model lacking Doc2α (Doc2α-, magenta), and the model lacking syt7 (syt7-, cyan).
Figure 7—figure supplement 1.
Figure 7—figure supplement 1.. Full reaction scheme of the model.
In the model, a release site can be in three different states: empty, occupied with a tethered vesicle or a docked vesicle. Within those states, a release site can be in a different substate depending on the number of Ca2+ ions bound to Doc2α, syt7, and syt1. The top left illustration shows the legend for these substates. Doc2α and syt7 are assumed to be part of the release sites. Therefore, syt7 and Doc2α can bind to Ca2+ in all the states. Syt1 can only bind to Ca2+ once the vesicle is docked. Binding of Ca2+ to syt7 increases both the docking and undocking rates. Synaptic vesicle docking occurs with a basal docking rates (kdocking) from tethered vesicles labeled with blue, which are those release sites in which syt7 has not bound to Ca2+. Purple and magenta colors indicate states with increased docking rates correspondingly tethered vesicles in which one and two Ca2+ ions have bound to syt7, respectively. Similarly, undocking rates from all docked vesicle states are dependent on the number of Ca2+ ions bound to syt7. Ca2+ binding to Doc2α and syt1 increases the fusion probability of the docked vesicles (green to red color coding of the different synaptic vesicle states for low to high fusion rates, respectively). For a full description of the model, see ‘Methods’.
Figure 7—figure supplement 2.
Figure 7—figure supplement 2.. Effects of different model parameters on model predictions.
(A) Effect of varying model parameters on the number of vesicles docking between 15 and 5 ms. (B) Effect of varying model parameters on total number of asynchronously released vesicles. (C) Effect of varying model parameters on the peak release rate at the first pulse. (D) Effect of varying model parameters on the ratio between the peak release rates of the tenth and the first pulse. Each parameter was evaluated at 19 values ranging from one-tenth of the selected value (as presented in Table 1) to tenfold the selected parameter value. Model parameters varied for WT (black), Doc2α- (magenta), and syt7- (cyan) simulations. For Ca2+-binding rates (k2+ and k7+), the unbinding rates were adjusted accordingly to have a constant Ca2+- affinity. Similarly, the untethering and undocking rates were adjusted with the tethering and docking.
Figure 7—figure supplement 3.
Figure 7—figure supplement 3.. Covarying two parameters illustrates that the selected model parameters are unlikely to provide a unique solution.
(A) Effect of covarying two model parameters on the number of vesicles docking between 15 and 5 ms. (B) Effect of covarying two model parameters on the total number of asynchronously released vesicles. (C) Effect of covarying two model parameters on the peak release rate at the first pulse. (D) Effect of covarying two model parameters on the ratio between the peak release rates of the tenth and the first pulse. Each parameter was evaluated at 19 values ranging from one-tenth of the selected value (as presented in Table 1) to tenfold the selected parameter value. The selected setting (represented in Figure 7) is the middle point in each panel. Covarying the Ca2+-binding rate of syt7 (k7+) with the effect syt7 has on the docking and undocking rates (f7, top panels) shows that there is a section in the parameter space where WT simulations result in similar quantified model predictions (as indicated by the same colors in the heatmaps). This also holds for covarying the Ca2+-binding rate of Doc2α (k2+) with the decay time of the residual Ca2+ signal (tau, middle panels) and covarying of f2 with the amplitude of the residual Ca2+ signal (bottom, panels). Together, this illustrates that the selected model parameters are unlikely to present a unique solution. For Ca2+-binding rates (k2+ and k7+), the unbinding rates were adjusted accordingly to keep a constant Ca2+ affinity.
Figure 7—figure supplement 4.
Figure 7—figure supplement 4.. Evaluation of a model lacking both Doc2α and syt7.
(A) The number of docked vesicles over time for simulations including functionality of all proteins (black, WT), simulations lacking Doc2α (magenta, Doc2α-), simulations lacking syt7 (cyan, syt7-), and simulations lacking both syt7 and Doc2α (blue, Syt7-& Doc2α-). Inset shows a zoom-in over the first 15 ms of the simulation. (B) Simulated release rates obtained using a model lacking syt7 and Doc2α (Syt7-& Doc2α-, blue). Top panel shows the entire trace. Bottom panel show a zoom-in to illustrate the asynchronous release component, which is indicated by the gray area. (C) Cumulative number of asynchronously released vesicles per stimulus. Asynchronous release is quantified as the release between 5 ms after the start of the action potential (AP) and the start of the next AP. Inset shows zoom-in over the first two pulses. (D) Peak release rates per stimulus for stimulations using the full model (black, WT), simulations lacking Doc2α (magenta, Doc2α-), simulations lacking syt7 (cyan, syt7-), and simulations lacking both syt7 and Doc2α (blue, Syt7-& Doc2α-).
Figure 8.
Figure 8.. Asynchronous release (AR) in Doc2α/syt7 double knockout (DKO) neurons: non-additive effects on AR indicate function through a common pathway.
All recordings were carried out using acute hippocampal slices, in CA1, as described in Figures 2 and 4. Data from all conditions except Doc2α/syt7 DKO are the same as shown in Figures 2 and 4 and. (A) Averaged traces of evoked excitatory postsynaptic currents (EPSCs) recorded from WT (n = 18 recordings; from five independent litters), Doc2αKO (n = 15; from four independent litters), Doc2α/syt7 DKO (n = 14; from four independent litters), and EGTA-AM-treated neurons (n = 20; from four independent litters). (B) Bar graph summarizing the slow EPSC charge values. Error bars are mean ± the standard error of the mean. One-way ANOVA, followed by Dunnett's test, was used to compare mutants against WT. ***p<0.001. Exact p-value for slow EPSC charge in syt7 KO = 0.43. (C) Representative EPSCs triggered by 20 Hz stimulus trains using WT and Doc2α/syt7 DKO (n = 15 recordings; from five independent litters) neurons. (D) AR in WT, Doc2αKO, syt7KO, Doc2α/syt7 DKO, and EGTA-AM-treated neurons was estimated by measuring the total tonic charge transfer during the 20 Hz stimulus train, as described in Figure 4C. Error bars are mean ± the standard error of the mean. One-way ANOVA, followed by Dunnett's test, was used to compare mutants against WT. ***p<0.001. All data, summary statistics, and p-values are listed in Figure 8—source data 1.
Figure 8—figure supplement 1.
Figure 8—figure supplement 1.. EGTA-AM phenocopies synaptic depression of phasic responses in Doc2α/syt7 double knockouts (DKOs), an intermediate phenotype between the single KOs.
Recordings of CA1 neurons in hippocampal slices were carried out as described in Figure 4. The peak amplitude of each excitatory postsynaptic current (EPSC) during 50 action potentials (APs) at 20 Hz was normalized to the first EPSC from Doc2α/syt7 DKO slices; for comparison, all other conditions were replotted from Figure 4.
Figure 9.
Figure 9.. Doc2α triggers asynchronous release (AR) in response to single action potentials (APs).
During repetitive stimulation, syt7 mediates transient docking to feed docked vesicles to Doc2α for ongoing AR. At rest, synaptic vesicles are docked at the active zone (solid gray line) in a dynamic equilibrium indicated by the antiparallel black arrows (far-left panel). Under these conditions, docking is not affected by syt7 (Figure 6E; Vevea et al., 2021). A single AP triggers both undocking (UD; Kusick et al., 2020) and synchronous release (SR), resulting in a 40% reduction in docked vesicles in ~5 ms (Figure 6E and F; Kusick et al., 2020). This is followed by a transient docking (TD) step in which vesicles reattach to the active zone via a process that takes ~14 ms and is mediated by Ca2+ and syt7 (granite green) (Figure 6E and F; Kusick et al., 2020). The same single AP also triggers AR mediated directly by Doc2α (lilac), at the 11 ms time point (Figure 5F). Syt7 plays a minimal role in release during the first AP (Figures 1, 2,; and references in the main text), again because it does not regulate docking in the resting state. However, the loss of syt7 abolishes activity-dependent TD (Figure 6E), which decreases the availability of docked vesicles during subsequent (i.e., two or more) APs, indirectly reducing Doc2α-triggered AR during ongoing activity. As a test of this model, an epistasis experiment revealed that the Doc2α/syt7 double knockout (DKO) AR phenotype was nonadditive (Figure 8). This validates a sequential, two-step, model, in which – during ongoing activity – syt7 feeds docked vesicles to Doc2α, which directly mediates AR. Hence, syt7 acts upstream of Doc2α, as a docking factor, while Doc2α functions as a proximal Ca2+ sensor for AR in hippocampal synapses. This model can account for why Doc2α, but not syt7, drives a large portion of AR in response to a single AP, while Doc2α and syt7 both contribute to AR during subsequent APs.
Author response image 1.

Update of

  • doi: 10.1101/2022.04.21.489101
  • doi: 10.7554/eLife.90632.1
  • doi: 10.7554/eLife.90632.2

References

    1. Bacaj T, Wu D, Yang X, Morishita W, Zhou P, Xu W, Malenka RC, Südhof TC. Synaptotagmin-1 and synaptotagmin-7 trigger synchronous and asynchronous phases of neurotransmitter release. Neuron. 2013;80:947–959. doi: 10.1016/j.neuron.2013.10.026. - DOI - PMC - PubMed
    1. Bai J, Tucker WC, Chapman ER. PIP2 increases the speed of response of synaptotagmin and steers its membrane-penetration activity toward the plasma membrane. Nature Structural & Molecular Biology. 2004;11:36–44. doi: 10.1038/nsmb709. - DOI - PubMed
    1. Blanchard K, Zorrilla de San Martín J, Marty A, Llano I, Trigo FF. Differentially poised vesicles underlie fast and slow components of release at single synapses. The Journal of General Physiology. 2020;152:e201912523. doi: 10.1085/jgp.201912523. - DOI - PMC - PubMed
    1. Brandt DS, Coffman MD, Falke JJ, Knight JD. Hydrophobic contributions to the membrane docking of synaptotagmin 7 C2A domain: mechanistic contrast between isoforms 1 and 7. Biochemistry. 2012;51:7654–7664. doi: 10.1021/bi3007115. - DOI - PMC - PubMed
    1. Brenowitz SD, Regehr WG. Reliability and heterogeneity of calcium signaling at single presynaptic boutons of cerebellar granule cells. The Journal of Neuroscience. 2007;27:7888–7898. doi: 10.1523/JNEUROSCI.1064-07.2007. - DOI - PMC - PubMed