. 2024 Mar 29;10(13):eadm9859.
doi: 10.1126/sciadv.adm9859. Epub 2024 Mar 27.

Glutamine antagonist DRP-104 suppresses tumor growth and enhances response to checkpoint blockade in KEAP1 mutant lung cancer

Affiliations

Glutamine antagonist DRP-104 suppresses tumor growth and enhances response to checkpoint blockade in KEAP1 mutant lung cancer

Ray Pillai et al. Sci Adv. .

Abstract

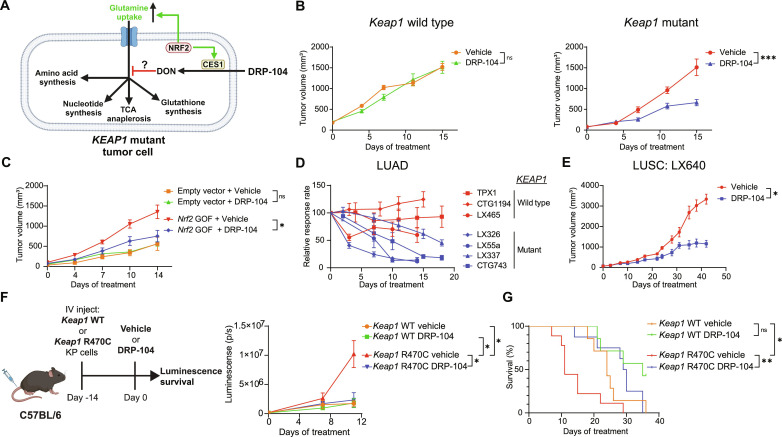
Loss-of-function mutations in KEAP1 frequently occur in lung cancer and are associated with poor prognosis and resistance to standard of care treatment, highlighting the need for the development of targeted therapies. We previously showed that KEAP1 mutant tumors consume glutamine to support the metabolic rewiring associated with NRF2-dependent antioxidant production. Here, using preclinical patient-derived xenograft models and antigenic orthotopic lung cancer models, we show that the glutamine antagonist prodrug DRP-104 impairs the growth of KEAP1 mutant tumors. We find that DRP-104 suppresses KEAP1 mutant tumors by inhibiting glutamine-dependent nucleotide synthesis and promoting antitumor T cell responses. Using multimodal single-cell sequencing and ex vivo functional assays, we demonstrate that DRP-104 reverses T cell exhaustion, decreases Tregs, and enhances the function of CD4 and CD8 T cells, culminating in an improved response to anti-PD1 therapy. Our preclinical findings provide compelling evidence that DRP-104, currently in clinical trials, offers a promising therapeutic approach for treating patients with KEAP1 mutant lung cancer.


Figures

Fig. 1.
Fig. 1.. KEAP1 mutant tumors are sensitive to DRP-104 in vivo.
(A) KEAP1 mutant tumors have enhanced NRF2 activity leading to metabolic rewiring and enhanced glutamine uptake, potentially sensitizing them to DRP-104, the prodrug of DON. CES1, carboxylesterase 1. (B) Keap1 WT or mutant KrasG12D/+ p53−/− (KP) cells were subcutaneously transplanted into nude mice (n = 15 per group). Mice were treated with either DRP-104 (2 mg/kg) or vehicle subcutaneously 5 days on, 2 days off. (C) KP cells were transduced with an Nrf2 gain-of-function (GOF) vector or empty vector control and were subcutaneously transplanted into nude mice (n = 7 to 8 per group), and mice were treated with either DRP-104 (3 mg/kg) or vehicle control. (D) Lung adenocarcinoma patient-derived xenografts (PDXs) were implanted into NSG mice. Mice were treated with either vehicle control or DRP-104 (3 mg/kg), and tumors were measured over time. Relative response rate (tumor volume/average vehicle volume × 100%) over time is plotted. KEAP1 WT and mutant PDXs are labeled. (E) Growth kinetics of the lung squamous cell carcinoma PDX LX640 treated with DRP-104 (3 mg/kg) or vehicle control (n = 8 per group). (F and G) Schematic of orthotopic transplant lung cancer model. Keap1 WT or Keap1 R470C mutant KP cell lines expressing luciferase were intravenously (IV) injected into C57BL/6 mice on day 0. On day 14, lung luminescence (p/s, photons/second) was measured and mice were randomized into treatment groups (seven to nine mice per group) with either DRP-104 (3 mg/kg) or vehicle control. Tumor growth kinetics based on luminescence was measured (F), and survival data (G) are shown. Data are plotted as mean with SEM. For statistical analysis, two-way analysis of variance (ANOVA) was used for growth kinetics and log-rank test was used for survival. ns, not significant; *P < 0.05, **P < 0.01, ***P < 0.001, ****P < 0.0001.
Fig. 2.
Fig. 2.. DRP-104 targets nucleotide metabolism in KEAP1 mutant tumors.
(A) Overview of glutamine-dependent pathways. (B) Schematic of in vivo metabolomics. After implantation of the CTG743 (Keap1 mutant) PDX into NSG mice, treatment with DRP-104 (3 mg/kg) or vehicle control (n = 5 to 7 per group) was initiated. After 5 days of treatment, tumors were collected for liquid chromatography mass spectrometry (LCMS). (C) Relative abundance of glutamine and glutamate as measured by LCMS from experiment in (B). (D) Outline of purine biosynthesis where glucose is used to generate ribose-5-phopshate (R-5-P), FGAR, FGAM, IMP, AMP, and GMP. (E) Relative abundance of FGAR, FGAM, inosine, AMP, and GMP as measured by LCMS in KEAP1 mutant PDX tumors after treatment with DRP-104 (3 mg/kg). (F) Keap1 mutant tumor cells were treated with DRP-104 (0, 0.5, or 1 μM) (n = 3 per group). After 24 hours, cells were incubated with either labeled 13C-glucose or 13C-glutamine for 1 hour and then cells were collected for LCMS. (G) Fractional enrichment of FGAM, AMP, and dGMP for experiment outlined in (F). (H) Keap1 mutant tumor cells were pretreated with the nucleosides cytidine, hypoxanthine, uridine, thymidine, guanosine, and adenosine (0 to 0.25 mM) for 24 hours and then treated with DRP-104 (2 μM) or control medium for 120 hours (n = 3 per group). Proliferation was measured by crystal violet. (I) Plot of nucleoside mix concentration versus relative proliferation of Keap1 mutant tumor cells treated with DRP-104 normalized to control cells. (J) Relative proliferation of DRP-104 or vehicle-treated Keap1 mutant tumor cells after addition of either hypoxanthine or thymidine or both. Statistical analysis was done by either Mann-Whitney test, Kruskal-Wallis test with Dunn’s multiple-comparisons test, or two-way ANOVA. *P < 0.05, **P < 0.01, ***P < 0.001, ****P < 0.0001.
Fig. 3.
Fig. 3.. DRP-104 augments T cell infiltration and increases response rates to anti-PD1 therapy.
(A) Immunohistochemistry staining for CD3 of mouse lungs with Keap1 R470C KP tumors treated with either DRP-104 or vehicle control. Intratumoral CD3 quantification is shown for individual tumors. (B) Keap1 R470C mutant KP tumor cells were intravenously injected into C57BL/6 mice. After 10 days, mice were treated with either anti-CD8 or isotype control (150 μg intraperitoneally twice a week) and DRP-104 or vehicle control (n = 4 to 6 per group). Lung tumor burden as measured by luminescence is displayed. (C and D) Keap1 R470C mutant KP tumor cells were intravenously injected into C57BL/6 mice. After 10 days, mice were randomized into treatment conditions displayed in the schematic. Tumor burden was measured over time by luminescence (n = 5 to 7 per group) (C), and waterfall plot showing bioluminescence signal at day 11 relative to signal at treatment initiation is shown (D). (E) Survival of mice shown from experiment outlined in (C). (F and G) Multi-color immunofluorescent staining of Keap1 R470C lung tumors (F) after 5 days of treatment with DRP-104 (+ isotype), anti-PD1 (+ vehicle), the combination of both, or controls (vehicle + isotype control). Quantification of CD4 (yellow) and CD8 (red) intratumoral T cell populations is shown for individual tumors (G). Data were analyzed by one-way ANOVA and Tukey’s multiple-comparison testing or log-rank test. *P < 0.05, **P < 0.01, ***P < 0.001, ****P < 0.0001.
Fig. 4.
Fig. 4.. ExCITE-seq identifies transcriptional changes in T cell populations with DRP-104 and anti-PD1 therapy.
(A) Schematic of experimental design of acquisition of samples for ExCITE-seq. Fourteen days after injection of Keap1 R470C mutant KP cells, mice were treated with DRP-104 (3 mg/kg) or vehicle and anti-PD1 (200 μg intraperitoneally every other day) or isotype control. Tumor-bearing lungs were digested after 5 days of treatment, and extravascular CD45+ cells and tumor cells were sorted for analysis by ExCITE-seq (n = 2 per group). (B) UMAP showing clustering of cell populations with quantification of immune subpopulations. (C) Subcluster showing T cell, NKT cell, NK cell, and ILC populations, with subclusters labeled. (D) Violin plots showing expression of Pdcd1, Tnfrsf9, Lag3, and Ccl5 by T cell clusters shown in (C). (E) Quantification of T cell subclusters stratified by treatment condition and normalized to total CD8 or CD4 T cells.
Fig. 5.
Fig. 5.. DRP-104 reduces T cell exhaustion and enhances effector T cell function in vivo.
(A) Schematic of experimental design. Keap1 R470C mutant KP lines were injected intravenously into C57BL/6 mice. Fourteen days after injection, treatment with DRP-104 (3 mg/kg) or vehicle and anti-PD1 (200 μg intraperitoneally three times a week) or isotype control was initiated. Lungs were collected from tumor-bearing mice either 5 or 10 days after treatment initiation and analyzed by flow cytometry. (B to F) Flow cytometry quantification of (B) CD3 T cells, (C) Tregs (CD4+ FoxP3+ CD25+), (D) CD8+ CD44+ CD62L+ (central memory CD8 T cells), (E) CD4+ PD1+ TIM3+, and (F) CD8+ PD1 intermediate TCF7+ populations after 5 days of treatment (n = 5 per group). (G and H) Flow cytometry analysis of PD1+ TIM3+ populations for (G) CD4 T cells and (H) CD8 T cells with representative gating after 10 days of treatment with DRP-104 (n = 3 to 6 per group). (I and J) Flow cytometry quantification of PD1+ LAG3+ for (I) CD4 T cells and (J) CD8 T cells (n = 3 to 6 per group) after 10 days of treatment with DRP-104. (K to M) Representative gating (K) and flow cytometry quantification of IFNγ and TNFα expression for PMA/ionomycin-stimulated (L) CD4 T cells and (M) CD8 T cells after 5 days of treatment with DRP-104 or vehicle and/or anti-PD1 or isotype control (n = 5 per group). (N) Overview of effect of DRP-104 on KEAP1 mutant tumors and T cells. Data were analyzed by either Mann-Whitney test or one-way ANOVA and Tukey’s multiple-comparison testing. *P < 0.05, **P < 0.01, ***P < 0.001, ****P < 0.0001.

Update of

References

    1. Hanahan D., Weinberg R. A., Hallmarks of cancer: The next generation. Cell 144, 646–674 (2011). - PubMed
    1. Romero R., Sayin V. I., Davidson S. M., Bauer M. R., Singh S. X., LeBoeuf S. E., Karakousi T. R., Ellis D. C., Bhutkar A., Sánchez-Rivera F. J., Subbaraj L., Martinez B., Bronson R. T., Prigge J. R., Schmidt E. E., Thomas C. J., Goparaju C., Davies A., Dolgalev I., Heguy A., Allaj V., Poirier J. T., Moreira A. L., Rudin C. M., Pass H. I., Vander Heiden M. G., Jacks T., Papagiannakopoulos T., Keap1 loss promotes Kras-driven lung cancer and results in dependence on glutaminolysis. Nat. Med. 23, 1362–1368 (2017). - PMC - PubMed
    1. Lignitto L., LeBoeuf S. E., Homer H., Jiang S., Askenazi M., Karakousi T. R., Pass H. I., Bhutkar A. J., Tsirigos A., Ueberheide B., Sayin V. I., Papagiannakopoulos T., Pagano M., Nrf2 activation promotes lung cancer metastasis by inhibiting the degradation of bach1. Cell 178, 316–329.e18 (2019). - PMC - PubMed
    1. Shackelford D. B., Abt E., Gerken L., Vasquez D. S., Seki A., Leblanc M., Wei L., Fishbein M. C., Czernin J., Mischel P. S., Shaw R. J., LKB1 Inactivation dictates therapeutic response of non-small cell lung cancer to the metabolism drug phenformin. Cancer Cell 23, 143–158 (2013). - PMC - PubMed
    1. Shaw A. T., Kim D. W., Nakagawa K., Seto T., Crinó L., Ahn M. J., de Pas T., Besse B., Solomon B. J., Blackhall F., Wu Y. L., Thomas M., O–Byrne K. J., Moro-Sibilot D., Camidge D. R., Mok T., Hirsh V., Riely G. J., Iyer S., Tassell V., Polli A., Wilner K. D., Jänne P. A., Crizotinib versus chemotherapy in advanced ALK-positive lung cancer. N. Engl. J. Med. 368, 2385–2394 (2013). - PubMed

Publication types

MeSH terms