. 2024 Mar 29;10(13):eadj9600.
doi: 10.1126/sciadv.adj9600. Epub 2024 Mar 27.

CRIF1 deficiency induces FOXP3LOW inflammatory non-suppressive regulatory T cells, thereby promoting antitumor immunity

Affiliations

CRIF1 deficiency induces FOXP3LOW inflammatory non-suppressive regulatory T cells, thereby promoting antitumor immunity

Sangsin Lee et al. Sci Adv. .

Abstract

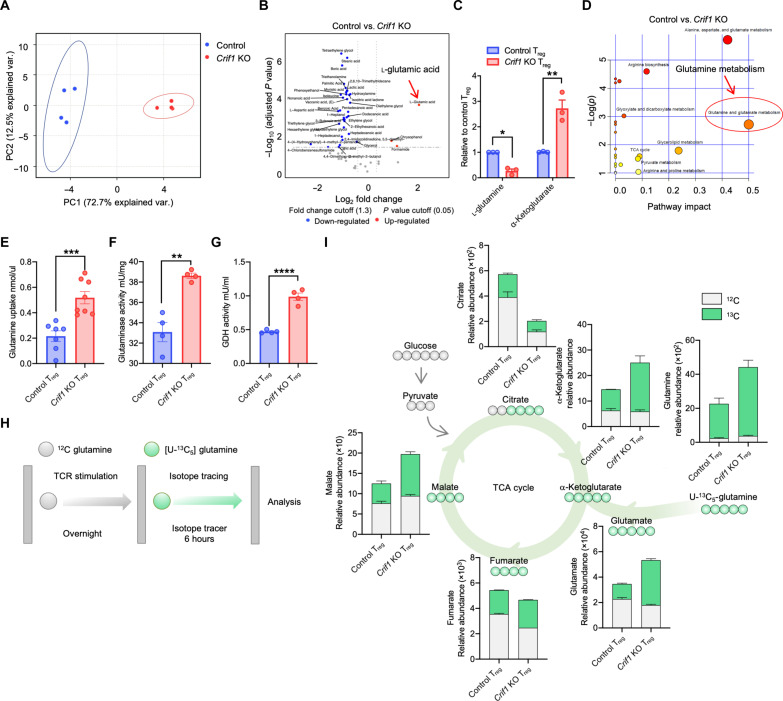
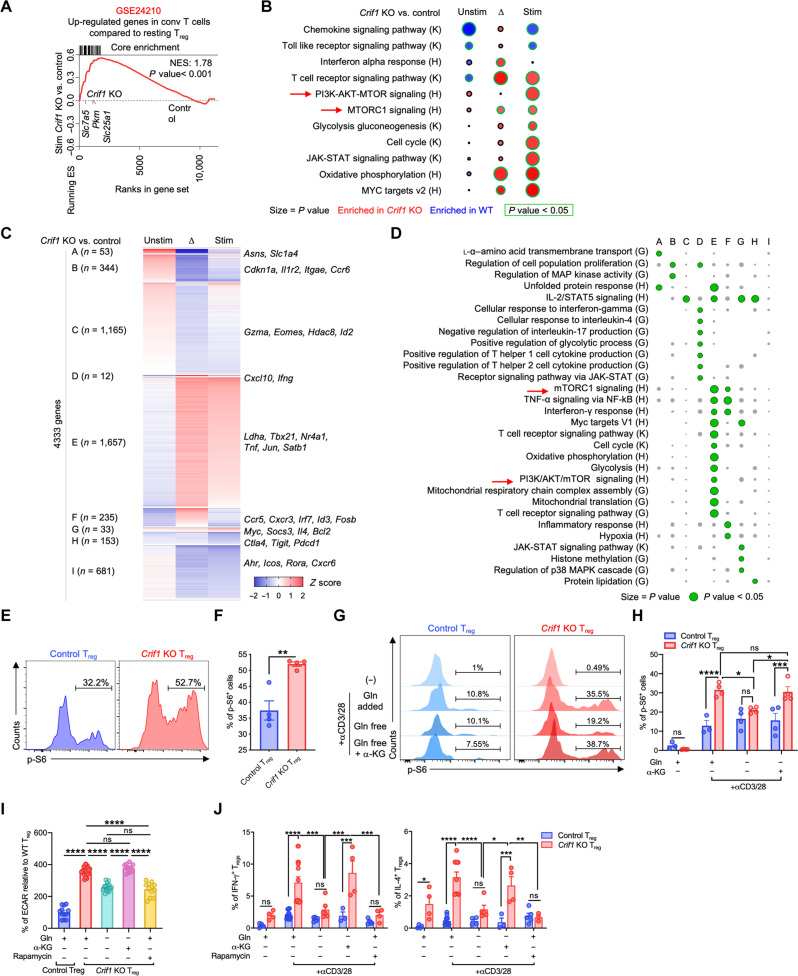
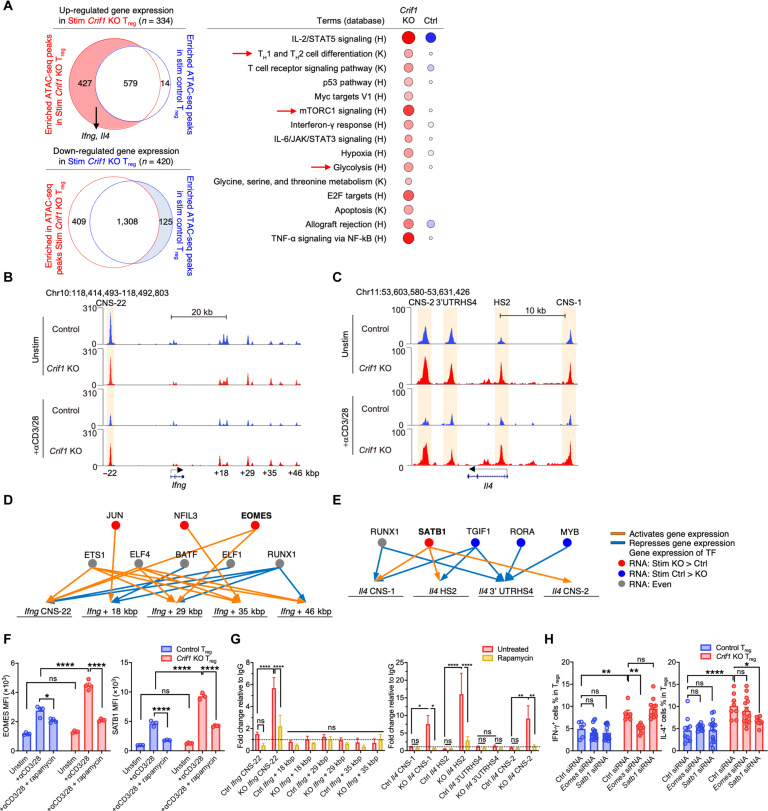
Recently identified human FOXP3lowCD45RA- inflammatory non-suppressive (INS) cells produce proinflammatory cytokines, exhibit reduced suppressiveness, and promote antitumor immunity unlike conventional regulatory T cells (Tregs). In spite of their implication in tumors, the mechanism for generation of FOXP3lowCD45RA- INS cells in vivo is unclear. We showed that the FOXP3lowCD45RA- cells in human tumors demonstrate attenuated expression of CRIF1, a vital mitochondrial regulator. Mice with CRIF1 deficiency in Tregs bore Foxp3lowINS-Tregs with mitochondrial dysfunction and metabolic reprograming. The enhanced glutaminolysis activated α-ketoglutarate-mTORC1 axis, which promoted proinflammatory cytokine expression by inducing EOMES and SATB1 expression. Moreover, chromatin openness of the regulatory regions of the Ifng and Il4 genes was increased, which facilitated EOMES/SATB1 binding. The increased α-ketoglutarate-derived 2-hydroxyglutarate down-regulated Foxp3 expression by methylating the Foxp3 gene regulatory regions. Furthermore, CRIF1 deficiency-induced Foxp3lowINS-Tregs suppressed tumor growth in an IFN-γ-dependent manner. Thus, CRIF1 deficiency-mediated mitochondrial dysfunction results in the induction of Foxp3lowINS-Tregs including FOXP3lowCD45RA- cells that promote antitumor immunity.


Figures

Fig. 1.
Fig. 1.. Human cancers contain inflammatory FOXP3low CD4+ T cells that demonstrate down-regulated mitochondrial biogenesis, including low expression of the mitochondrial regulatory protein CRIF1.
(A and B) Overall survival of NSCLC (left, total cases; right, tumor size ≥ 5 cm) or CRC (left, total cases; right, pT3 microsatellite-stable). (C to K) Analysis of publicly available scRNA-seq data on the TILs in human NSCLCs and CRCs. (C) and (D) Uniform manifold approximation projection (UMAP) visualization of the TILs in the NSCLCs and CRCs. (E) and (F) Volcano plots comparing FOXP3low CD4+ and FOXP3high CD4+ TILs in the NSCLCs and CRCs. (G) and (H) Heatmap showing the gene set variation analysis (GSVA) scores in the TILs from the NSCLCs and CRCs. H, Hallmark; K, Kyoto Encyclopedia of Genes and Genomes; G, Gene Ontology; R, Reactome. TCA, tricarboxylic acid. (I) and (J) Heatmap showing the mitochondrial biogenesis-related gene expressions in the NSCLCs and CRCs. (K) Venn diagram showing down-regulated genes in the heatmap. (L to S) Flow cytometric analysis of the CD4+ T cell subpopulations in human NSCLCs. (L) and (M) Five fractions were defined (n = 27). (N) Frequencies of IFN-γ+ (n = 38), IL-4+ (n = 52), or IL-17A+ (n = 59) cells. (O) and (P) Mitochondrial biogenesis in FOXP3low and FOXP3high CD4+ T cells (n = 18). MFI, mean fluorescence intensity. (Q) and (R) CRIF1 expression in FOXP3low and FOXP3high CD4+ T cells (n = 22). (S) Correlation between CRIF1 and FOXP3 expression in CD4+ T cells (NSCLCs, n = 16; CRCs, n = 18). Dots represent individual cases. The data are pooled from at least three independent experiments and are presented as means ± SEM of biological replicates. Flow cytometry plots are representative of at least two independent experiments. ns, not significant; ***P < 0.001 and ****P < 0.0001. Statistical testing was conducted with the Kaplan-Meier method and the log-rank test (A), Wilcoxon test [(N), (P), and (R)], and Pearson correlation test (S).
Fig. 2.
Fig. 2.. CRIF1-deficient Tregs exhibit the distinctive characteristics of INS-Tregs.
Comparison of Crif1fl/flFoxp3YFP-Cre and control Foxp3YFP-Cre mice. (A to H) Foxp3-YFP+ Treg phenotypes. (A) and (B) Treg frequencies in the splenic and LN CD4+ T cell population [left two plots in (B)] and absolute Treg numbers [right two plots in (B)]. (C) Foxp3-YFP expression intensity in splenic and LN Foxp3-YFP+ Tregs. (D) and (E) Ability of Tregs to suppress effector T cell proliferation. (F) and (G) Frequencies of splenic Tregs that spontaneously produce IFN-γ, IL-4, and IL-17A. (H) Cytokine production of Tregs that underwent TCR stimulation for 2 days, as shown by enzyme-linked immunosorbent assay of the supernatants. (I to N) Adoptive transfer of Foxp3-YFP+ Tregs into Rag1-KO mice that did or did not lack Ifng and IL4 expression. (I) Schematic depiction of the experiment. (J) Foxp3-YFP expression intensity in the total CD4+ T cells in the spleen and LNs. (K) Frequencies of Tregs in the spleen and LNs that produced IFN-γ, IL-4, or IL-17A. (L) Gross appearance of the spleen and LNs. (M) Absolute cell numbers in the spleen and LNs. (N) Representative histological images of the ear skin, lung, and liver. Scale bars, 200 μm (for the lungs) and 100 μm (for the ear skin and liver). Dots represent individual mice (n = 4 to 13 per group). The data are pooled from at least two independent experiments and are presented as means ± SEM of biological replicates. Gross and histological images and flow cytometry plots are representative of at least two independent experiments. *P < 0.05, **P < 0.01, ***P < 0.001, and ****P < 0.0001. Statistical testing was conducted with an unpaired two-tailed t test [(B), (C), (E), (G), and (H)], and one-way analysis of variance (ANOVA) [(J), (K), and (M)]. i.v., intravenous.
Fig. 3.
Fig. 3.. CRIF1-deficient Tregs exhibit mitochondrial dysfunction. Splenic Foxp3-YFP+ Tregs from Crif1fl/flFoxp3YFP-Cre and control Foxp3YFP-Cre mice were assessed.
(A and B) Mitochondrial biogenesis was measured by determining the MT-CO1/SDHA ratio by flow cytometry. (C and D) Mitochondrial reactive oxygen species, mass, and membrane potential were measured by flow cytometry with MitoSOX, MitoTracker Red, and MitoTracker Orange, respectively. (E and F) Immunofluorescence staining to determine mitochondrial translation. The incorporation of l-homopropargylglycine (HPG) was calculated as a ratio of HPG intensity to the TOM20 stained mitochondrial area. Scale bars, 5 μm; a.u., arbitrary unit. (G) Western blot to measure the mitochondrial electron transport complex levels. (H) Flow cytometric expression of the mitochondrial complex I protein MT-ND1 and complex V protein ATP5A1. (I) Adenosine triphosphate (ATP) levels measured by mass spectrometry (MS). (J) Representative images of electron microscopy showing the morphology of the mitochondria. (K) Seahorse analysis of oxygen consumption rate (OCR) and extracellular acidification rate (ECAR). FCCP, carbonyl cyanide p-trifluoromethoxyphenylhydrazone. (L and M) Flow cytometric 2-NBDG uptake and GLUT1 expression after TCR stimulation. Dots represent individual mice (n = 3 to 6 per group). Data are pooled from at least two independent experiments and are presented as means ± SEM of biological replicates. Flow cytometry plots, electron microscopy images, immunofluorescence images, and Western blot images are representative of at least two independent experiments. *P < 0.05, **P < 0.01, ***P < 0.001, and ****P < 0.0001. Statistical testing was conducted with an unpaired two-tailed t test.
Fig. 4.
Fig. 4.. CRIF1-deficient Tregs demonstrate up-regulation of the glutaminolysis pathway. FACS-sorted Foxp3-YFP+ Tregs from Foxp3YFP-Cre and Crif1fl/flFoxp3YFP-Cre mice were assessed.
(A to D) Metabolite analysis. (A) Principal components analysis. (B) Untargeted metabolite analysis. (C) Targeted metabolite analysis. Two metabolites related to the glutaminolysis pathway were analyzed. (D) Pathway analysis. Red circle and arrow indicate glutamine metabolism. (E to G) Glutaminolysis pathway–related enzyme activity and glutamine uptake. (E) Glutamine uptake. (F) Glutaminase activity. (G) Glutamate dehydrogenase (GDH) activity. (H and I) 13C-stable isotope tracer studies. (H) Schematic depiction of the isotope tracing of metabolites. (I) [U-13C5] glutamine isotope tracing. Dots represent technical replicates (C) or individual mice (E to G) (n = 4 to 8 per group). The data are pooled from at least two independent experiments and are presented as means ± SEM of biological replicates [(C) and (E) to (G)]. Alternatively, they represent at least two independent experiments (I). *P < 0.05, **P < 0.01, ***P < 0.001, and ****P < 0.0001. Statistical testing was conducted with an unpaired two-tailed t test.
Fig. 5.
Fig. 5.. The α-KG–mTORC1 axis regulates the proinflammatory cytokine production in CRIF1-deficient Tregs.
Foxp3-YFP+ Tregs from Foxp3YFP-Cre and Crif1fl/flFoxp3YFP-Cre mice were assessed. (A to D) Transcriptome analysis of TCR-stimulated and unstimulated Tregs. (A) and (B) Enrichment plot for showing overall character of CRIF1-deficient Tregs (A) and bubble plot (B) for gene set enrichment analysis (GSEA) of bulk RNA-seq data. ES, enrichment score; NES, normalized enrichment score. In (B), the bubbles encircled with green had P values of <0.05. Unstim, unstimulated; stim, overnight TCR stimulation; ∆, stim/unstim value. K, Kyoto Encyclopedia of Genes and Genomes KEGG; H, Hallmark. (C) and (D) Heatmap of self-organizing map (SOM)–clustered RNA-seq data (C) and bubble plot of the GSEA of each cluster (D). G, Gene Ontology biological process. TNF-α, tumor necrosis factor–α; JAK-STAT, Janus kinase–signal transducer and activator of transcription; MAP, mitogen-activated protein; MAPK, mitogen-activated protein kinase; NF-κB, nuclear factor κB. (E and F) Percentages of phosphorylated S6+ (p-S6+) cells after TCR stimulation. (G to J) Effect of culture in glutamine-free RPMI 1640, adding 2 mM glutamine (Gln), 1 mM α-KG, or treatment with 100 nM rapamycin on TCR-stimulated functions. (G) and (H) Percentages of cells with p-S6 expression. (I) ECAR levels after d-(+)-glucose treatment. (J) The percentages of Tregs with cytokine production. The data are pooled from at least two independent experiments and are presented as means ± SEM of biological replicates. Flow cytometry plots are representative of at least two independent experiments. *P < 0.05, **P < 0.01, ***P < 0.001, and ****P < 0.0001. Statistical testing was conducted with an unpaired two-tailed t test (F), two-way ANOVA [(H) and (J)], and one-way ANOVA (I).
Fig. 6.
Fig. 6.. The up-regulated IFN-γ and IL-4 gene transcription in CRIF1-deficient Tregs is associated with chromatin openness and transcription-factor expression.
Foxp3-YFP+ Tregs from Foxp3YFP-Cre and Crif1fl/flFoxp3YFP-Cre mice were assessed. (A to E) Integration of RNA-seq and ATAC-seq data of TCR-stimulated and unstimulated Tregs. (A) Left: Venn diagram showing the number of ATAC peaks that corresponded to genes that were up-regulated (top) or down-regulated (bottom) in the TCR-stimulated CRIF1-deficient (red) and control (blue) Tregs. (Right) Gene Ontology analysis. The size and color density of circles represent the number of genes and P values, respectively. (B) and (C) ATAC-seq peaks in and around the Ifng (B) and (C) Il4 genes in TCR-stimulated and unstimulated Tregs. (D) and (E) Modeling of the binding of transcription factors to the Ifng (D) and Il4 (E) genes. (F to H) Relationship between EOMES/SATB1 and IFN-γ/IL-4 expression. (F) Flow cytometry of EOMES and SATB1 expression in TCR-stimulated and unstimulated Tregs. Rapamycin was added to some TCR-stimulated Tregs. Dashed line indicates immunoglobulin G (IgG) control. (G) ChIP-qPCR analysis of the binding of EOMES and SATB1 to the Ifng and Il4 regulatory regions in TCR-stimulated Tregs. Rapamycin was added to some cells. (H) Flow cytometry analysis of the cytokine production of TCR-stimulated Tregs after Eomes or Satb1 were knocked down. The data are presented as means ± SEM of biological replicates and are representative of at least two independent experiments. *P < 0.05, **P < 0.01, ***P < 0.001, and ****P < 0.0001. Statistical testing was conducted with two-way ANOVA [(F) to (H)].
Fig. 7.
Fig. 7.. CRIF1-deficient Foxp3low INS-Tregs promote IFN-γ–dependent antitumor immunity.
(A to E) Solid tumors were induced in WT mice with TC-1 tumor cells and the infiltrating CD4+ T cells were subjected to flow cytometry. (A) Foxp3 expression of CD4+ T cells. (B) and (C) Mitochondrial biogenesis. (D) and (E) CRIF1 expression. (F to P) Solid tumors were induced in Foxp3EGFP-cre-ERT2 and Crif1fl/flFoxp3EGFP-cre-ERT2 mice with TC-1 cells and the mice were treated intraperitoneally with tamoxifen. (F) Treatment schedule. (G) and (H) Foxp3 expression intensity of the tumor-infiltrating Tregs. (I) and (J) Cytokine production of the tumor-infiltrating Tregs. (K) and (L) Foxp3 expression intensity (K) and cytokine production (L) of splenic and LN Tregs. (M) Tumor volume. (N) Tumor weight at day 17. (O) Gross tumor images at day 17. (P) Flow cytometric frequencies of immune cells in the TC-1 tumor model. Myeloid cells (left) and lymphoid cells (right). Myeloid and lymphoid cells are gated from live CD45+ cells and lymphoid cells, respectively. (Q) Cytokine production of tumor-infiltrating CD4+ and CD8+ T cells. (R to V) Solid tumors were induced in Foxp3EGFP-cre-ERT2 and Crif1fl/flFoxp3EGFP-cre-ERT2 mice with TC-1 cells and the mice were treated intraperitoneally with tamoxifen with or without blocking anti–IFN-γ, anti–IL-4, or isotype-control antibodies. (R) Tumor volume. (S) Tumor weight at day 17. (T) Gross tumor images at day 17. (U) and (V) Cytokine production of tumor-infiltrating Tregs (T) and CD4+ and CD8+ T cells (U). Dots represent individual mice (n = 5 to 16 per group). The data are pooled from at least two independent experiments and are presented as means ± SEM of biological replicates. Flow cytometry plots are representative of at least two independent experiments. *P < 0.05, **P < 0.01, ***P < 0.001, and ****P < 0.0001. Statistical testing was conducted with Wilcoxon test [(C) and (E)], an unpaired two-tailed t test [(H) to (Q)], and one-way ANOVA [(R), (S), (U), and (V)]. PMN, polymorphonuclear.

References

    1. Josefowicz S. Z., Lu L. F., Rudensky A. Y., Regulatory T cells: Mechanisms of differentiation and function. Annu. Rev. Immunol. 30, 531–564 (2012). - PMC - PubMed
    1. Sakaguchi S., Mikami N., Wing J. B., Tanaka A., Ichiyama K., Ohkura N., Regulatory T cells and human disease. Annu. Rev. Immunol. 38, 541–566 (2020). - PubMed
    1. O’Callaghan D. S., Rexhepaj E., Gately K., Coate L., Delaney D., O’Donnell D. M., Kay E., O’Connell F., Gallagher W. M., O’Byrne K. J., Tumour islet Foxp3+ T-cell infiltration predicts poor outcome in nonsmall cell lung cancer. Eur. Respir. J. 46, 1762–1772 (2015). - PubMed
    1. Saleh R., Elkord E., FoxP3+ T regulatory cells in cancer: Prognostic biomarkers and therapeutic targets. Cancer Lett. 490, 174–185 (2020). - PubMed
    1. Guo J., Zhou X., Regulatory T cells turn pathogenic. Cell. Mol. Immunol. 12, 525–532 (2015). - PMC - PubMed

Publication types