. 2024 May:119:102873.
doi: 10.1016/j.ceca.2024.102873. Epub 2024 Mar 20.

Utilization of the genetically encoded calcium indicator Salsa6F in cardiac applications

Affiliations

Utilization of the genetically encoded calcium indicator Salsa6F in cardiac applications

Karla M Márquez-Nogueras et al. Cell Calcium. 2024 May.

Abstract

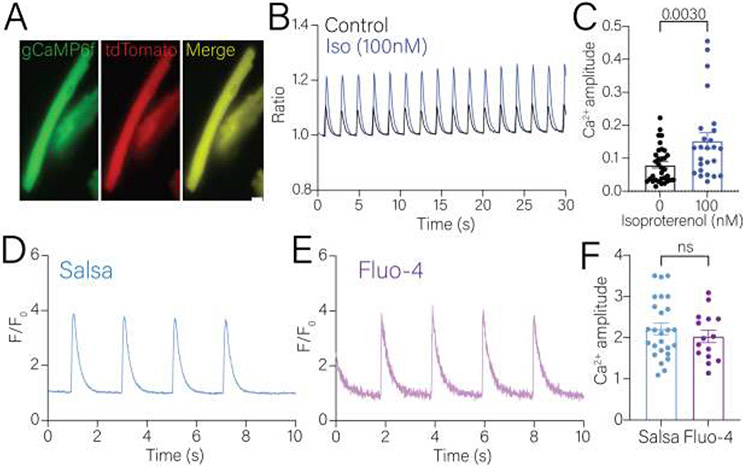
Calcium signaling is a critical process required for cellular mechanisms such as cardiomyocyte contraction. The inability of the cell to properly activate or regulate calcium signaling can lead to contractile dysfunction. In isolated cardiomyocytes, calcium signaling has been primarily studied using calcium fluorescent dyes, however these dyes have limited applicability to whole organs. Here, we crossed the Salsa6f mouse which expresses a genetically encoded ratiometric cytosolic calcium indicator with a cardiomyocyte specific inducible cre to temporally-induce expression and studied cytosolic calcium transients in isolated cardiomyocytes and modified Langendorff heart preparations. Isolated cardiomyocytes expressing Salsa6f or Fluo-4AM loaded were compared. We also crossed the Salsa6f mouse with a floxed Polycystin 2 (PC2) mouse to test the feasibility of using the Salsa6f mouse to measure calcium transients in PC2 heterozygous or homozygous knock out mice. Although there are caveats in the applicability of the Salsa6f mouse, there are clear advantages to using the Salsa6f mouse to measure whole heart calcium signals.

Keywords: Calcium handling; Calcium transients; Cardiomyocyte; Genetically encoded calcium indicators.


Conflict of interest statement

Declaration of competing interest The authors declare the following financial interests/personal relationships which may be considered as potential competing interests: Karla M. Márquez-Nogueras, Aleksey V. Zima and Ivana Y. Kuo reports financial support was provided by National Institute of Health.

Figures

Figure 1.
Figure 1.. Cardiac function of Salsa6f expressing mice is not affected.
A. Electrocardiogram of non-expressing Salsa6f (Control) mice (top) and Salsa6f expressing mice (bottom). B. No significant difference was observed of the left ventricle mass between the control (black) and the Salsa6f (gold) expressing mice. Dots represent individual mice. Bars represent mean±SEM. C-D. Quantification of the ejection fraction and fractional shortening showed no significant difference between control and Salsa expressing mice. Dots represent individual mice. Bars represent mean±SEM. E-G. Left ventricular diameter (LV/ID) (E), left ventricular posterior wall (LV/PW) (F), left ventricular anterior wall (LV/AW) (G) showed no difference between control and Salsa6f expressing mice. Dots represent individual mice. Bars represent mean±SEM. H. Heartbeat between the control and Salsa6f expressing mice are within normal range. Dots represent individual mice. Bars represent mean±SEM.
Figure 2.
Figure 2.. Measurement of calcium transients of isolated single cardiomyocytes.
A. Representative images of isolated Salsa6f expressing cardiomyocytesX. B. Representative calcium transients of electrically paced cardiomyocytes in the absence (black line) or presence of 10nM isoproterenol (blue line) acquired with wide-field microscopy. C. Cytosolic systolic calcium amplitude was significantly increased in isolated single cardiomyocytes in the presence of 10nM isoproterenol (blue bar). D, E. Representative calcium transients of Salsa expressing (D) or Fluo-4AM loaded (E) cardiomyocytes acquired with confocal line-scan microscopy. F. Calcium amplitude was similar in the electrically paced Salsa6f or Fluo-4AM loaded cardiomyocyte. Dots represent individual cardiomyocytes analyzed. Statistical analysis was performed using student’s t-test. N=4 animals each for the Salsa6f and Fluo4 conditions.
Figure 3.
Figure 3.. Paired measurements of calcium transients in cardiomyocytes.
A, F. Representative calcium transients with a pacing-Caffeine(10mM)-pacing protocol in Salsa6f expressing (A) or Fluo-4AM loaded (F) cardiomyocytes before and after the addition of 100nM of isoproterenol. B, G. The voltage evoked calcium amplitude before and after presence of 100nM isoproterenol in Salsa6f expressing (B) or Fluo-4AM loaded (G) cardiomyocytes. C, H. The tau of decay of the evoked calcium amplitude before and after presence of 100nM isoproterenol in Salsa6f expressing (C) or Fluo-4AM loaded (H) cardiomyocytes. D, I. The caffeine evoked calcium amplitude before and after presence of 100nM isoproterenol in Salsa6f expressing (D) or Fluo-4AM loaded (I) cardiomyocytes. E, J. The calcium amplitude of the first evoked transient after store depletion, representing the L-type current, before and after presence of 100nM isoproterenol in Salsa6f expressing (E) or Fluo-4AM loaded (J) cardiomyocytes Dots represent individual cardiomyocytes analyzed. Statistical analysis was performed using paired analysis of individual cardiomyocytes. N=3-4 animals each for the Salsa6f and Fluo4 conditions. p-values are listed in the figure.
Figure 4.
Figure 4.. Comparison of paired measurements of calcium transients in Salsa6f or Fluo-4 cardiomyocytes.
A. Percentage of calcium amplitude between Salsa6f or Fluo-4 cardiomyocytes in the absence of isoproterenol. B. Percentage of calcium amplitude between Salsa6f or Fluo-4 cardiomyocytes in the presence of 100nM isoproterenol. C. Percentage of recovery in the 5th transient after caffeine between Salsa6f or Fluo-4 cardiomyocytes in the absence of isoproterenol. D. Percentage of recovery in the 5th transient after caffeine between Salsa6f or Fluo-4 cardiomyocytes in the presence of 100nM isoproterenol. E. Percentage of recovery in the 15th transient after caffeine between Salsa6f or Fluo-4 cardiomyocytes in the absence of isoproterenol. F. Percentage of recovery in the 15th transient after caffeine between Salsa6f or Fluo-4 cardiomyocytes in the presence of 100nM isoproterenol. The data analyzed and presented in this figure are from the same cells analyzed for Figure 3.
Figure 5.
Figure 5.. Imaging of excised whole hearts expressing Salsa6f.
A. Images of the experimental and imaging setup of the excised hearts expressing Salsa6f. B. Representative images of Salsa6f expressing right atria and ventricle. C. Representative tracing of baseline calcium transients (top) and after the addition of 10nM of isoproterenol (bottom) of Salsa6f transient hearts. D. Systolic calcium amplitude was significantly increase after the addition of 10nM of isoproterenol. Dots represent individual mice. N=5-6 mice. Bar graphs represent mean±SEM. Statistical analysis was performed using student’s t-test. p-values are listed in the figure.
Figure 6.
Figure 6.. Analysis of calcium transient from whole hearts in heterozygous and homozygous cardiac deletion of PC2 mice.
A. Representative calcium transient before and after addition of isoproterenol (10nM) in PC2 heterozygous (top) or knock out (bottom) mice. B. Heart rate of heterozygous mice was not increased after the addition of isoproterenol while it significantly increased in the knockout mice. Bar graphs are mean±SEM. Dots represent individual mice (n=5-6 mice). Statistical analysis was performed using 2-way ANOVA. p-values listed in figure. C. Area under the curve in control (black bars), PC2 heterozygous (green bars) and PC2 knock-out (red) in the absence or presence of isoproterenol. Bar graphs are mean±SEM per mouse. Each bar represents a single mouse, with multiple regions of interest (up to 5). Statistical analysis was performed using a nested t-test comparing between drug treatment. D. Peak cytosolic systolic calcium in control (black bars), of PC2 heterozygous (green bars) and PC2 knock out (red bars) in the presence or absence of isoproterenol. Statistical analysis was performed using a nested t-test comparing between drug treatment. p-values listed in figure. Bar graphs are mean±SEM per mouse. Each bar represents a single mouse, with multiple regions of interest (up to 5).

Update of

References

    1. Morciano G., et al., Calcium dysregulation in heart diseases: Targeting calcium channels to achieve a correct calcium homeostasis. Pharmacol Res, 2022. 177: p. 106119. - PubMed
    1. Demydenko K and Roderick HL, The cardiomyocyte firestarter-RyR clusters ignite their neighbours after augmentation of Ca(2+) release by beta-stimulation. Acta Physiol (Oxf), 2022. 234(4): p. e13798. - PubMed
    1. Rietdorf K., et al., Pulmonary vein sleeve cell excitation-contraction-coupling becomes dysynchronized by spontaneous calcium transients. Biochem Soc Trans, 2015. 43(3): p. 410–6. - PubMed
    1. Luo M and Anderson ME, Mechanisms of altered Ca(2)(+) handling in heart failure. Circ Res, 2013. 113(6): p. 690–708. - PMC - PubMed
    1. Gilbert G., et al., Calcium Signaling in Cardiomyocyte Function. Cold Spring Harb Perspect Biol, 2020. 12(3). - PMC - PubMed

LinkOut - more resources