. 2024 Oct 3;147(10):3379-3394.
doi: 10.1093/brain/awae097.

Ophthalmate is a new regulator of motor functions via CaSR: implications for movement disorders

Affiliations

Ophthalmate is a new regulator of motor functions via CaSR: implications for movement disorders

Sammy Alhassen et al. Brain. .

Abstract

Dopamine's role as the principal neurotransmitter in motor functions has long been accepted. We broaden this conventional perspective by demonstrating the involvement of non-dopaminergic mechanisms. In mouse models of Parkinson's disease, we observed that L-DOPA elicited a substantial motor response even when its conversion to dopamine was blocked by inhibiting the enzyme aromatic amino acid decarboxylase (AADC). Remarkably, the motor activity response to L-DOPA in the presence of an AADC inhibitor (NSD1015) showed a delayed onset, yet greater intensity and longer duration, peaking at 7 h, compared to when L-DOPA was administered alone. This suggests an alternative pathway or mechanism, independent of dopamine signalling, mediating the motor functions. We sought to determine the metabolites associated with the pronounced hyperactivity observed, using comprehensive metabolomics analysis. Our results revealed that the peak in motor activity induced by NSD1015/L-DOPA in Parkinson's disease mice is associated with a surge (20-fold) in brain levels of the tripeptide ophthalmic acid (also known as ophthalmate in its anionic form). Interestingly, we found that administering ophthalmate directly to the brain rescued motor deficits in Parkinson's disease mice in a dose-dependent manner. We investigated the molecular mechanisms underlying ophthalmate's action and discovered, through radioligand binding and cAMP-luminescence assays, that ophthalmate binds to and activates the calcium-sensing receptor (CaSR). Additionally, our findings demonstrated that a CaSR antagonist inhibits the motor-enhancing effects of ophthalmate, further solidifying the evidence that ophthalmate modulates motor functions through the activation of the CaSR. The discovery of ophthalmate as a novel regulator of motor function presents significant potential to transform our understanding of brain mechanisms of movement control and the therapeutic management of related disorders.

Keywords: CaSR; Parkinson’s disease; dopamine; motor; ophthalmate.


Conflict of interest statement

A.A. and O.C. are inventors on a pending patent application that covers the role of ophthalmate and CaSR in motor functions. The remaining authors declare no competing interests.

Figures
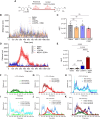
Figure 1
Figure 1
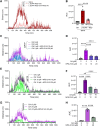
Motor response to L-DOPA is enhanced by inhibition of DOPA decarboxylase in mouse model of Parkinson’s disease. (A) The biosynthesis of dopamine from L-DOPA and its proposed inhibition by benserazide and NSD1015 (NSD) in the periphery and the CNS, respectively. (B and C) Effects of L-DOPA and NSD on normal mice. The mice were injected subcutaneously (s.c.) with a vehicle, and 18 h later, injected intraperitoneally (i.p.) with either NSD1015 or saline, followed by an L-DOPA/benserazide (100/25 mg/kg) or saline injection 30 min after. Motor activity was monitored for 20 h. Data represent (B) the time course and (C) the area under the curve (AUC) of the effects of L-DOPA, NSD, and combination of L-DOPA and NSD. One-way ANOVA, followed by Tukey’s post hoc test, ns = not significant. Values are expressed as mean ± standard error of the mean (SEM), n = 8 for each group. (D and E) Effects of L-DOPA and NSD on reserpinized mice: Mice were injected (s.c.) with reserpine 1 mg/kg, and 18 h later, mice were injected with NSD or saline, followed by an L-DOPA injection 30 min after. Locomotion was monitored for 20 h. Data represent the (D) time course of the effect of L-DOPA alone and L-DOPA in conjunction with NSD, and (E) the AUC. One-way ANOVA, followed by Tukey’s post hoc test, ****P < 0.0001. Values are expressed as mean ± SEM, n = 6–8 for each group. (FK) Effects of varying doses of L-DOPA and NSD on motor activity in reserpine-treated mice. Mice were injected (s.c.) with reserpine 1 mg/kg and 18 h later, mice were injected (i.p.) with varying doses of NSD, followed by varying doses of L-DOPA 30 min after. Locomotion was monitored for 20 h. The same data are presented in two clusters of figures. (FH) Data represent the time course of the effect of varying doses of NSD with fixed doses of L-DOPA (F: 50 mg/kg, G: 100 mg/kg, H: 200 mg/kg). (IK ) Data represent the timecourse of the effect of varying doses of L-DOPA with fixed doses of NSD (I: 50 mg/kg, J: 100 mg/kg, K: 200 mg/kg). Values are expressed as mean ± SEM, n = 6–8 for each group.
Figure 2
Figure 2
Motor response to L-DOPA and aromatic amino acid decarboxylase (AADC) inhibitor correlates with alterations in brain and striatum metabolites, with highest alteration in ophthalmate levels. (A) The study’s experimental design and timeline. Mice were injected subcutaneously (s.c.) with reserpine 1 mg/kg. After 18 h, the mice were treated with NSD1015 (NSD) or saline, followed by L-DOPA/benserazide administration 30 min later. Brain tissues were collected from the two treatment groups at two time points (2 and 7 h after L-DOPA administration). The brains were divided into two hemispheres, with one hemisphere homogenized entirely, and the other hemisphere was used to extract the striatum, n = 6 for each group. Diagram created using images from BioRender.com. (B) Unsupervised principal component analysis (PCA) of the metabolomics data of mouse whole brain and striatum from the two treatment groups at the two time points. (C) Volcano plot illustrating the differential expression of metabolites in the brains of L-DOPA + NSD treated mice compared to L-DOPA treated mice, with brain samples taken 2 h post-DOPA injection. (D) Volcano plot showing the differential expression of metabolites in the brains of l-DOPA + NSD treated mice versus L-DOPA treated mice, with brain samples obtained 7 h after L-DOPA injection. One-way ANOVA contrasts: significantly increased metabolites in red, and significantly decreased metabolites in blue. (E) Volcano plot displaying the differential expression of metabolites in the brains of L-DOPA + NSD treated mice at 7 h compared to L-DOPA + NSD treated mice at 2 h post-DOPA injection. One-way ANOVA contrasts: significantly increased metabolites in red, and significantly decreased metabolites in blue. (F) Volcano plot demonstrating the differential expression of metabolites in the striatum tissues of L-DOPA + NSD treated mice in comparison to L-DOPA treated mice, with brain samples collected 7 h following L-DOPA injection. One-way ANOVA contrasts: significantly increased metabolites in red, and significantly decreased metabolites in blue. (G) List of top altered metabolites in the brains of different treatment groups (≥2-fold change, q < 0.05, one-way ANOVA contrasts), x-axis represents fold changes.
Figure 3
Figure 3
Motor response to L-DOPA and aromatic amino acid decarboxylase (AADC) inhibitor is associated with alterations in dopamine and ophthalmate synthesis pathways. (A) Box plot legend showing the range, median and quartiles. (B) The fold-changes in the major components of dopamine synthesis pathway after L-DOPA and L-DOPA/NSD1015 (NSD) administration. (C) The fold-changes in ophthalmate and the key metabolites of the proposed pathways leading to its synthesis. The asterisk is used to compare metabolite levels within the same group at the two different time points, whereas the hashtag is used to compare metabolite levels between the two treatment groups at the same time point. *,#q < 0.05, **,##q < 0.01, ***,###q < 0.001, ****,####q < 0.0001. 2-AB = 2-aminobutyrate, α-KB = α-ketobutyrate; α-KG = α-ketoglutarate; GCS = glutamate-cysteine synthase; Glu = glutamate; Gly = glycine; GS = glutathione synthase; Hcy = homocysteine; SAH = S-adenosylhomocysteine; SAM = S-adenosylmethionine.
Figure 4
Figure 4
Central but not peripheral ophthalmate rescues motor activity in MPTP mouse model of Parkinson’s disease. Mice were given MPTP injections intraperitoneally (i.p.) at 20 mg/kg over 3 days. Ophthalmate was administered 24 h after the final MPTP injection, and motor activity was monitored for the following 20 h. For the central ophthalmate experiments, mice underwent a surgical procedure to implant a cannula for intracerebroventricular (i.c.v.) injections a week prior to receiving the MPTP injection. (A) Representative immunostaining of tyrosine hydroxylase (TH, green) and DAPI (blue), showing the effect of MPTP on dopamine neuronal loss in the substantia nigra; (B) the time course of the effect of MPTP; (C) the area under the curve (AUC) of the effect of MPTP during the 20-h experiment time. Unpaired t-test, ****P < 0.0001. (D) Peripheral ophthalmate injection did not induce motor activity in MPTP-treated mice. Data represent the time course of the effect of ophthalmate injected i.p. at three different doses and are expressed as mean ± standard error of the mean (SEM), n = 8 for each group. (EH) The effect of central administration of ophthalmate on the motor activity of MPTP-treated mice. The data presented include (E) the time course of the effect of ophthalmate injected (i.c.v.) at four different doses; (F) the AUC of the effect of different doses of ophthalmate during the 20-h experiment time; (G) the AUC of the effect of different doses of ophthalmate during the first 10 h of the experiment time; and (H) the AUC of the effect of different doses of ophthalmate during the 11–20 h of the experiment time. In FH, one-way ANOVA, followed by Tukey’s post hoc test, *P < 0.05, ****P < 0.0001, ns = not significant. Data are expressed as mean ± SEM, n = 6–8 for each group. (I) Deuterated ophthalmate (D5-OA) levels following peripheral administration. Mice were injected (i.p.) with D5-OA and the brain, blood, kidney and liver samples were collected 10 min after injection. Data represent the interpolated concentrations of D5-OA using mass spectrometry (MS) and are expressed as mean ± SEM, n = 6 for each group.
Figure 5
Figure 5
Ophthalmate binds to, and activates, CaSRs. (A and B) Saturation curve of 3H-OA binding to mouse brain sections in the presence of unlabelled ophthalmate, NPS2143, Ca2+ and L-DOPA. 3H-OA binding was carried out as described in the methods section. (A) Reprehensive plot of total, specific and non-specific binding of 3H-OA to mouse brain sections. Non-specific binding was determined as the levels of 3H-OA binding in the presence of 100 μM unlabelled ophthalmate. (B) Representative plot of specific binding of 3H-OA binding to mouse brain sections, where non-specific bindings were defined as the levels of 3H-OA binding in the presence of 10 μM NPS-2143, 100 μM calcium and 100 μM L-DOPA. (C) Representative plot of specific binding of 3H-OA binding to mouse brain sections, where non-specific binding was defined as the level of 3H-OA binding in the presence of combinations of NPS-2143+ Ca2+, L-DOPA + Ca2+, and NPS-2143 + L-DOPA. In all binding experiments, the degree of binding is expressed in disintegrations per minute (dpm). Data represent binding from three experiments for each point (total 36 sections repeat for each point). (D) Inhibition of 3H-OA binding to mouse brain sections by Ca2+. Competition experiments were carried out as described in the methods. Radioligand binding assay was performed in the presence of 2.5 µM 3H-OA and increasing concentrations of Ca2+. Each point represents the mean ± standard error of the mean (SEM) of at least three measurements from three experiments. (EG) Forskolin- stimulated cyclic AMP (cAMP) Glo-sensor luminescence responses in Human embryonic kidney 203 (HEK293) cells transiently transfected with the Glo-sensor cAMP biosensor and the CaSR plasmid. [E(iiii)] Representative dose-response curves of cAMP signal for (i) Ca2+, (ii) OA and (iii) L-DOPA, with and without CaSR antagonist NPS-2143. [F(iiii)] Maximum signalling capacity (Emax) of (i) Ca2+, (ii) OA and (iii) L-DOPA at CaSR in the absence and presence of CaSR antagonist NPS-2143. [G(iiii)] EC50 of (i) Ca2+, (ii) OA and (iii) L-DOPA at CaSR in the presence and absence of CaSR antagonist NPS-2143. Unpaired t-test, *P < 0.05, **P < 0.01, ***P < 0.001, ****P < 0.0001, ns = not significant. (HK) Docking models ligand-bound states in CaSR binding site in domain A (named A in amino acid hereinafter). (H) Cartoon presentation of ligand-bound CaSR structure (domain A) in the closed-closed conformation (5 Å). (I) Interface analysis of tryptophan (TRP)-bound state in CaSR; binding is shown with Ser170A, Ser147A, Ala298A, and Thr 145A and Ala168A. (J) Interface analysis of OA bound state in CaSR; binding is shown with Ser147A, Gly148A, Tyr218A, Ser170A, Asp216A, and Ala168A, Val149A. (K) Interface analysis of L-DOPA bound state in CaSR; binding is shown with Tyr218A, Ser170A, Asp216A, and Ala168A. Green curve shows the transition state of Ala298A and Thr 145A in the Trp-bound state, Gly146A in the OA-bound state and Tyr218A in DOPA-bound state.
Figure 6
Figure 6
CaSR mediates the motor-enhancing effects of L-DOPA/NSD1015 and ophthalmate in Parkinson’s disease mice. (A and B) CaSR antagonist NPS-2143 inhibition of motor response induced by L-DOPA/NSD1015 in MPTP-treated mice. Mice were injected intraperitoneally (i.p.) with MPTP 20 mg/kg for 3 days. The following day, mice were injected (i.p.) with NSD1015 or saline (Sal), followed by a Sal or L-DOPA injection 30 min after, with or without NPS2143. Locomotion was monitored for 20 h. Data represent (A) the time course and (B) the area under the curve (AUC) of the effect of NSD1015 and L-DOPA with or without NPS2143. One-way ANOVA, followed by Tukey’s post hoc test. Values are expressed as mean ± standard error of the mean (SEM), n = 8 for each group. ****P < 0.0001. (CF) CaSR antagonist inhibits ophthalmate-induced motor response in MPTP-treated mice. Mice were anaesthetized and underwent surgery where a cannula was implanted for future intracerebroventricular (i.c.v.) injections. Following recovery, the mice were injected (i.p.) with MPTP 20 mg/kg for 3 days. On the day following the final MPTP treatment, mice were injected i.c.v. with ophthalmate at (C and D) 5 µM and (E and F) 10 µM with or without NPS2143 (10 µM and 20 µM). Locomotion was monitored for 20 h. Data represent (C and E) the time course and (D and F) the AUC of the effect of ophthalmate with and without NPS2143 on motor activity. In D and F, one-way ANOVA, followed by Tukey’s post hoc test. **P < 0.01, ****P < 0.0001. Values are expressed as mean ± SEM, n = 6–8 for each group. (G and H) CaSR antagonist NPS2143 inhibits ophthalmate-induced motor response in reserpine-treated mice. Mice were injected subcutaneously (s.c.) with reserpine 1 mg/kg, and 18 h later, mice were injected (i.c.v) with ophthalmate (10 µM) with or without NPS2143 (20 µM). The (G) time course and (H) the AUC of the effect of ophthalmate with and without NPS2143 on motor activity. In H, one-way ANOVA, followed by Tukey’s post hoc test. ****P < 0.0001.

Similar articles

Cited by

References

    1. Bartholini G, Burkard WP, Pletscher A, Bates HM. Increase of cerebral catecholamines caused by 3,4-dihydroxyphenylalanine after inhibition of peripheral decarboxylase. Nature. 1967;215:852–853. - PubMed
    1. Hornykiewicz O. The mechanisms of action of L-dopa in Parkinson’s disease. Life Sci. 1974;15:1249–1259. - PubMed
    1. Papavasiliou PS, Cotzias GC, Duby SE, Steck AJ, Fehling C, Bell MA. Levodopa in parkinsonism: Potentiation of central effects with a peripheral inhibitor. N Engl J Med. 1972;286:8–14. - PubMed
    1. Lieberman A, Goodgold A, Jonas S, Leibowitz M. Comparison of dopa decarboxylase inhibitor (carbidopa) combined with levodopa and levodopa alone in Parkinson’s disease. Neurology. 1975;25:911–916. - PubMed
    1. Grotzsch H, Sztajzel R, Burkhard PR. Levodopa-induced ocular dyskinesia in Parkinson’s disease. Eur J Neurol. 2007;14:1124–1128. - PubMed