. 2024 Sep 3;147(9):3234-3246.
doi: 10.1093/brain/awae096.

Central visual pathways affected by degenerative retinal disease before and after gene therapy

Affiliations

Central visual pathways affected by degenerative retinal disease before and after gene therapy

Manzar Ashtari et al. Brain. .

Abstract

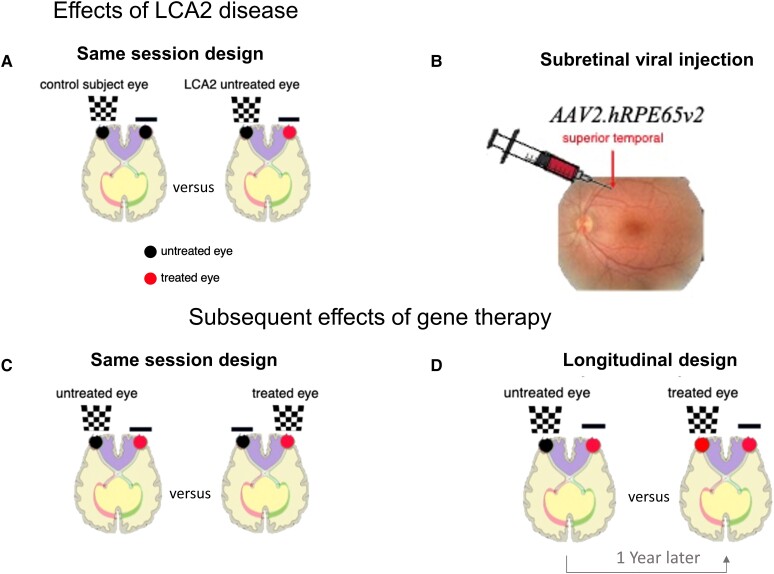
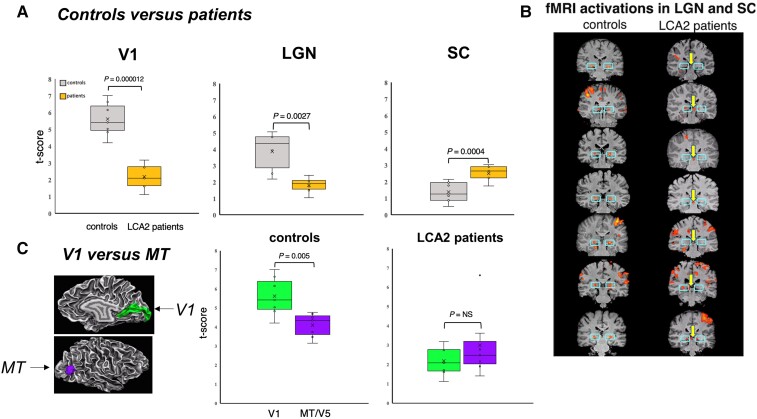
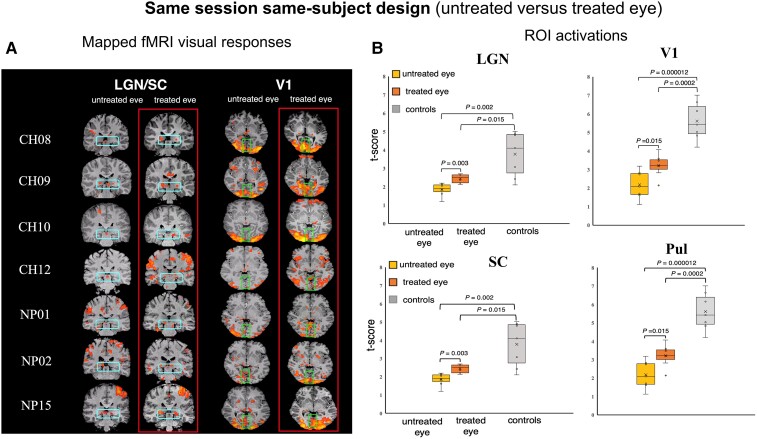
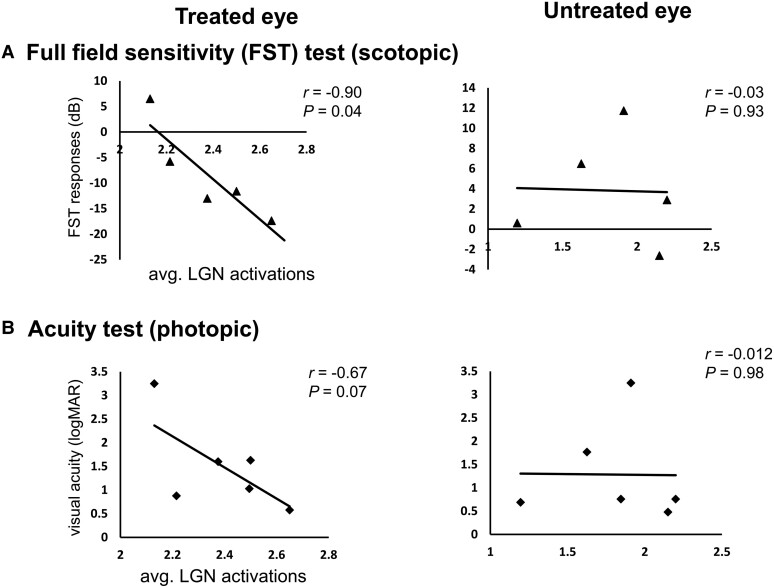
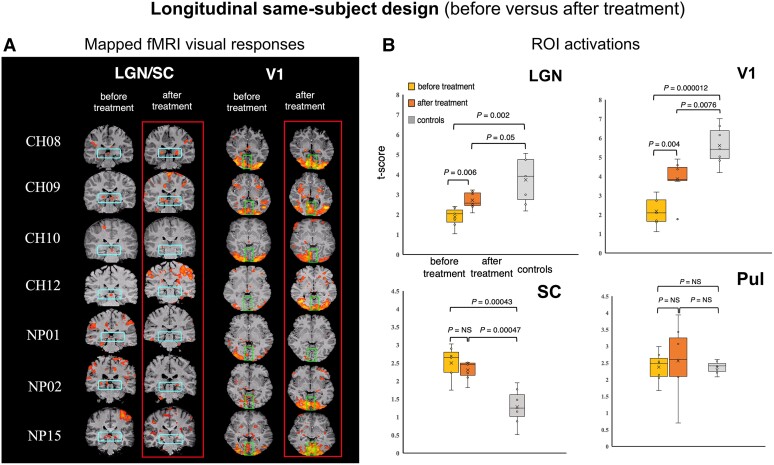
Genetic diseases affecting the retina can result in partial or complete loss of visual function. Leber's congenital amaurosis (LCA) is a rare blinding disease, usually inherited in an autosomally recessive manner, with no cure. Retinal gene therapy has been shown to improve vision in LCA patients caused by mutations in the RPE65 gene (LCA2). However, little is known about how activity in central visual pathways is affected by the disease or by subsequent gene therapy. Functional MRI (fMRI) was used to assess retinal signal transmission in cortical and subcortical visual structures before and 1 year after retinal intervention. The fMRI paradigm consisted of 15-s blocks of flickering (8 Hz) black and white checkerboards interleaved with 15 s of blank (black) screen. Visual activation in the brain was assessed using the general linear model, with multiple comparisons corrected using the false discovery rate method. Response to visual stimulation through untreated eyes of LCA2 patients showed heightened fMRI responses in the superior colliculus and diminished activities in the lateral geniculate nucleus (LGN) compared to controls, indicating a shift in the patients' visual processing towards the retinotectal pathway. Following gene therapy, stimuli presented to the treated eye elicited significantly stronger fMRI responses in the LGN and primary visual cortex, indicating some re-engagement of the geniculostriate pathway (GS) pathway. Across patients, the post-treatment LGN fMRI responses correlated significantly with performance on a clinical test measuring light sensitivity. Our results demonstrate that the low vision observed in LCA2 patients involves a shift in visual processing toward the retinotectal pathway, and that gene therapy partially reinstates visual transmission through the GS pathway. This selective boosting of retinal output through the GS pathway and its correlation to improved visual performance, following several years of degenerative retinal disease, is striking. However, while retinal gene therapy and other ocular interventions have given hope to RPE65 patients, it may take years before development of therapies tailored to treat the diseases in other low vision patients are available. Our demonstration of a shift toward the retinotectal pathway in these patients may spur the development of new tools and rehabilitation strategies to help maximize the use of residual visual abilities and augment experience-dependent plasticity.

Keywords: brain plasticity; geniculostriate pathway; retinal gene therapy; retinotectal pathway; visual system.


Conflict of interest statement

J.B. reports that she and her husband were co-authors on a patent licensed by Spark Therapeutics that described retinal gene therapy in LCA2 patients but that they waived any potential financial gain in 2002. J.B. consulted for Spark Therapeutics on preclinical data and how it could relate to delivery of voretigene neparvovec-rzyl to patients in Canada and Japan. J.B. reports serving on the boards and scientific advisory boards of several different gene therapy companies. She also has some intellectual property that is managed by the University of Pennsylvania.

Figures

Figure 1
Figure 1
Schematic diagram of study design. (A) The first fMRI study focused on examining the effects of LCA2 disease on the visual system by comparing the fMRI responses of the untreated eye to those of controls using the same visual stimuli. (B) The wild-type copy of the RPE65 cDNA was delivered through the AAV2 vector to the superior temporal location of the retina. (C) The second fMRI study was to assess the effects of retinal gene therapy on the visual system by comparing the visual responses from the previously treated eye to the responses from the untreated eye within the same fMRI scanning session. Here the untreated eye is shown in black and the eye with intervention is shown in red colour. (D) The third fMRI experiment was carried out 1 year after the untreated eye received subretinal viral injection. The study was carried out in two separate fMRI scanning sessions 1 year apart. In the first session the fMRI was performed on the untreated eye and in the second session (1 year later) fMRI was performed on the same eye 1 year after its retinal intervention using the same visual stimuli. LCA = Leber’s congenital amaurosis.
Figure 2
Figure 2
Comparison of the LGN and superior colliculus fMRI activations. (A) The average lateral geniculate nucleus (LGN) activation in response to vision stimulation in LCA2 patients was significantly (P = 0.003) lower than in normal sighted controls. In contrast, the average superior colliculus (SC) activation was significantly (P = 0.0004) higher in the LCA2 patients compared to controls. (B) Patterns of fMRI activations for LGN (blue boxes) and SC (yellow arrows) in controls (left column) and LCA2 patients (right column). (C) In controls, the activation in V1 (shown in green) was significantly (P = 0.005) higher than in MT/V5 (shown in purple) area. No such difference was observed in the LCA2 patients. In fact, while sighted controls presented with significantly lower activation levels within MT/V5 versus V1, LCA2 patients showed slightly higher levels of activations in MT/V5 versus V1, although not significant (NS). This may show the resilience of the large receptive field cell populations within the MT/V5 area to the RPE65 disease compared to midget cell population in the primary visual cortex (V1). LCA = Leber’s congenital amaurosis.
Figure 3
Figure 3
Same session study design fMRI results. Within-subject comparison of visual activation of treated versus untreated eye of LCA2 patients, with each eye’s data collected in the same fMRI scanning session. fMRI experiments were performed monocularly for both patients and controls to evaluate the treated and untreated eye separately. (A) The subcortical (blue boxes) and cortical visual activation patterns (green boxes) are shown for each patient for the same session design, conventions as above. Stimulation of the treated eye led to stronger activation in both the lateral geniculate nucleus (LGN) and V1 regions of interest (ROIs). (B) ROI (Supplementary Figs 1and 2) quantification revealed that stimulation of the treated eye led to significantly stronger fMRI activation in the LGN (P = 0.003) and V1 (P = 0.015) than stimulation of the untreated eye. Treatment did not affect activation of the superior colliculus (SC), which remained elevated relative to controls following stimulation of both treated (P = 0.004) and untreated (P = 0.03) eyes. There were no significant differences in pulvinar activations between patients and controls. Sighted controls showed significantly enhanced fMRI responses to the same visual stimulation of the treated or untreated eye of the LCA2 patients in LGN and V1 areas. Conversely, control responses to the visual stimuli in the SC area was significantly lower compared to the SC responses in the treated or untreated eyes. No significant changes were observed in pulvinar activations when comparing sighted controls and patients.
Figure 4
Figure 4
Lateral geniculate nucleus activation correlations with clinical measures. Pearson correlations were performed between averaged lateral geniculate nucleus (LGN) fMRI responses and two important LCA2 patient’s outcome measures: full field sensitivity threshold (FST) responses to blue light and visual acuity (VA). (A) FST responses to the blue colour stimuli from the treated eye also correlated negatively (r = −0.90, P = 0.04) with the magnitude of LGN fMRI responses, where lower FST values indicate higher visual sensitivity. (B) Across subjects, visual acuity measures of the treated eye correlated negatively with the magnitude of LGN fMRI responses of the same eye (r = −0.67, P = 0.07), where lower LogMAR values indicate higher visual acuity. Two patients did not undergo the FST tests as this clinical test was not available at the time of their retinal intervention and one subject’s visual acuity test was excluded due to a macular hole (Supplementary Table 1).
Figure 5
Figure 5
Longitudinal study design fMRI results. Longitudinal, within-subject comparison of visual activation before and 1 year after RPE65 treatment. Functional MRI experiments were performed monocularly for both patients and controls to evaluate the treated and untreated eye separately. (A) The cortical and subcortical visual activation patterns are shown for each patient for the longitudinal same-subject design, same conventions as before. Following treatment, stimulation of the treated eye led to stronger activations in lateral geniculate nucleus (LGN) and V1 in most patients. (B) Region of interest (ROI) quantification of visual responses in the untreated eye at baseline versus responses from the same eye 1 year after retinal gene therapy and compared to responses from sighted controls. One year after treatment, monocular stimulation of the treated eye led to significant higher visual activation of the LGN (P = 0.006) and V1 (P = 0.004). The treatment did not affect the superior colliculus (SC) activation before and after gene therapy, but the SC activation was elevated both before (P = 0.00043) and after (P = 0.00047) gene therapy compared to sighted controls. There were no significant (NS) differences in pulvinar (Pul) activations between patients compared to controls. Thus, the findings from the longitudinal design matched those of the same-session study design. Similar to the same session fMRI results, in the longitudinal study, controls showed significantly enhanced fMRI responses to the treated or untreated eye of the LCA2 patients in LGN and V1 ROIs. On the contrary, SC responses of the control group was significantly lower compared to the SC responses of the treated or untreated eyes.

Similar articles

Cited by

References

    1. Nassi JJ, Callaway EM. Parallel processing strategies of the primate visual system. Nat Rev Neurosci. 2009;10:360–372. - PMC - PubMed
    1. Kim US, Mahroo OA, Mollon JD, Yu-Wai-Man P. Retinal ganglion cells-diversity of cell types and clinical relevance. Front Neurol. 2021;12:661938. - PMC - PubMed
    1. Perry VH, Oehler R, Cowey A. Retinal ganglion cells that project to the dorsal lateral geniculate nucleus in the macaque monkey. Neuroscience. 1984;12:1101–1123. - PubMed
    1. Briggs F, Usrey WM. Corticogeniculate feedback and visual processing in the primate. J Physiol. 2011;589(Pt 1):33–40. - PMC - PubMed
    1. Bridge H, Hicks SL, Xie J, et al. . Visual activation of extra-striate cortex in the absence of V1 activation. Neuropsychologia. 2010;48:4148–4154. - PMC - PubMed

Substances