. 2024 Mar 27;15(1):2542.
doi: 10.1038/s41467-024-46448-9.

Regulatory T cells expressing CD19-targeted chimeric antigen receptor restore homeostasis in Systemic Lupus Erythematosus

Affiliations

Regulatory T cells expressing CD19-targeted chimeric antigen receptor restore homeostasis in Systemic Lupus Erythematosus

M Doglio et al. Nat Commun. .

Abstract

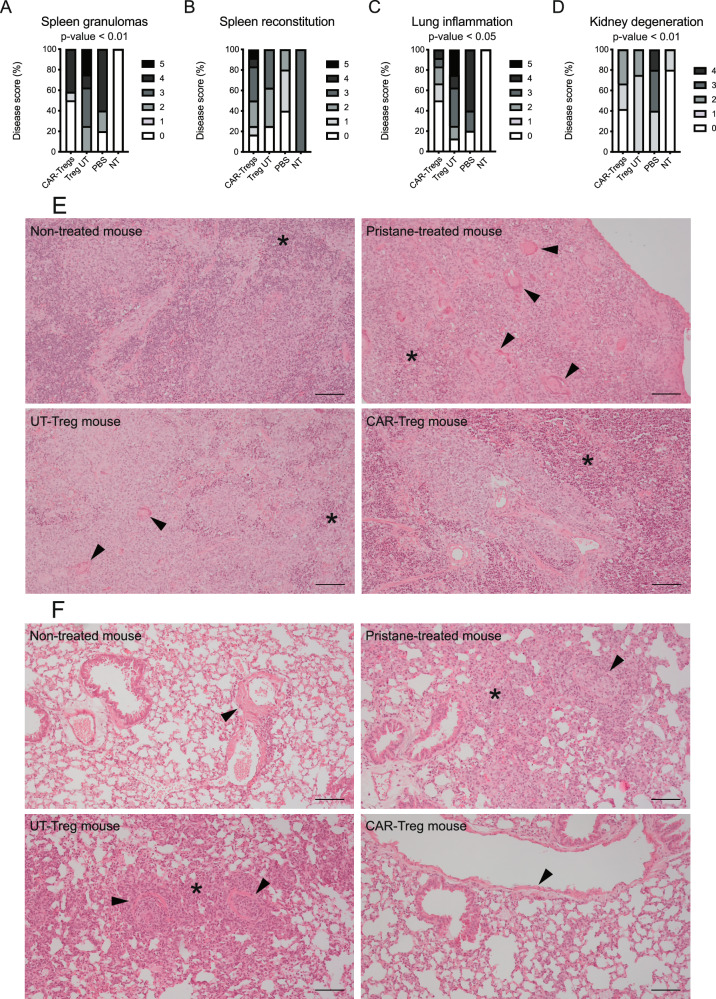
Systemic Lupus Erythematosus (SLE) is a progressive disease leading to immune-mediated tissue damage, associated with an alteration of lymphoid organs. Therapeutic strategies involving regulatory T (Treg) lymphocytes, which physiologically quench autoimmunity and support long-term immune tolerance, are considered, as conventional treatment often fails. We describe here a therapeutic strategy based on Tregs overexpressing FoxP3 and harboring anti-CD19 CAR (Fox19CAR-Tregs). Fox19CAR-Tregs efficiently suppress proliferation and activity of B cells in vitro, which are relevant for SLE pathogenesis. In an humanized mouse model of SLE, a single infusion of Fox19CAR-Tregs restricts autoantibody generation, delay lymphopenia (a key feature of SLE) and restore the human immune system composition in lymphoid organs, without detectable toxicity. Although a short survival, SLE target organs appear to be protected. In summary, Fox19CAR-Tregs can break the vicious cycle leading to autoimmunity and persistent tissue damage, representing an efficacious and safe strategy allowing restoration of homeostasis in SLE.


Conflict of interest statement

BC, CF are inventors on different patents on cancer immunotherapy and genetic engineering. BC has been member of Advisory Board and Consultant for Molmed, Intellia, TxCell, Novartis, GSK, Allogene, Kite/Gilead, Miltenyi, Kiadis, Evir, Janssen and received research support from Molmed s.p.a and Intellia Therapeutics. The other authors declare no competing interests.

Figures

Fig. 1
Fig. 1. Fox19CAR-Treg in vitro generation and validation.
A Fox19CAR lentiviral vector (LV) and FoxP3 LV schematic representations. The FoxP3 gene and an anti-CD19 second-generation CAR are inserted in an unidirectional LV and under the control of a Phosphoglycerate Kinase (PGK) promoter. The vector encoding for the FoxP3 gene alone is a bi-directional LV with the FoxP3 gene in sense (PGK promoter) and the enhanced Green Fluorescent Protein (eGFP) in antisense (minimal CMV or mCMV promoter). LTR long terminal repeat, SD splice donor, SA splice acceptor, GA gag-pol element, RRE REV responsive element, cPPT central polypurine tract, pA polyadenilation signal, CTE constitutive transport element, WPRE woodchuck hepatitis virus post-transcriptional regulatory element. B Transduction efficiency of CAR19.28z LV, Fox19CAR LV and FoxP3 LV measured as percentage of either CAR+ or GFP+ cells among CD4+CD25+CD127-FoxP3+ lymphocytes at day +14. Recombinant CD19 for UT-, 19CAR- and Fox19CAR-Tregs and GFP for FoxP3 LV respectively, were employed to assess the transduction percentage. N = 5 for UT- and 19CAR-Tregs. N = 10 for Fox19CAR-Tregs. N = 3 for FoxP3-Tregs. One-way ANOVA with Tukey correction for multiple comparison. ***p-value 0.0008, ****p-value < 0.0001. C Representative flow cytometry plot for co-localization of the CAR construct and FoxP3 in Fox19CAR-Tregs compared to untransduced (UT) cells. CAR expression was assessed using the human rCD19. D Expansion rate of UT-, 19CAR-, Fox19CAR- and FoxP3-Tregs, assessed at day +14 since the initial stimulation. N = 6 for UT-, Fox19CAR- and 19CAR-Tregs. N = 3 for FoxP3-Tregs. One-way ANOVA with Tukey correction for multiple comparison. E Polyclonal suppressive capacities of UT-, 19CAR- and Fox19CAR-Tregs. Results are expressed as Suppression Index, calculated as Suppression index = [1-(PBMCs’ proliferation with Tregs)/(PBMCs’ proliferation alone)] * 100. N = 3 for UT-, Fox19CAR- and 19CAR-Tregs. N = 3 for UT conventional T cells. Two-way ANOVA with Tukey correction for multiple comparison. F Antigen-specific suppressive capacities of UT-, 19CAR-, Fox19CAR- and FoxP3-Tregs. Results are expressed as Suppression index = [1-(B cell proliferation with Tregs)/(B cell proliferation alone)] * 100. N = 6 for UT- and Fox19CAR-Tregs. N = 3 for 19CAR- and FoxP3-Tregs. Two-way ANOVA with Tukey correction for multiple comparison. The exact p-values are reported in the graph. All the results are expressed as mean ± standard deviation.
Fig. 2
Fig. 2. In vitro safety profile of Fox19CAR engineered CD4+CD25- T cells.
A Schematic representation of CD4+CD25- T cell engineering with different LV vectors and stimulation protocols. B Schematic representation of Treg engineering with two different LV vectors. C Expansion rate of engineered and untransduced CD4+CD25- T cells in the presence of two different cytokine cocktails and transduced with two different LV vectors, assessed at day +14 since the initial stimulation. N = 8 for each group. One-way ANOVA with Tukey correction for multiple comparison. The exact p-values for each comparison are reported in the graphs. D Polyclonal suppressive capacities of either engineered or untransduced CD4+CD25- derived T cells. The result is expressed as Suppression index, calculated as Suppression Index = [1-(PBMCs’ proliferation with Tregs)/(PBMCs’ proliferation alone)] * 100. N = 3 for each group. Two-way ANOVA with Tukey correction for multiple comparison. The exact p-values for each comparison are reported in the graphs. E Heatmap representing the relative abundance of each meta-cluster among different in vitro-expanded CD4+CD25+ and, CD4+CD25- derived cellular products. Fifteen meta-clusters were identified using cytoChain for the unsupervised analysis of flow cytometry data. The darker the color, the higher the abundance of the cluster within the group. N = 5. F Heatmap reporting the intensity of the evaluated markers in each cluster. Engineered or untransduced Tregs and CD4+CD25- T lymphocyte phenotypes were analyzed by flow cytometry. Subsequently, samples were analyzed with cytoChain for an unsupervised scrutiny. For each cluster, the intensity of each marker is reported. Red and cyan boxes highlight the 4 most expressed meta-clusters as reported in Fig. 2E. N = 5. All the results are expressed as mean ± standard deviation.
Fig. 3
Fig. 3. Efficacy of Fox19CAR-Tregs in an in vivo humanized mouse model of SLE.
A Generation of the humanized mouse model of SLE. 1 day-old pups of NSG mice were irradiated and transplanted with 0.8-1 × 105 human cord-blood stem cells/mouse injected intra-liver. The engraftment was monitored assessing the presence and the composition of human leukocytes on peripheral blood weekly by flow cytometry. After the establishment of a human immune system, mice were injected i.p. with pristane to induce a chronic inflammation. After 3 weeks, UT-, Fox19CAR-Tregs or PBS were injected and their kinetic and the levels of human leukocytes in the peripheral blood were monitored weekly by flow cytometry. Mice were sacrificed 15 weeks after humanization. B, C Longitudinal assessment of human B and T lymphocytes in peripheral blood. Human B and T cells were identified as huCD45+CD19+ and huCD45+CD3+ lymphocytes, respectively. Absolute cell counts were assessed by flow cytometry. Pristane injection is indicated with an arrow. N = 53 mice. One-way ANOVA with Tukey correction for multiple comparison. *p-value 0.021, ****p-value < 0.0001. D Longitudinal assessment of circulating Fox19CAR-Tregs in mouse peripheral blood after their injection. CAR+ cells were identified with FITC-conjugated recombinant CD19 (rCD19). CAR-Treg absolute counts were assessed by flow cytometry. N = 16 mice. EG Absolute numbers of circulating human cells in humanized mice in the different groups of treatment after the injection of Fox19CAR-Tregs, UT-Tregs or PBS. Human cells were identified as total huCD45+ leukocytes, huCD45+CD3+ T and huCD45+CD19+ B lymphocytes, respectively. Absolute cell counts were assessed by flow cytometry. N = 31 (16 CAR-Tregs, 11 UT-Tregs, 4 PBS). Two-way ANOVA test with Tukey correction for multiple comparisons. The exact p-values are reported in the graphs. All the results are expressed as mean ± standard deviation.
Fig. 4
Fig. 4. Fox19CAR-Tregs immunomodulatory properties.
Mean IL-10 (A), IFN-g (B) and IL-6 (C) levels in peripheral blood before and 3 days after the injection of Fox19CAR-Tregs, UT-Tregs or PBS. As control, humanized mice not treated with pristane (NT) are included. Cytokine levels were assessed employing a bead-based immunoassay (Biolegend Legendplex 13-plex kit) according to the manufacturer’s instructions. Each dot represents a single mouse. N = 34 (16 CAR-Tregs, 11 UT-Tregs, 7 PBS, 3 NT). Two-tailed Wilcoxon test for non-parametric paired data. *p-value < 0.025. D Frequency of human anti-dsDNA auto-antibodies in mouse serum in the different groups of treatment. N = 31 (15 CAR-Tregs, 11 UT-Tregs, 5 PBS). Two-sided Chi-squared test. *p-value 0.048.
Fig. 5
Fig. 5. A single injection of Fox19CAR-Tregs restores the human B cell compartment in lymphoid organs.
A Percentage of regulatory T cells in the different organs at sacrifice in the different groups of treatment. Tregs were defined as CD3+CD4+CD25+CD127-FoxP3+ lymphocytes and their frequency was assessed by flow cytometry. The results are expressed as mean ± standard deviation. As control, humanized mice not treated with pristane (NT) are included. N = 32 (14 CAR-Tregs, 8 UT-Tregs, 4 PBS, 6 NT). One-way ANOVA test with Tukey correction for multiple comparisons. B, C Percentage of total human CD45+ cells and human T and B cell sub-populations in the spleen and in the bone marrow in the different groups of treatment at sacrifice. T cells were defined as CD3+ cells. B cells were defined as: pre-B cells CD19+CD20-CD27- cells, naïve B cells CD19+CD20+CD27- cells, memory B cells CD19+CD20+CD27+ cells, plasmablasts CD19+CD20-CD27+ cells, plasma cells CD138+ cells. The results are expressed as mean ± standard deviation. As control, humanized mice not treated with pristane (NT) are included. N = 38 (16 CAR-Tregs, 11 UT-Tregs, 5 PBS, 6 NT). One-way ANOVA test with Tukey correction for multiple comparisons. Th exact p-values for each comparison are reported in the graphs.
Fig. 6
Fig. 6. Fox19CAR-Tregs abate inflammatory lesions in different organs.
A Frequency and severity of the inflammatory lesions in the spleen at the sacrifice in the different groups of treatment. As control, humanized mice not treated with pristane (NT) are included. N = 37 (16 CAR-Tregs, 11 UT-Tregs, 7 PBS, 3 NT). Two-tailed Chi-squared test. B Frequency and grade of human reconstitution in the spleen at the sacrifice, evaluated as representation of red and white pulp. N = 37 (16 CAR-Tregs, 11 UT-Tregs, 4 PBS, 6 NT). Two-tailed Chi-squared test. C Frequency and severity of the pulmonary inflammatory lesions at sacrifice in the different groups of treatment. As control, humanized mice not treated with pristane (NT) are included. N = 37 (16 CAR-Tregs, 11 UT-Tregs, 4 PBS, 6 NT). Two-tailed Chi-squared test. D Frequency and severity of the tubular degeneration in kidneys at the sacrifice. N = 37 (16 CAR-Tregs, 11 UT-Tregs, 7 PBS, 3 NT). Two-tailed Chi-squared test. E Representative pictures of the spleen in 4 different mice, one per group of treatment. Asterisk indicates the red pulp. Arrowhead indicates areas of granulomatous inflammation. Reference bar 100 μm. F Representative pictures of the lungs in 4 different mice, one per group of treatment. Asterisk indicates areas of granulomatous inflammation. Arrowhead indicates blood vessels. Reference bar 100 μm.
Fig. 7
Fig. 7. Efficacy and safety of multiple Fox19CAR-Treg injections.
A Schematic representation of the early treatment in a SGM-3 based humanized mouse model of SLE. B Longitudinal assessment of circulating Fox19CAR-Tregs and 19CAR-Tconvs after their injection 3 weeks after pristane (early treatment). N = 11 (5 CAR-Tregs, 6 CAR-Tconvs). CE Absolute numbers of circulating human cells in the early treatment groups (3 weeks after pristane) after the injection of Fox19CAR-Tregs, 19CAR-Tconvs or PBS. Human cells were identified as total huCD45+ leukocytes, huCD45+CD3+ T and huCD45+CD19+ B lymphocytes, respectively. Absolute cell counts were assessed by flow cytometry. In BE, black arrow indicates engineered cell injection. Green arrow denotes CAR-Treg second infusion. Results are expressed as mean ± standard deviation. A two-way ANOVA test with Tukey correction for multiple comparisons was employed. N = 17 (5 CAR-Tregs, 6 CAR-Tconvs, 6 PBS). *p-value 0.029. F Cytokine levels in peripheral blood of treated mice, injected 3 weeks after pristane. The amount of each cytokine was normalized across the various groups, scaled to range from 0 (minimum) to 1 (maximum). N = 17 (5 CAR-Tregs, 6 CAR-Tconvs, 4 PBS). G IL-10 levels in peripheral blood before and 7 days after treatment, 3 weeks after pristane. N = 14 (5 CAR-Tregs, 6 CAR-Tconvs, 4 PBS). Two-tailed Wilcoxon test for non-parametric paired data. *p-value 0.026, ****p-value < 0.0001.
Fig. 8
Fig. 8. Efficacy and safety of Fox19CAR-Tregs in a late disease stage.
A Schematic representation of the late treatment in a SGM-3-based humanized mouse model of SLE. B Longitudinal assessment of circulating Fox19CAR-Tregs and 19CAR-Tconvs after their injection 8 weeks after pristane (late treatment). N = 10 (5 CAR-Tregs, 5 CAR-Tconvs). C Circulating human B lymphocytes (8 weeks after pristane) after the injection of Fox19CAR-Tregs, 19CAR-Tconvs or PBS. Human B lymphocytes were identified as huCD45+CD19+  cells. Absolute cell counts were assessed by flow cytometry. N = 16 (5 CAR-Tregs, 5 CAR-Tconvs, 6 PBS). In B, C, black arrow indicates engineered cell injection. Results are expressed as mean ± standard deviation. Two-way ANOVA test with Tukey correction for multiple comparisons. D Cytokine levels in peripheral blood of treated mice. The amount of each cytokine was normalized, scaled to range from 0 (minimum) to 1 (maximum), and a color gradient was generated. For each group, the relative abundance of each cytokine is reported. N = 16 (5 late CAR-Tregs, 3 re-infused CAR-Tregs, 3 late CAR-Tconvs, 5 PBS). E IL-10 levels in peripheral blood before and 7 days after treatment 8 weeks after pristane. Results are expressed as mean ± standard deviation. N = 16 (5 late CAR-Tregs, 3 re-infused CAR-Tregs, 3 late CAR-Tconvs, 5 PBS). Two-way ANOVA with Tukey correction for multiple comparisons. *p-value 0.030, ****p-value < 0.0001.
Fig. 9
Fig. 9. Fox19CAR-Treg efficacy and safety in reshaping the B cell compartment.
A Percentage of CAR+ cells in the bone marrow and the spleen at sacrifice. N = 21 (5 early CAR-Tregs, 5 late CAR-Treg, 6 early CAR-Tconvs, 5 late CAR-Tconvs). B, C Percentage of total human CD45+ cells and total T and CD4 + T cells in the bone marrow and the spleen at sacrifice. *p-value 0.043. D, E Percentage of total B cell sub-populations in the bone marrow and the spleen at sacrifice. In BE, results are expressed as mean ± standard deviation. N = 27 (5 early CAR-Tregs, 5 late CAR-Tregs, 6 early CAR-Tconvs, 5 late CAR-Tconvs, 6 PBS). One-way ANOVA test with Tukey correction for multiple comparisons. The exact p-values for each comparison are reported in the graphs.
Fig. 10
Fig. 10. 19CAR-Tconvs worse the inflammatory lesions SGM-3 humanized mice.
A Frequency and severity of the inflammatory lesions at the sacrifice in the different groups of early-administered treatment (3 weeks after pristane). N = 16 (5 early CAR-Tregs, 5 early CAR-Tconvs, 6 PBS). Two-tailed Chi-squared test. *p-value 0.041. B Livers of 3 different mice. Asterisk indicates an area of granulomatous inflammation. Reference bar 200 μm. C Ear pinnae of an early-treated CAR-Tconv mouse. Asterisk indicates an area of cutaneous Graft-versus-Host Disease. Reference bar 100 μm.

References

    1. Tsokos GC, Lo MS, Reis PC, Sullivan KE. New insights into the immunopathogenesis of systemic lupus erythematosus. Nat. Rev. Rheumatol. 2016;12:716–730. doi: 10.1038/nrrheum.2016.186. - DOI - PubMed
    1. Radic M, Herrmann M, van der Vlag J, Rekvig OP. Regulatory and pathogenetic mechanisms of autoantibodies in SLE. Autoimmunity. 2011;44:349–356. doi: 10.3109/08916934.2010.536794. - DOI - PubMed
    1. Kojima M, et al. Reactive follicular hyperplasia in the lymph node lesions from systemic lupus erythematosus patients: a clinicopathological and immunohistological study of 21 cases. Pathol. Int. 2000;50:304–312. doi: 10.1046/j.1440-1827.2000.01052.x. - DOI - PubMed
    1. Corsiero E, Delvecchio FR, Bombardieri M, Pitzalis C. B cells in the formation of tertiary lymphoid organs in autoimmunity, transplantation and tumorigenesis. Curr. Opin. Immunol. 2019;57:46–52. doi: 10.1016/j.coi.2019.01.004. - DOI - PubMed
    1. Weening, J. J. et al. The classification of glomerulonephritis in systemic lupus erythematosus revisited. Kidney Int. 65, 521–530 (2004). - PubMed

Substances