. 2024 Mar 27;14(1):7249.
doi: 10.1038/s41598-024-54231-5.

Host metabolomic responses in recurrent P. vivax malaria

Affiliations

Host metabolomic responses in recurrent P. vivax malaria

Michael N Yakubu et al. Sci Rep. .

Abstract

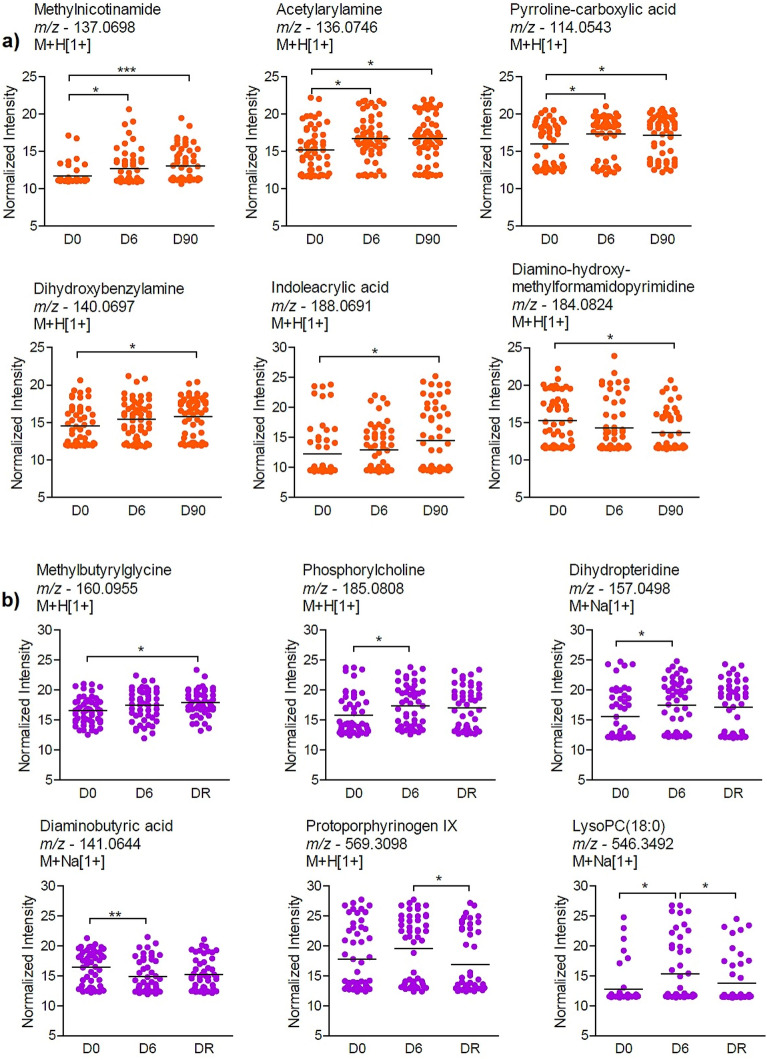
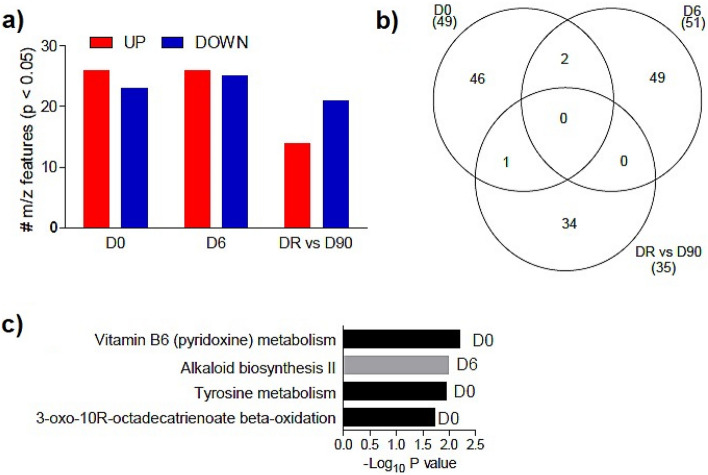
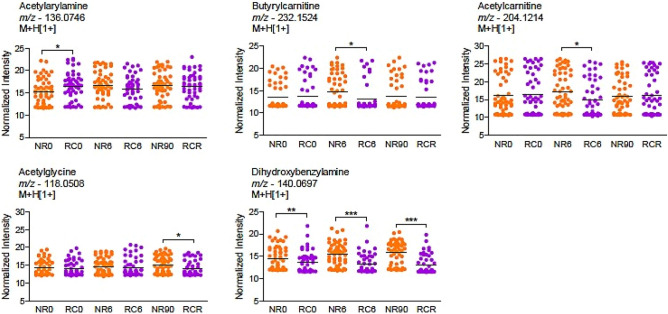
Malaria is the leading parasitic disease worldwide, with P. vivax being a major challenge for its control. Several studies have indicated metabolomics as a promising tool for combating the disease. The study evaluated plasma metabolomic profiles of patients with recurrent and non-recurrent P. vivax malaria in the Brazilian Amazon. Metabolites extracted from the plasma of P. vivax-infected patients were subjected to LC-MS analysis. Untargeted metabolomics was applied to investigate the metabolic profile of the plasma in the two groups. Overall, 51 recurrent and 59 non-recurrent patients were included in the study. Longitudinal metabolomic analysis revealed 52 and 37 significant metabolite features from the recurrent and non-recurrent participants, respectively. Recurrence was associated with disturbances in eicosanoid metabolism. Comparison between groups suggest alterations in vitamin B6 (pyridoxine) metabolism, tyrosine metabolism, 3-oxo-10-octadecatrienoate β-oxidation, and alkaloid biosynthesis II. Integrative network analysis revealed enrichment of other metabolic pathways for the recurrent phenotype, including the butanoate metabolism, aspartate and asparagine metabolism, and N-glycan biosynthesis. The metabolites and metabolic pathways predicted in our study suggest potential biomarkers of recurrence and provide insights into targets for antimalarial development against P. vivax.


Conflict of interest statement

The authors declare no competing interests.

Figures

Figure 1
Figure 1
Differential abundance of metabolites features within the two groups over time. (a) Abundance of metabolites features over time in non-recurrent patients. (b) Abundance of metabolites features over time in the recurrent patients. The colored dots in both A and B graphs refer to the significant m/z (p < 0.05) using ANOVA. (c) Mummichog pathway analysis of significant metabolite features in the non-recurrent and recurrent groups, including multiple adducts.
Figure 2
Figure 2
Examples of annotated metabolites over time in (a) the non-recurrent patients and (b) the recurrent patients. *p < 0.05, **p < 0.01 using ANOVA and Tukey multiple comparison test. Tentative annotations were obtained with mummichog software, including multiple adducts.
Figure 3
Figure 3
The frequency of up- and down-regulated significant metabolites over time and their metabolic pathways. (a) The number of significant m/z that are positively regulated and negatively regulated between groups at different times. (b) Venn diagram illustrating overlapping and non-overlapping differentially abundant metabolite features at different times. (c) Mummichog pathway analysis of pathways affected by the significant metabolite, including multiple adducts.
Figure 4
Figure 4
Comparisons of annotated metabolites between the two groups at the D0, D6 or DR vs D90. *p < 0.05, **p < 0.01, ***p < 0.001 using T test or Mann Whitney test (NR0: non-recurrent patients, Day0, RC0: recurrent patients, Day 0, NR6: non-recurrent patients, Day6, RC6: recurrent patients, Day6, NR90: non-recurrent patients, Day90, RCR: recurrent patients, Day of recurrence). Tentative annotations were obtained with mummichog software, including multiple adducts.
Figure 5
Figure 5
Network analysis of metabolomics and clinical laboratory data. (a) Integrative network composed of parasitemia, hematological, biochemical and metabolomics measurements at D0. Negative associations are depicted by blue lines and positive associations are depicted by red lines. The size of the node corresponds to the number of associations (b) Enrichment analysis of metabolic clusters comparing recurrence and non-recurrence at D0. Blue bars represent clusters associated with non-recurrence and red bars represent clusters associated with recurrence. Mummichog analysis was used to predict metabolic pathways enriched in clusters and only the top significant pathway is shown.

References

    1. WHO. World Malária Report, 2022. (2022).
    1. Popovici J, et al. Recrudescence, reinfection, or relapse? A more rigorous framework to assess chloroquine efficacy for Plasmodium vivax malaria. J. Infect. Dis. 2019;219:315–322. doi: 10.1093/infdis/jiy484. - DOI - PMC - PubMed
    1. SIVEP-Malaria e SINAN. O Sistema de Informação da Vigilância Epidemiológica da Malaria (SIVEP) e Sistema de Informação de Agravos de Notificação (SINAN), Brazil, 2022. (2022).
    1. Bourgard C, Albrecht L, Kayano ACAV, Sunnerhagen P, Costa FTM. Plasmodium vivax biology: Insights provided by genomics, transcriptomics and proteomics. Front. Cell. Infect. Microbiol. 2018;8:34. doi: 10.3389/fcimb.2018.00034. - DOI - PMC - PubMed
    1. Gardinassi LG, et al. Metabolome-wide association study of peripheral parasitemia in Plasmodium vivax malaria. Int. J. Med. Microbiol. 2017;307:533–541. doi: 10.1016/j.ijmm.2017.09.002. - DOI - PMC - PubMed