. 2024 Apr;628(8008):604-611.
doi: 10.1038/s41586-024-07237-y. Epub 2024 Mar 27.

CGRP sensory neurons promote tissue healing via neutrophils and macrophages

Affiliations

CGRP sensory neurons promote tissue healing via neutrophils and macrophages

Yen-Zhen Lu et al. Nature. 2024 Apr.

Abstract

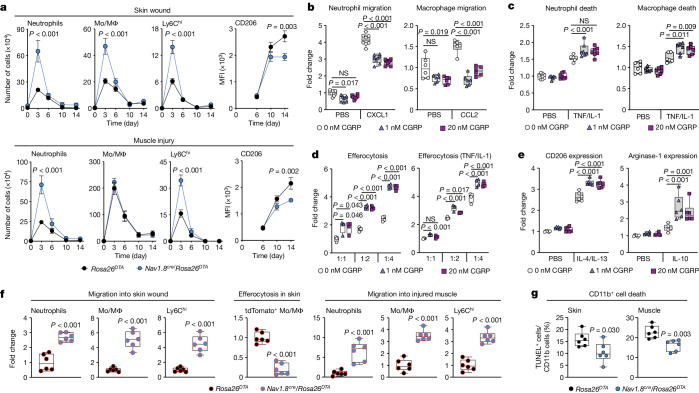
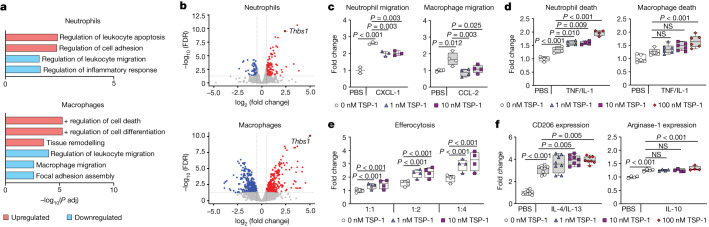
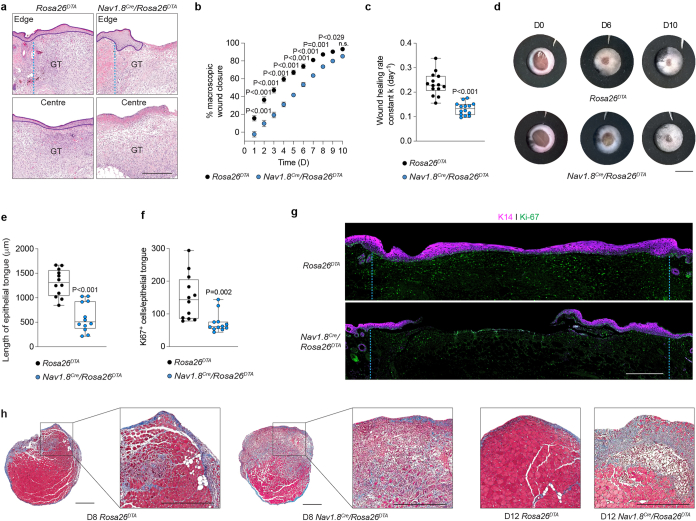
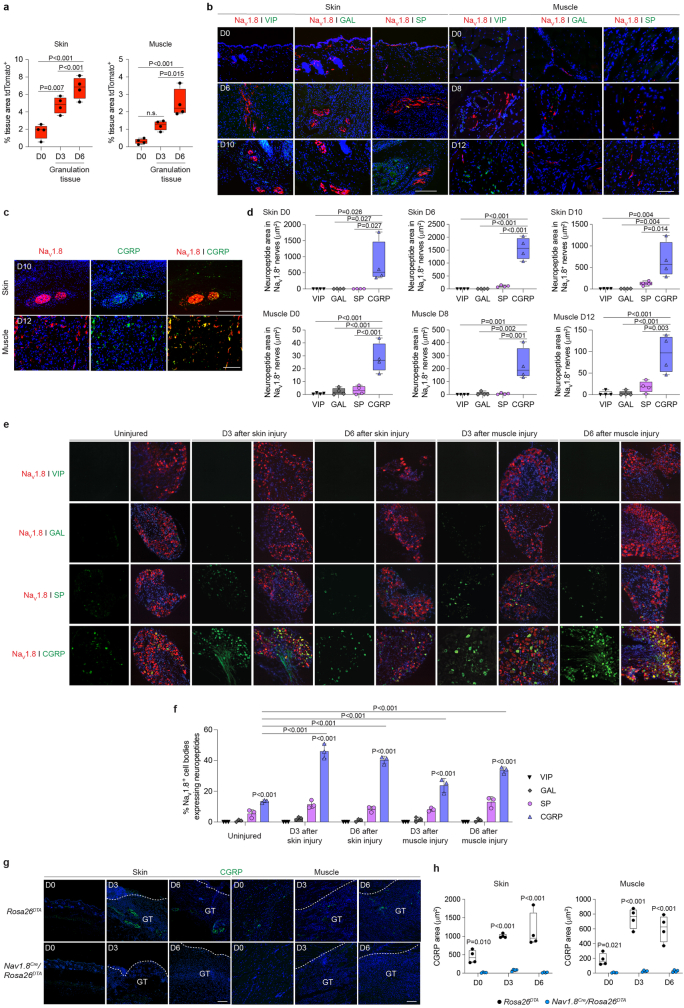
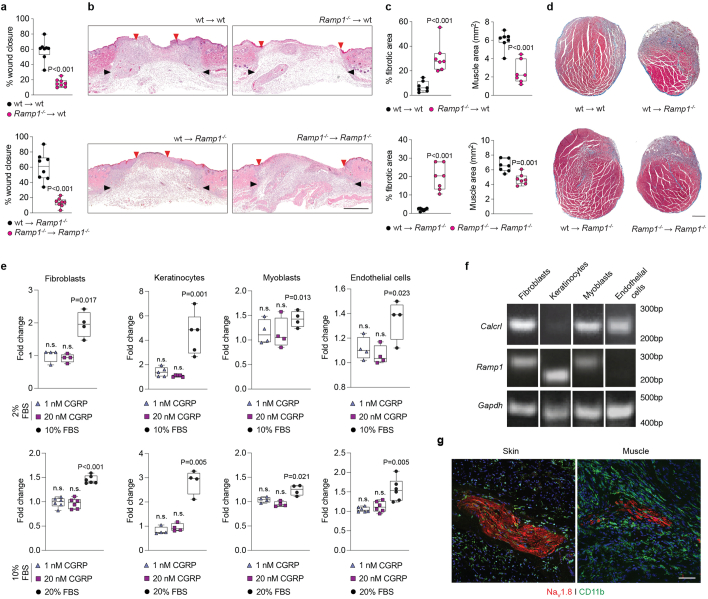
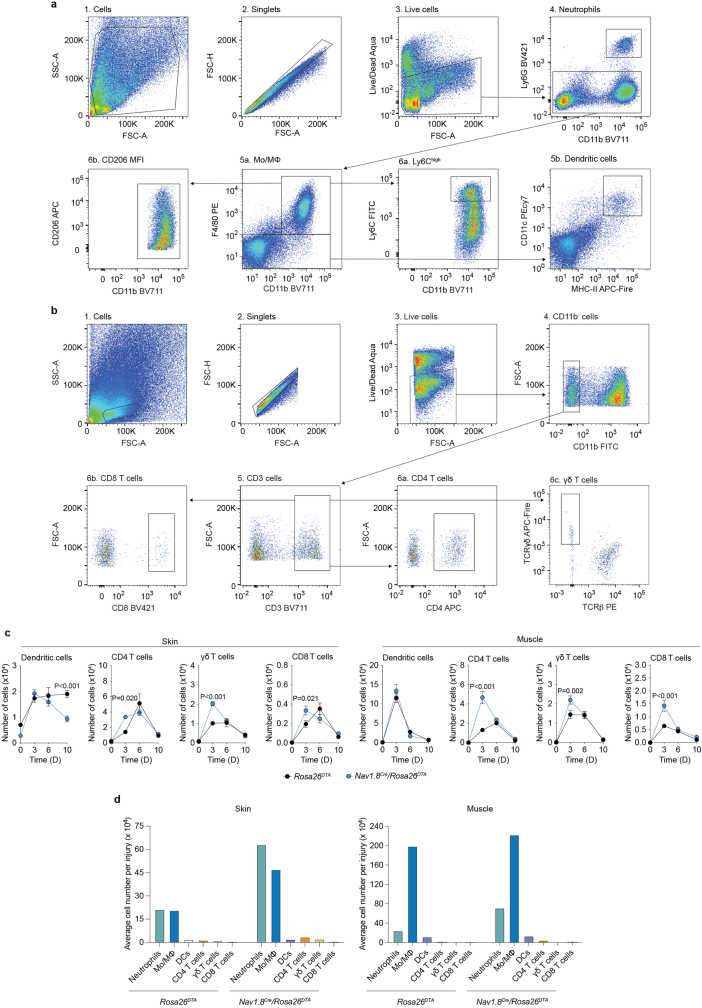
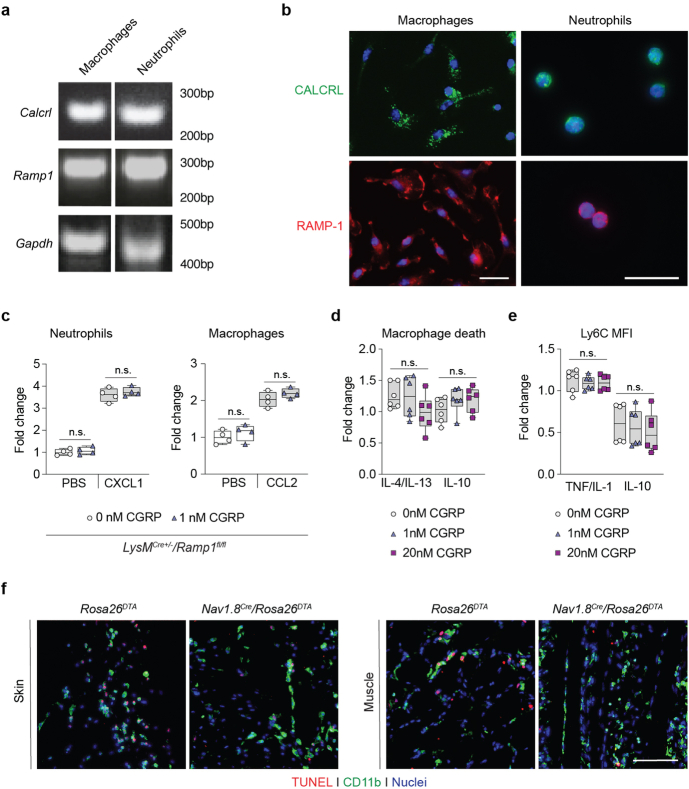
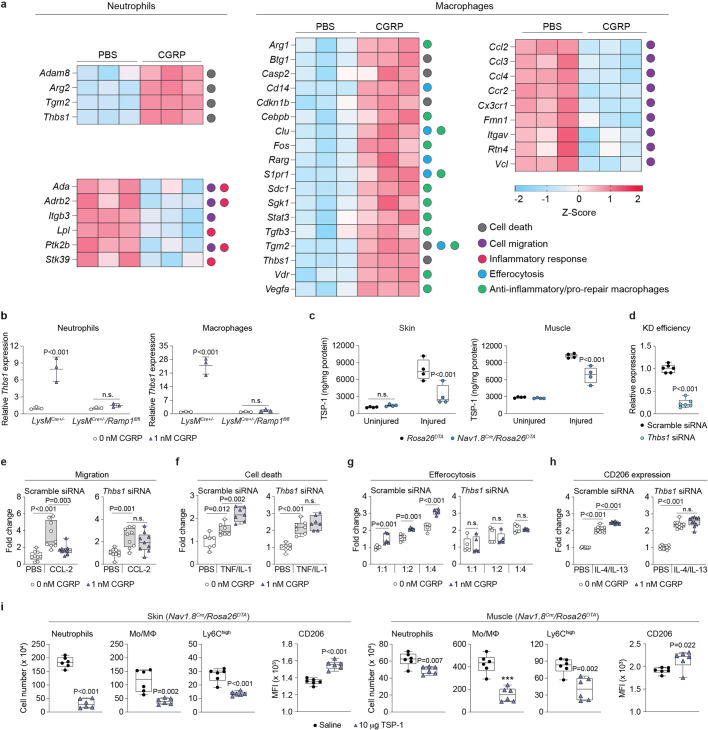
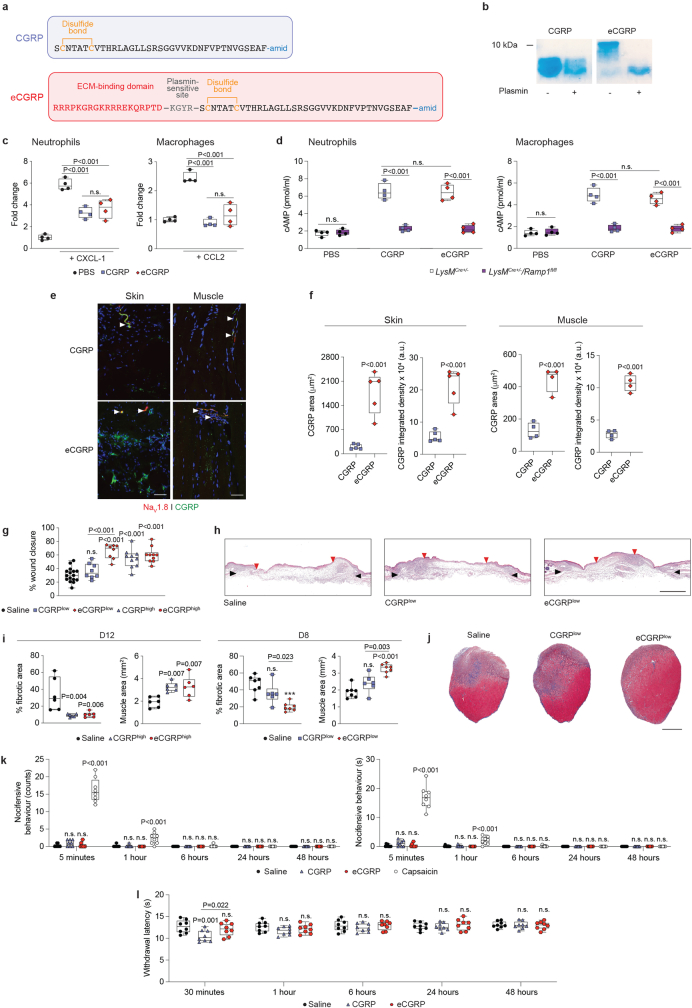
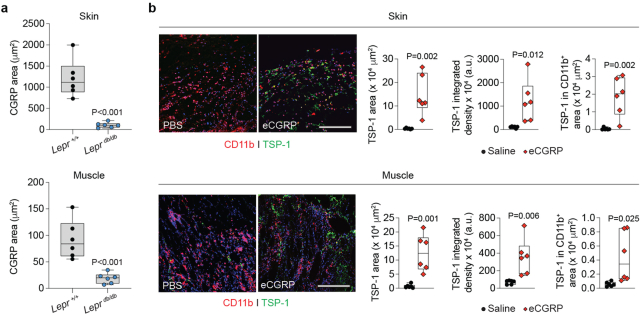
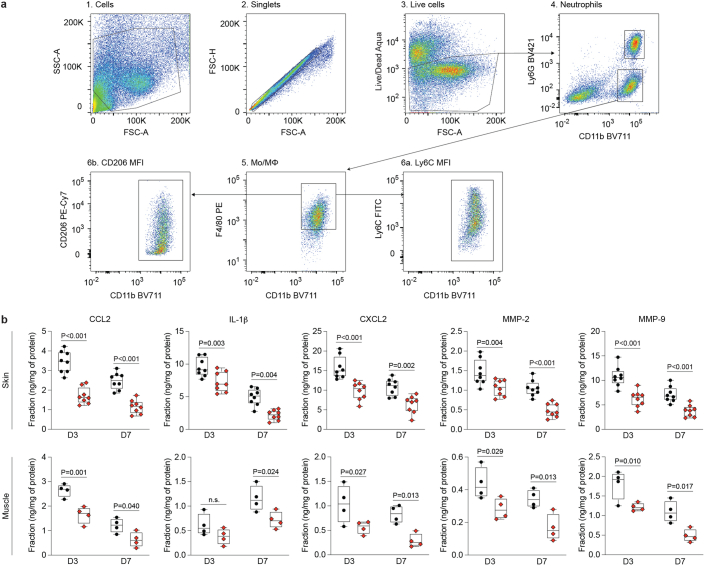
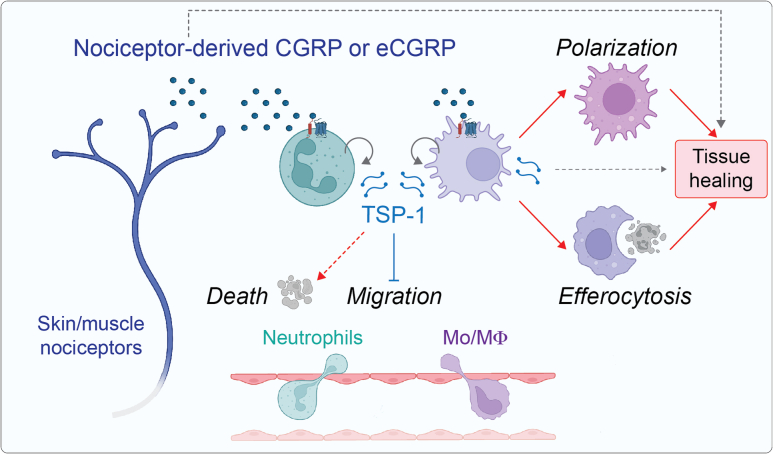
The immune system has a critical role in orchestrating tissue healing. As a result, regenerative strategies that control immune components have proved effective1,2. This is particularly relevant when immune dysregulation that results from conditions such as diabetes or advanced age impairs tissue healing following injury2,3. Nociceptive sensory neurons have a crucial role as immunoregulators and exert both protective and harmful effects depending on the context4-12. However, how neuro-immune interactions affect tissue repair and regeneration following acute injury is unclear. Here we show that ablation of the NaV1.8 nociceptor impairs skin wound repair and muscle regeneration after acute tissue injury. Nociceptor endings grow into injured skin and muscle tissues and signal to immune cells through the neuropeptide calcitonin gene-related peptide (CGRP) during the healing process. CGRP acts via receptor activity-modifying protein 1 (RAMP1) on neutrophils, monocytes and macrophages to inhibit recruitment, accelerate death, enhance efferocytosis and polarize macrophages towards a pro-repair phenotype. The effects of CGRP on neutrophils and macrophages are mediated via thrombospondin-1 release and its subsequent autocrine and/or paracrine effects. In mice without nociceptors and diabetic mice with peripheral neuropathies, delivery of an engineered version of CGRP accelerated wound healing and promoted muscle regeneration. Harnessing neuro-immune interactions has potential to treat non-healing tissues in which dysregulated neuro-immune interactions impair tissue healing.


Conflict of interest statement

Y.-Z.L. and M.M.M. are named as inventors on a patent application by Monash University relating to the molecular design described here. The other authors declare no competing interests.

Figures

Fig. 1
Fig. 1. NaV1.8+ nociceptors that express CGRP mediate tissue healing via myeloid cells.
a,b, Full-thickness skin wounds were created in denervated (Nav1.8cre/Rosa26DTA) mice and littermate controls (Rosa26DTA). a, Wound closure evaluated by histomorphometric analysis on day 6 and day 10 post-injury (Rosa26DTA day 6, n = 14; Nav1.8cre/Rosa26DTA day 6, n = 12; day 10, n = 8). b, Representative histology at day 6 post-injury. Black arrows indicate wound edges and red arrows indicate tips of epithelium tongue. Scale bar, 1 mm. c,d, Volumetric muscle loss was evaluated on quadriceps of Nav1.8cre/Rosa26DTA and Rosa26DTA littermate controls. c, Extent of muscle regeneration was evaluated by histomorphometric analysis on day 8 and day 12 post-injury (day 8, n = 7; day 12, n = 10). d, Representative histology at day 12 post-injury (fibrotic tissue is stained blue; muscle tissue is stained red). Scale bar, 500 μm. e, Distribution of NaV1.8+ sensory neurons (red) in skin and muscle of Nav1.8cre/Rosa26tdT mice before and after injury. White lines indicate keratinocyte layers and nuclei are in blue. GT, granulation tissue area. Scale bars, 500 μm. The experiment was repeated independently four times. f, Expression of CGRP in skin and muscle before and after injury detected by immunohistochemistry. Scale bars: 500 μm (skin), 100 μm (muscle). The experiment was repeated independently four times. gj, Ramp1 deletion in myeloid cells using LysMcre+/−/Ramp1fl/fl mice. LysMcre+/− mice were used as controls. g, Wound closure was quantified on day 6 post-injury (n = 10). h, Representative skin histology. i, Muscle regeneration was quantified on day 12 post-injury (n = 10). j, Representative muscle histology. Boxes show median (centre line) and interquartile range (edges), whiskers show the range of values and dots represent individual data points. a,c, Two-way ANOVA with Bonferroni post hoc test for pairwise comparisons. g,i, Two-tailed Student’s t-test. P values are indicated. Source Data
Fig. 2
Fig. 2. CGRP regulates myeloid cell function during tissue healing.
a, Analysis of neutrophil and monocyte/macrophage (Mo/Mϕ) populations by flow cytometry during tissue healing. Geometric mean of fluorescence intensity (MFI) of CD206 in macrophages was used to assess M2-like polarization. Data are plotted in kinetic line plots showing mean ± s.e.m. Skin: day 0, day 6 and day 10, n = 20; day 3, n = 22; and day 14, n = 12. Muscle: day 0, n = 16; day 3, n = 20; day 6, day 10, n = 18; and day 14, n = 10. be, Neutrophils and macrophages were treated with saline (PBS, 0 nM CGRP) or CGRP (1 or 20 nM). Results are expressed as fold change over the PBS (0 nM CGRP) group. b, Transwell migration towards CXCL1 or CCL2 with or without CGRP (n = 6–8). c, Cell death in response to CGRP and TNF plus IL-1 (neutrophils, n = 7; macrophages, n = 6). d, Macrophage efferocytosis of neutrophils after CGRP treatment with or without TNF/IL-1 (n = 4). e, Macrophage polarization determined via CD206 and arginase-1 protein expression following CGRP and IL-4/IL-13 or IL-10 treatment (n = 6). f, tdTomato+ bone marrow cells were administered systemically on day 2 post-injury. Fold change of tdTomato+ neutrophils and monocytes/macrophages in injured tissues on day 3 post-injury was assessed by flow cytometry. For efferocytosis, dead or dying tdTomato+ neutrophils were injected in skin wound borders on day 3 post-injury. Fold change of tdTomato+ endogenous monocytes/macrophages was assessed by flow cytometry 30 min post-injection (n = 6). g, Death of CD11b+ cells 3 days post-injury, assessed by TUNEL assay on injured tissue sections (n = 6). Boxes show median (centre line) and interquartile range (edges), whiskers show the range of values. Dots represent independent experiments. ae, Two-way ANOVA with Bonferroni post hoc test for pairwise comparisons. f,g, Two-tailed Student’s t-test. P values are indicated. NS, not significant. Source Data
Fig. 3
Fig. 3. CGRP upregulates TSP-1 in neutrophils and macrophages to mediate its activity.
a,b, RNA-seq analysis of CGRP-treated neutrophils and macrophages (1 nM or saline for 4 h). Differential gene expression was performed with limma-voom (false discovery rate (FDR) < 0.05). Fold change values returned by limma were used for pathway analysis with FDR < 0.05 to correct for multiple comparisons. a, GO enrichment analysis of significantly upregulated (red) and downregulated (blue) genes in CGRP-treated and saline-treated groups. b, Volcano plots showing DEGs with fold change > |1.5| between CGRP-treated and saline-treated groups. Significantly upregulated (red) and downregulated (blue) genes in CGRP-treated neutrophils and macrophages are shown (n = 3). cf, Neutrophils and macrophages were treated with saline (PBS, 0 nM TSP-1) or TSP-1 (1, 10 or 100 nM). Results are expressed as fold change over the PBS (0 nM TSP-1) control group. Boxes show median (centre line) and interquartile range (edges), whiskers show the range of values. Dots represent independent experiments. c, Transwell migration towards a chemoattractant (CXCL1 or CCL2) after TSP-1 treatment (n = 3 for neutrophils, n = 4 for macrophages). d, Cell death in response to TSP-1 with or without TNF plus IL-1 (n = 4). e, Macrophage efferocytosis of neutrophils after TSP-1 treatment (n = 4). f, Macrophage M2-like polarization determined via CD206 and arginase-1 expression in response to TSP-1 and IL-4/IL-13 or IL-10 treatments (CD206, n = 8; arginase-1, n = 4). cf, One-way ANOVA with Tukey post hoc test for pairwise comparisons. P values are indicated. Source Data
Fig. 4
Fig. 4. Delivery of eCGRP promotes tissue healing in diabetic mice.
a, CGRP expression in skin and muscle of Nav1.8cre/Rosa26DTA and diabetic (Leprdb/db) mice detected by immunostaining. CGRP, green; nuclei, blue. White lines indicate the keratinocyte layer. Scale bars, 300 μm. The experiment was repeated independently 6 times. b,c, Saline, CGRP (500 ng) or equimolar eCGRP was delivered on Leprdb/db skin wounds at day 1 and day 3 post-injury. b, Wound closure was evaluated by histomorphometric analysis on day 10 post-injury (saline and eCGRP, n = 14; CGRP, n = 12). Boxes show median (centre line) and interquartile range (edges), whiskers show the range of values. c, Representative skin histology. Black arrows indicate wound edges and red arrows point to tips of epithelium tongue. Scale bar, 1 mm. d,e, Saline, CGRP (1 μg) or equimolar eCGRP was delivered in Leprdb/db quadricep volumetric muscle loss defect via a fibrin hydrogel. d, Muscle regeneration (represented by the percentage of fibrotic tissue and muscle area) was evaluated by histomorphometric analysis on day 8 post-injury. Boxes show median (centre line) and interquartile range (edges), whiskers show the range of values (n = 10). e, Representative histology (fibrotic tissue is stained blue; muscle tissue is stained red). Scale bar, 500 μm. f, Numbers of neutrophils (CD11b+Ly6G+F4/80) and monocytes/macrophages (CD11b+F4/80+Ly6G), and expression of Ly6C and CD206 in macrophages (represented by MFI) in Leprdb/db skin wounds and muscle injuries treated with saline or eCGRP were quantified by flow cytometry. Skin: n = 6. Muscle: day 3, n = 8 for saline, n = 7 for eCGRP; day 7, n = 9. Data are plotted as kinetic line plots showing mean ± s.e.m. b,d, One-way ANOVA with Tukey post hoc test for pairwise comparisons. f, Two-way ANOVA with Bonferroni post hoc test for pairwise comparisons. P values are indicated. Source Data
Extended Data Fig. 1
Extended Data Fig. 1. The lack of NaV1.8+ sensory neurons impairs tissue healing.
a–g, Full-thickness skin wounds were created in Nav1.8cre/Rosa26DTA and littermate control Rosa26DTA mice. Wound closure was evaluated by histomorphometric analysis of tissue sections at D6 post-injury. Representative histology at the edge and centre of the wounds (a). Blue lines indicate wound edges. Purple lines indicate the epithelial tongue. GT indicates granulation tissue. Scale bar = 500 μm. Wound closure was evaluated by macroscopic evaluation (b) to calculate the wound healing rate constant κ (c) (n = 14). Representative macroscopic images of the wounds (d). Scale bar = 5 mm. Measurement of the length of the migrating epithelial tongue (e) (n = 12). Quantification of the number of proliferating keratinocytes (Ki-67 positive) in tissue sections (f) (n = 12). Representative image of immunostaining for keratin 14 (K14, purple) detecting the epithelial tongue and Ki-67 positive cells (green) (g). Blue lines indicate wound edges. Scale bar = 500 μm. In b, data are plotted in kinetic line plots showing mean ± SEM. In c,e,f, data are plotted in box plots showing median (centre line) and IQR (bounds). Whiskers show min. to max. range. Dots represent individual wounds. Two-way ANOVA with Bonferroni post hoc test for pair-wise comparisons in b. Two-tailed Student’s t-test in c,e,f. P values are indicated; n.s., non-significant. h, Volumetric muscle loss was performed on the quadriceps of Nav1.8Cre/Rosa26DTA and Rosa26DTA littermate control mice. Representative histology is shown (fibrotic tissue is stained blue; muscle tissue is stained red). Scale bars = 500 μm. Repeated independently 7 times for D8 and 10 times for D12. Source Data
Extended Data Fig. 2
Extended Data Fig. 2. NaV1.8+ sensory neurons mainly express CGRP during skin and muscle healing.
a, Quantification of NaV1.8+ sensory neurons in skin and muscle before and after injury. Results are expressed as the percentage of tissue area positive for tdTomato in healthy tissue at D0 (uninjured) and in the granulation tissue at D3 and D6 post-injury (n = 4). b–d, Expression of neuropeptides in skin and muscle were detected by immunohistochemistry (neuropeptides, green; NaV1.8, red; nuclei, blue). Scale bars = 500 μm in skin and 100 μm in muscle. Quantification of neuropeptide signal in NaV1.8+ sensory neurons (d) (n = 4). e, Neuropeptide expression in DRGs before and on D3 and D6 after skin and muscle injury (neuropeptides, green; NaV1.8, red; nuclei, blue). Scale bar = 100 μm. Percentage of NaV1.8+ cell bodies expressing a neuropeptide type (f) (n = 3). g, CGRP localisation in skin and muscle before and after tissue injury in Nav1.8Cre/Rosa26DTA and Rosa26DTA littermate control mice. White lines indicate the separation between the granulation tissue (GT) and the top of the wound in skin and the separation between the granulation tissue and the muscle tissue in muscle. Scale bars = 100 μm. Quantification of CGRP signal (h) (n = 4). In a,d,h, data are plotted in box plots showing median (centre line) and IQR (bounds). Whiskers show min. to max. range. Dots represent independent injuries. In f, data are plotted as bar graph showing mean ± SD. Dots represent individual DRGs. One-way ANOVA with Tukey post hoc test for pair-wise comparisons in a,d. Two-way ANOVA with Bonferroni post hoc test for pair-wise comparisons in f,h. P values are indicated. Source Data
Extended Data Fig. 3
Extended Data Fig. 3. CGRP signalling in immune cells mediates skin and muscle healing.
a–d, Wildtype (wt) or Ramp1–/– mice were γ-irradiated and received a bone marrow transplant from wt or Ramp1–/– donor mice. Full-thickness skin wounds or quadriceps volumetric muscle loss were performed. Wound closure was evaluated by histomorphometric analysis of tissue sections at D6 post-injury (a) (n = 8). Representative histology (b). Black arrows indicate wound edges. Red arrows indicate tips of epithelium tongue. Scale bar = 1 mm. The extent of muscle regeneration (represented by the percentage of fibrotic tissue and muscle area) was evaluated by histomorphometric analysis of tissue sections at D12 post-injury (c) (n = 7). Representative histology D12 post-injury (fibrotic tissue is stained blue; muscle tissue is stained red) (d). Scale bar = 500 μm. e, Cell proliferation in response to CGRP treatment (2% FBS: n = 5 for keratinocytes, n = 4 for all other cell types; 10% FBS: n = 6 for fibroblasts and endothelial cells, n = 4 for keratinocytes and myoblasts). Foetal bovine serum (FBS, 10%–20%) was used as a positive control and results are expressed as fold change over saline control (0 nM CGRP with 2% or 10% FBS). For gel source data, see Supplementary Fig. 1. f, Calcrl and Ramp1 expression in fibroblasts, keratinocytes, myoblasts, and endothelial cells, detected by RT-PCR. Gapdh was used as the housekeeping gene. Repeated independently 3 times. g, Representative images showing the close proximity of CD11b+ cells with NaV1.8+ sensory neurons in granulation tissue 6D after skin and muscle injury (CD11b, green; NaV1.8, red; nuclei, blue). Scale bar = 50 μm. Repeated independently 4 times. All data are plotted in box plots showing median (centre line) and IQR (bounds). Whiskers show min. to max. range. Dots represent individual injuries or experiments. Two-tailed Student’s t-test in a,c. Two-tailed one-sample t-test over fold increase of 1 in e. P values are indicated; n.s., non-significant. Source Data
Extended Data Fig. 4
Extended Data Fig. 4. Analyse wound immune cell dynamics in injured skin and muscle.
a, Gating strategy to analyse myeloid cells in skin and muscle post-injury. Flow cytometry dot plots representing the step by step (1–6) gating strategy to identify neutrophil (CD11b+, Ly6G+, F4/80) monocytes/macrophages (Mo/Mϕ; CD11b+, F4/80+, Ly6G), and dendritic cells (CD11c+, MHC-II+). MFI is the geometric-mean of fluorescence intensity. b, Gating strategy to analyse T cells in skin and muscle post-injury. Flow cytometry dot plots representing the step by step (1–6) gating strategy to identify CD4 T cells (CD3+, CD4+), cytotoxic T cells (CD3+, CD8+), and γδ T cells (CD3+, TCRβ, TCRγδ+). c, Numbers of dendritic and T cells in skin and muscle injuries analysis measured by flow cytometry. Data are plotted in kinetic line plots showing mean ± SEM (Skin: n = 8 for D0, n = 10 for the other time points. Muscle: = 8). Two-way ANOVA with Bonferroni post hoc test for pair-wise comparisons. P values are indicated; n.s., non-significant. d, Bar graph representation of the average number of neutrophils, Mo/Mϕ, dendritic cells, and T cells in injured tissue at D3 post-injury in Rosa26DTA and Nav1.8Cre/Rosa26DTA mice. Source Data
Extended Data Fig. 5
Extended Data Fig. 5. CGRP expression in neutrophils and macrophages, its effects on Ramp1–/– cells, M2-Like macrophages, Ly6C expression, and CD11b+ cell apoptosis.
a, Calcrl and Ramp1 expression in bone marrow-derived neutrophils and macrophages detected by RT-PCR. Gapdh was used as the housekeeping gene. Repeated independently 3 times. For gel source data, see Supplementary Fig. 1. b, CALCRL and RAMP1 expression was detected in bone marrow-derived neutrophils and macrophages using immunostaining. CALCRL, green; RAMP1, red; nuclei, blue. Scale bars = 25 μm. Repeated independently 3 times. c, Neutrophils and macrophages derived from mouse bone marrow of LysMCre+/–/Ramp1fl/fl were treated with saline (PBS, 0 nM CGRP) or CGRP (1 nM) and transwell migration towards a chemoattractant (CXCL1 or CCL2) was tested (n = 4). Results are expressed as fold change over the saline PBS/0 nM CGRP control group. d,e, Bone marrow-derived macrophages were treated with saline (0 nM CGRP) or CGRP (1 or 20 nM). Cell death in response to CGRP when macrophages were cultured with anti-inflammatory cytokines (IL-4/IL-13, or IL-10) (d) (n = 6). Ly6C expression in response to CGRP treatment after macrophage culture in inflammatory (TNF/IL-1) or anti-inflammatory conditions (IL-10) (e) (n = 6). Results are expressed as fold increase over treatment without CGRP and without cytokines. MFI is the geometric-mean of fluorescence intensity. f, Representative images of TUNEL assay at D3 post-injury in Rosa26DTA and Nav1.8Cre/Rosa26DTA mice (CD11b, green; TUNEL, red; nuclei, blue). Scale bar = 100 μm. Repeated independently 6 times. All data are plotted in box plots showing median (central line) and IQR (bounds). Whiskers show min. to max. range. Dots represent independent experiments. Two-way ANOVA with Bonferroni post hoc test for pair-wise comparisons. n.s., non-significant. Source Data
Extended Data Fig. 6
Extended Data Fig. 6. TSP-1 mediates the activity of CGRP on neutrophils and macrophages.
a, Differentially expressed genes contributing to GO enrichment analysis of CGRP-treated neutrophils and macrophages. Neutrophils and monocytes/macrophages were treated with CGRP (1 nM) or saline for 4 h. Transcriptomic profiling was performed by bulk RNA sequencing. Heatmap of selected significantly upregulated and downregulated genes depicting standardised gene expression values (z-scores) in CGRP-treated cells compared to PBS-treated cells. Individual biological replicates are shown (n = 3). Genes are displayed in alphabetical order and further classified according to known functions indicated by the coloured circles next to the heat map. b, Thbs1 expression after CGRP (1 nM) stimulation for 4 h in neutrophils and macrophages isolated form LysMCre+/– and LysMCre+/–/Ramp1fl/fl mice (n = 3). Dots represent independent experiments. Horizontal bars show mean. Whiskers show min. to max. range. c, TSP-1 concentration in skin and muscle before (uninjured) and at D3 post-injury quantified by ELISA (n = 4). d, Knockdown (KD) efficiency of TSP-1 by siRNA verified by qPCR analysis in macrophages. Results are expressed as relative expression over cells transfected with scramble siRNA (n = 6). e–h, Macrophages derived from mouse bone marrow were transfected with scramble siRNA or Thbs1 siRNA and treated with saline (PBS, 0 nM CGRP) or CGRP (1 nM). Results are expressed as fold change over the PBS/0 nM CGRP control group. Transwell migration towards CCL2 in the presence of CGRP (e) (n = 9). Cell death in response to CGRP with or without TNF/IL-1 (f) (n = 7). Macrophage efferocytosis of neutrophils after CGRP treatment (g) (n = 5). Macrophage M2-like polarisztion determined via CD206 expression in response to CGRP and IL-4/IL-13 (h) (n = 10). i, Saline or TSP-1 (total 10 μg) was injected in mouse skin wound borders at D1 and D3 post-injury or delivered in mouse quadriceps volumetric muscle loss defect via a fibrin hydrogel right after injury. Neutrophil and monocyte/macrophage (Mo/Mϕ) populations in injured tissues were analysed by flow cytometry at D3 post-delivery. CD206 level measurements were performed at D14 post-delivery (n = 6). MFI is the geometric-mean of fluorescence intensity. All data are plotted in box plots showing median (central line) and IQR (bounds). Whiskers show min. to max. range. Dots represent independent experiments. Two-tailed Student’s t-test in b,c,d,i. One-way ANOVA with Tukey post hoc test for pair-wise comparisons in e–h. P values are indicated; n.s., non-significant. Source Data
Extended Data Fig. 7
Extended Data Fig. 7. Rescue of tissue healing in Nav1.8Cre/Rosa26DTA mice by local delivery of CGRP variants.
a, Design and amino acid sequences of wild-type CGRP and eCGRP. Disulfide bonds are indicated in yellow. Amid indicates amidation of the C-terminus phenylalanine. ECM-binding sequence from placenta growth factor (PlGF) is in red. Plasmin-sensitive site from vitronectin is in grey. b, CGRP and eCGRP were incubated with or without plasmin and analysed by SDS-PAGE. The gels show cleavage of the ECM-binding sequence in eCGRP by plasmin. Repeated independently 3 times. For gel source data, see Supplementary Figure 1. c, eCGRP activity was assessed using neutrophil and macrophage migration. The graphs show migration towards a chemoattractant (CXCL-1 or CCL2) in the presence of saline (PBS) or CGRP variants (20 nM). Results are expressed as fold change over saline control. Data are plotted in box plots showing median (central line) and IQR (bounds). Whiskers show min. to max. range. Dots represent individual experiments (n = 4). d, Neutrophils and macrophages were isolated from LysMCre+/– and LysMCre+/–/Ramp1fl/fl mice. Cells were stimulated with CGRP or eCGRP (1 nM) for 30 min. cAMP concentration in cell lysates was measured by competitive ELISA (n = 4). e,f, CGRP (1 μg) or equimolar eCGRP was delivered intradermally or intramuscularly in Nav1.8Cre/Rosa26tdT mice. One day post-delivery, tissues were harvested and CGRP variants were detected by immunostaining. Representative skin and muscle tissue sections. CGRP signal coming from exogenous CGRP variants appears in green. Arrows indicate CGRP signal coming from NaV1.8+ sensory neurons (in red). Nuclei are in blue. Scale bars = 50 μm. Quantification of CGRP-positive area and signal intensity expressed as integrated density (f) (n = 5 for skin, n = 4 for muscle). g,h, Saline, low dose of CGRP (250 ng), high dose of CGRP (500 ng), or equimolar eCGRP was delivered on Nav1.8Cre/Rosa26DTA mouse skin wounds (D1 post-injury for low dose and D1 and D3 post-injury for high dose). Skin wound closure D6 post-injury evaluated by histomorphometric analysis (g) (n = 16 for saline; n = 8 for low; n = 10 for high). Representative skin histology (h). Black arrows indicate wound edges and red arrows indicate tips of epithelium tongue. Scale bar = 1 mm. i,j, Saline, low dose of CGRP (250 ng), high dose of CGRP (1 μg), or equimolar eCGRP was delivered in Nav1.8Cre/Rosa26DTA mouse quadriceps volumetric muscle loss defect via a fibrin hydrogel. The extent of muscle regeneration (represented by the percentage of fibrotic tissue and muscle area) was evaluated by histomorphometric analysis of tissue sections at D8 (low dose) and D12 (high dose) post-injury (i) (D12: n = 6; D8: n = 7 for saline and high, n = 6 for low). Representative histology (fibrotic tissue is stained dark blue; muscle tissue is stained red) (j). Scale bar = 1 mm. k, Mice received one injection of saline, CGRP (1 μg), equimolar eCGRP, or capsaicin (positive control) in the right hind paw. Graphs show duration and frequency of nocifensive behaviours recorded for 5 min at various time points (n = 8). l, Mice received one injection of saline, CGRP (1 μg), or equimolar eCGRP in the right hind paw. Graph shows thermal withdrawal latency at various time points post-injection (n = 8). All data are plotted in box plots showing median (central line) and IQR (bounds). Whiskers show min. to max. range. Dots represent independent experiments or injuries. One-way ANOVA with Tukey post hoc test for pair-wise comparisons in c,d,g,i. Two-tailed Student’s t-test in f. Two-way ANOVA with Bonferroni post hoc test for pair-wise comparisons in k,l. P values are indicated; n.s., non-significant. Source Data
Extended Data Fig. 8
Extended Data Fig. 8. CGRP levels in Leprdb/db mice and TSP-1 deposition in response to eCGRP delivery.
a, CGRP expression in uninjured skin and muscle of wildtype (Lepr+/+) and diabetic (Leprdb/db) mice was detected by immunostaining of tissue sections. The graphs show quantification of CGRP-positive area (n = 6). b, Skin wounds and muscle defects in Leprdb/db mice were treated with eCGRP. Expression of TSP-1 in granulation tissue was detected at D4 via immunostaining of tissue sections. TSP-1 in green, myeloid cells (CD11b) in red, nuclei in blue. Scale bar = 200 μm. Graphs show quantification of TSP-1–positive area, TSP-1 signal intensity expressed as integrated density and TSP-1-positive area in CD11b+ cells (n = 6). All data are plotted in box plots showing median (central line) and IQR (bounds). Whiskers show min. to max. range. Dots represent individual tissue sections. Two-tailed Student’s t-test in a,b. P values are indicated. Source Data
Extended Data Fig. 9
Extended Data Fig. 9. Gating strategy to analyse wound immune cell dynamics in diabetic mice as well as cytokine and protease levels after eCGRP treatment.
a, Gating strategy to analyse myeloid cells skin and muscle post-injury. Flow cytometry dot plots representing the step by step (1–6) gating strategy to identify neutrophil (CD11b+, Ly6G+, F4/80) and macrophage populations (CD11b+, F4/80+, Ly6G). MFI is the geometric-mean of fluorescence intensity. b, Saline or eCGRP was delivered on Leprdb/db skin wounds or in quadricep volumetric muscle loss defect via a fibrin hydrogel. The levels of CCL2, IL-1β, CXCL2, MMP-2, and MMP-9 in injured tissues were quantified by ELISA (n = 8 for skin, n = 4 for muscle). Data are plotted in box plots showing median (central line) and IQR (bounds). Whiskers show min. to max. range. Dots represent individual injuries. Two-way ANOVA with Bonferroni post hoc test for pair-wise comparisons. P values are indicated. Source Data
Extended Data Fig. 10
Extended Data Fig. 10. Summary of the neuro-immune-regenerative axis after acute injury in skin and muscle.
The schematic shows the proposed mechanisms by which nociceptors promote tissue healing via controlling neutrophils and monocytes/macrophages (Mo/Mϕ) in injured tissues. Following tissue injury, CGRP-expressing nociceptor endings grow into the granulation tissue. CGRP signalling in neutrophils and macrophages induces the release of the ECM protein TSP-1. TSP-1 is deposited in the injured tissue milieu inhibiting neutrophil and monocytes/macrophage migration and eventually accelerating the cell death response of neutrophils and macrophages to inflammatory cytokines. In addition, CGRP promotes efferocytosis and macrophage polarization into a M2-like phenotype via an autocrine or paracrine effect of TSP-1. Overall, nociceptors are critical for the transition of the injured tissue microenvironment towards a tissue healing phase. Blue line indicates inhibition, red line indicates induction. Dashed grey lines indicate that CGRP and TSP-1 may also promote tissue healing by acting on non-immune cells. Created with BioRender.com.

References

    1. Julier, Z., Park, A. J., Briquez, P. S. & Martino, M. M. Promoting tissue regeneration by modulating the immune system. Acta Biomater.53, 13–28 (2017). - PubMed
    1. Larouche, J., Sheoran, S., Maruyama, K. & Martino, M. M. Immune regulation of skin wound healing: mechanisms and novel therapeutic targets. Adv. Wound Care7, 209–231 (2018). - PMC - PubMed
    1. Muire, P. J., Mangum, L. H. & Wenke, J. C. Time course of immune response and immunomodulation during normal and delayed healing of musculoskeletal wounds. Front. Immunol.11, 1056 (2020). - PMC - PubMed
    1. Hanc, P., Messou, M. A., Wang, Y. & von Andrian, U. H. Control of myeloid cell functions by nociceptors. Front. Immunol.14, 1127571 (2023). - PMC - PubMed
    1. Chiu, I. M. et al. Bacteria activate sensory neurons that modulate pain and inflammation. Nature501, 52–57 (2013). - PMC - PubMed

MeSH terms

Substances