. 2024 May;129(5):712-726.
doi: 10.1007/s11547-024-01811-0. Epub 2024 Mar 27.

Multi-omics staging of locally advanced rectal cancer predicts treatment response: a pilot study

Affiliations

Multi-omics staging of locally advanced rectal cancer predicts treatment response: a pilot study

Ilaria Cicalini et al. Radiol Med. 2024 May.

Abstract

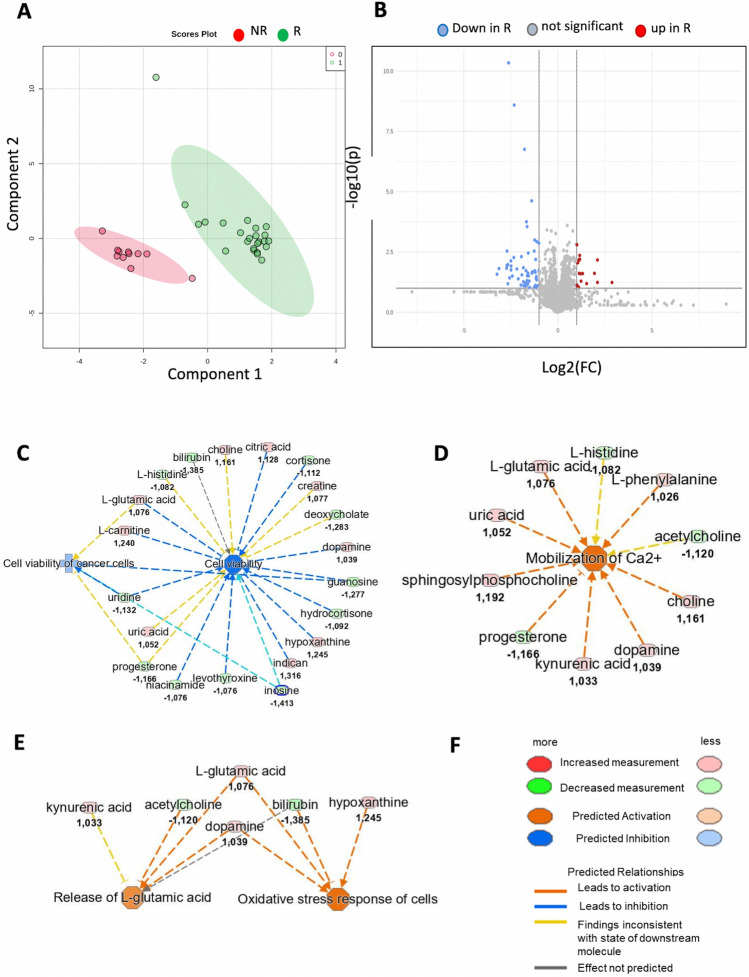
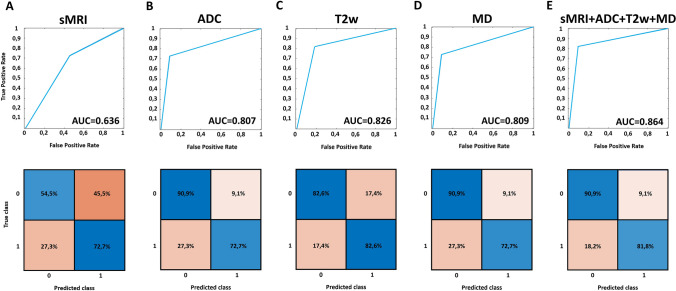
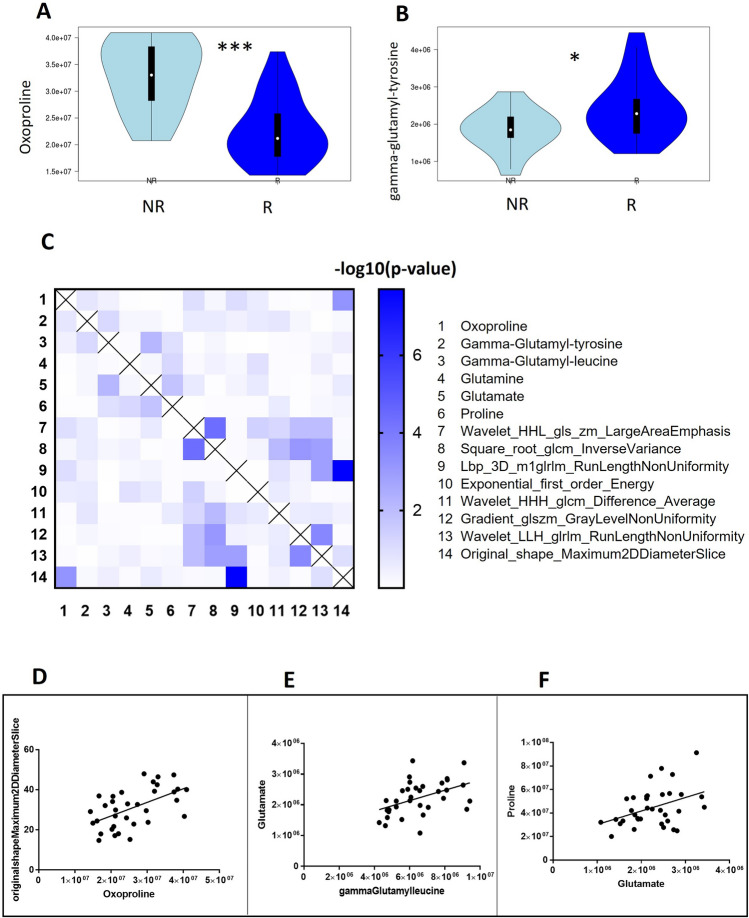
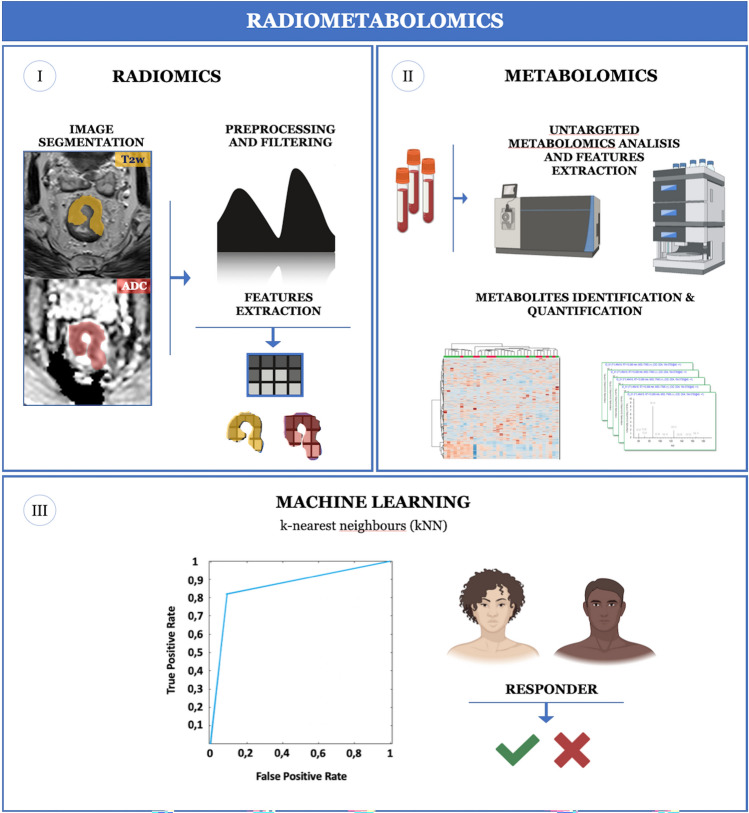
Treatment response assessment of rectal cancer patients is a critical component of personalized cancer care and it allows to identify suitable candidates for organ-preserving strategies. This pilot study employed a novel multi-omics approach combining MRI-based radiomic features and untargeted metabolomics to infer treatment response at staging. The metabolic signature highlighted how tumor cell viability is predictively down-regulated, while the response to oxidative stress was up-regulated in responder patients, showing significantly reduced oxoproline values at baseline compared to non-responder patients (p-value < 10-4). Tumors with a high degree of texture homogeneity, as assessed by radiomics, were more likely to achieve a major pathological response (p-value < 10-3). A machine learning classifier was implemented to summarize the multi-omics information and discriminate responders and non-responders. Combining all available radiomic and metabolomic features, the classifier delivered an AUC of 0.864 (± 0.083, p-value < 10-3) with a best-point sensitivity of 90.9% and a specificity of 81.8%. Our results suggest that a multi-omics approach, integrating radiomics and metabolomic data, can enhance the predictive value of standard MRI and could help to avoid unnecessary surgical treatments and their associated long-term complications.

Keywords: Magnetic resonance imaging; Metabolomics; Multi-omics; Radiomics; Rectal cancer; Treatment response.


Conflict of interest statement

The authors declare they have no competing interests.

Figures

Fig. 1
Fig. 1
Workflow of untargeted metabolomics approach. The number of features taken into consideration in the various steps, up to the final data matrix, is shown in bold. Each processing step was described detailing the inclusion and exclusion criteria. Exclusion list includes compounds present in the blank sample that are considered potential contaminants. Inclusion list includes molecules present in the sample excluding contaminants. Chromatographic retention times (RT) and the minimum signal-to-noise ratio (S/N) were the inclusion criteria for the quantification step. The databases and the mass tolerance (expressed in ppm) were the inclusion criteria in the identification step
Fig. 2
Fig. 2
A sPLS-DA based on 4000 features in the plasma of responder (R) and non-responder (NR) patients. B Volcano plot of 4000 metabolomic features classifying them in not significant (gray), significantly down-regulated in RP (blue dots) and significantly up-regulated in RP (red dots). C Prediction of down-regulated cellular functions “Cell viability” and “Cell viability of cancer cells” in R patients. D Predicted of up-regulated cellular function “Mobilization of Ca2 + ” in R patients. E Predicted up-regulation of cellular function “Oxidative stress response of cells” and “Release of l-glutamic acid” in R patients. F Legend of color code for increased and decreased measurement of metabolites, and predicted activation and inhibition of disease and cellular function
Fig. 3
Fig. 3
ROC curve and best cutoff point confusion matrix delivered by the classification performed relying on A sMRI data, B ADC metrics, C T2w metrics, D MD data and E sMRI + ADC + T2w + MD data
Fig. 4
Fig. 4
A, B Violin plot showing the distribution of oxoproline (Panel A) and gamma-glutamyl-tirosine (Panel B) for non-responder (in red) and responder (in green) patients. C Heatmap of the p-value for the correlation of 14 radiometabolomics features described in the legend on the right. D Pearson correlation between oxoproline levels and radiomics features called (original shape maximum 2D diameter slice). E Pearson correlation between gamma-glutamyl-leucine and glutamate levels. F Pearson correlation between glutamate and proline level. *** means p-value of Mann–Whitney test < 0.001, * means p-value of Mann–Whitney test < 0.05
Fig. 5
Fig. 5
Study workflow. In the first step (I), rectal cancer was manually segmented on MR images (T2w, ADC), followed by radiomics features extraction. In the second step (II), plasma untargeted metabolomics analysis and metabolites identification and quantification were performed. In the final step (III), a machine learning algorithm (k-nearest neighbors—kNN) was used to select radiometabolomics features and ROC analysis delivered the classification model accuracy for treatment response prediction (created with BioRender.com)

References

    1. Araghi M, Soerjomataram I, Jenkins M, Brierley J, Morris E, Bray F, Arnold M. Global trends in colorectal cancer mortality: projections to the year 2035. Int J Cancer. 2019;144(12):2992–3000. doi: 10.1002/ijc.32055. - DOI - PubMed
    1. Habr-Gama A, Perez RO, Nadalin W, Sabbaga J, Ribeiro U, Jr, Silva e Sousa AH, Jr, Campos FG, Kiss DR, Gama-Rodrigues J. Operative versus nonoperative treatment for stage 0 distal rectal cancer following chemoradiation therapy: long-term results. Ann Surg. 2004;240(4):711–717. doi: 10.1097/01.sla.0000141194.27992.32. - DOI - PMC - PubMed
    1. van der Valk MJM, Hilling DE, Bastiaannet E, Meershoek-Klein Kranenbarg E, Beets GL, Figueiredo NL, Habr-Gama A, Perez RO, Renehan AG, van de Velde CJH, Consortium I. Long-term outcomes of clinical complete responders after neoadjuvant treatment for rectal cancer in the International Watch & Wait Database (IWWD): an international multicentre registry study. Lancet. 2018;391(10139):2537–2545. doi: 10.1016/S0140-6736(18)31078-X. - DOI - PubMed
    1. Beets-Tan RGH, Lambregts DMJ, Maas M, Bipat S, Barbaro B, Curvo-Semedo L, Fenlon HM, Gollub MJ, Gourtsoyianni S, Halligan S, Hoeffel C, Kim SH, Laghi A, Maier A, Rafaelsen SR, Stoker J, Taylor SA, Torkzad MR, Blomqvist L. Magnetic resonance imaging for clinical management of rectal cancer: updated recommendations from the 2016 European Society of Gastrointestinal and Abdominal Radiology (ESGAR) consensus meeting. Eur Radiol. 2018;28(4):1465–1475. doi: 10.1007/s00330-017-5026-2. - DOI - PMC - PubMed
    1. Jayaprakasam VS, Alvarez J, Omer DM, Gollub MJ, Smith JJ, Petkovska I. Watch-and-wait approach to rectal cancer: the role of imaging. Radiology. 2023 doi: 10.1148/radiol.221529. - DOI - PMC - PubMed

LinkOut - more resources