. 2024 Mar 27;88(4):48.
doi: 10.1007/s00285-024-02076-x.

How immune dynamics shape multi-season epidemics: a continuous-discrete model in one dimensional antigenic space

Affiliations

How immune dynamics shape multi-season epidemics: a continuous-discrete model in one dimensional antigenic space

M G Roberts et al. J Math Biol. .

Abstract

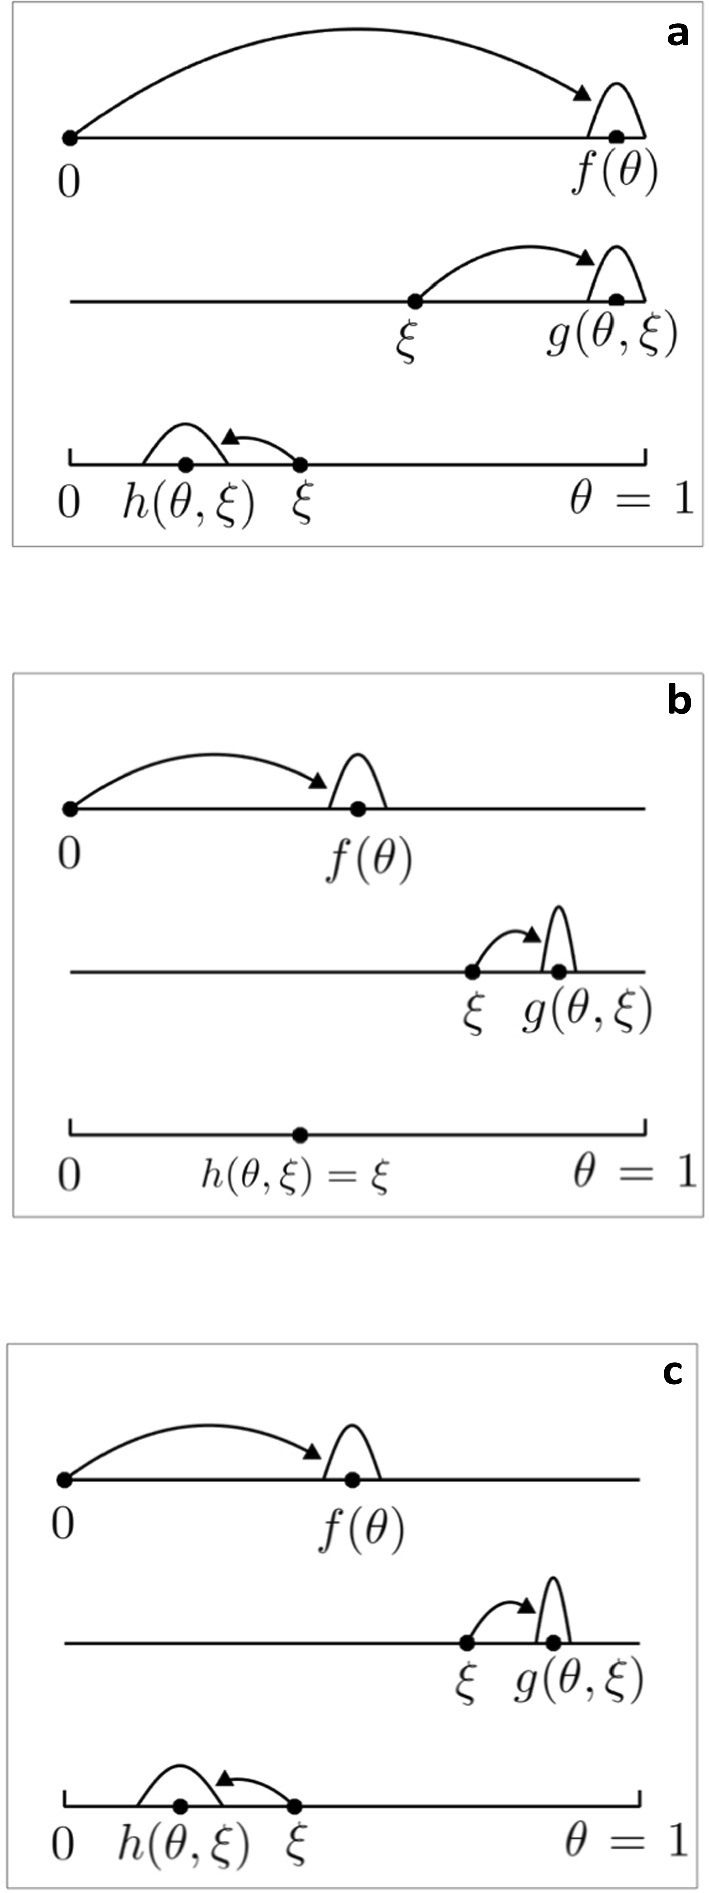
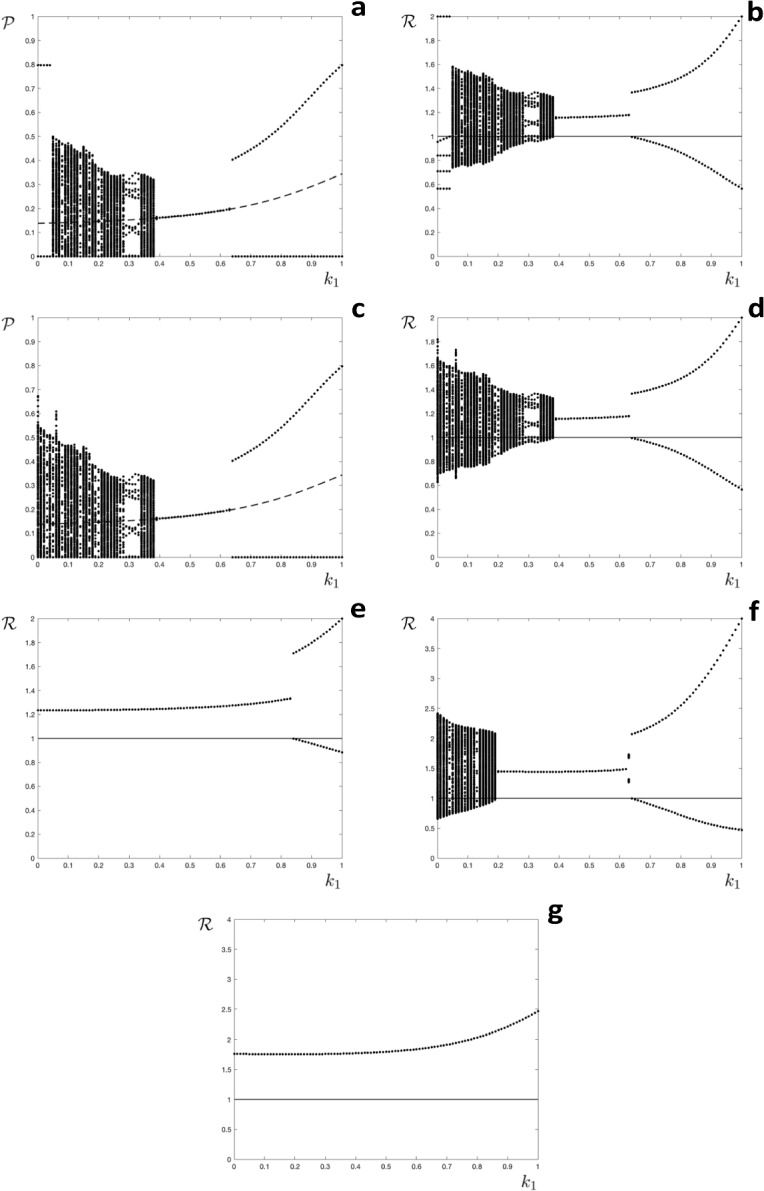
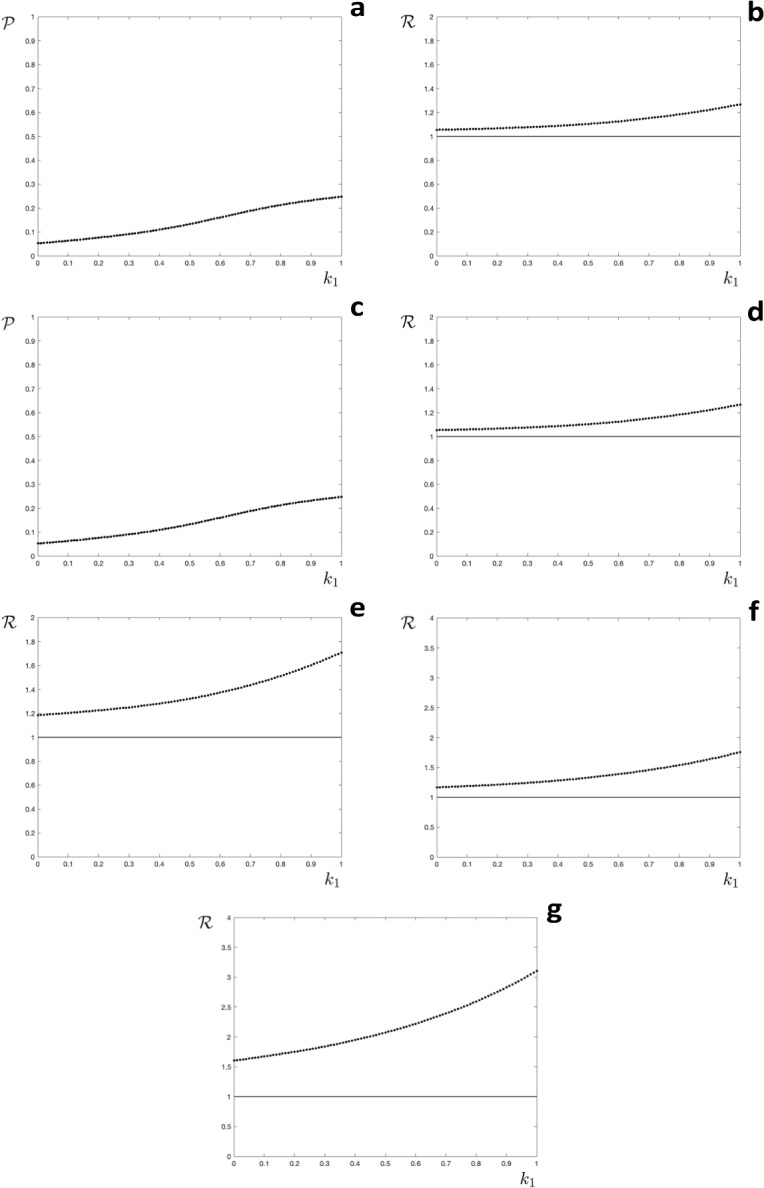
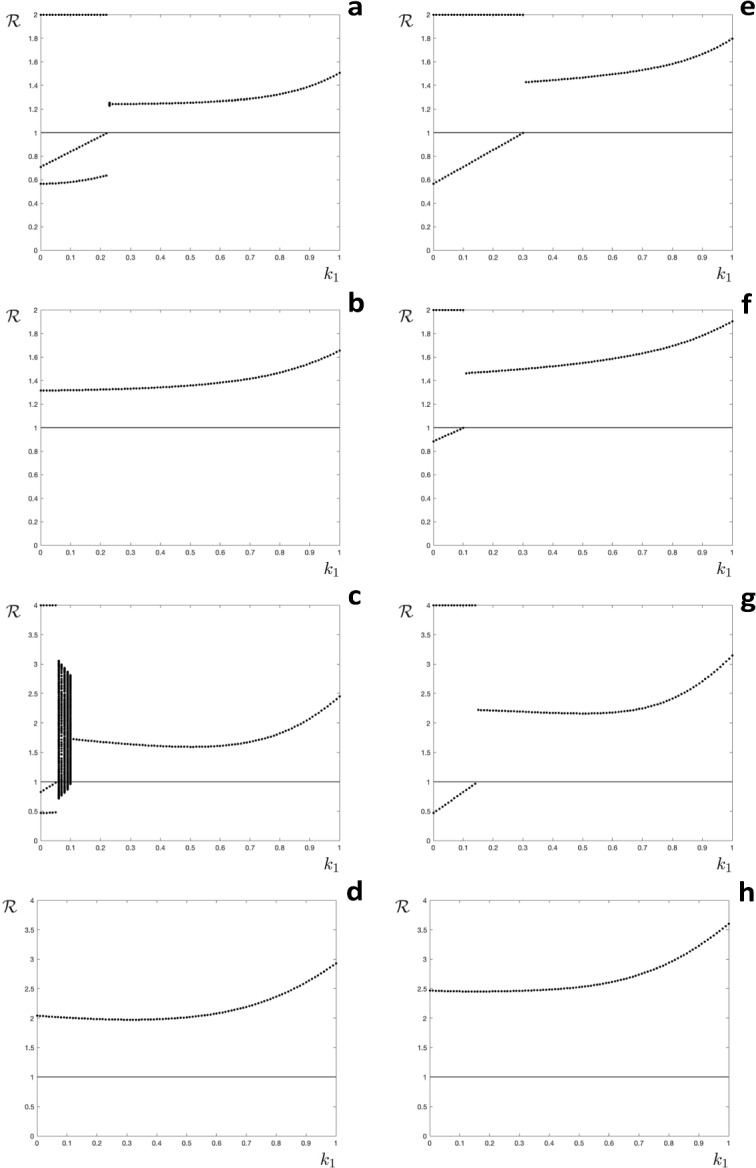
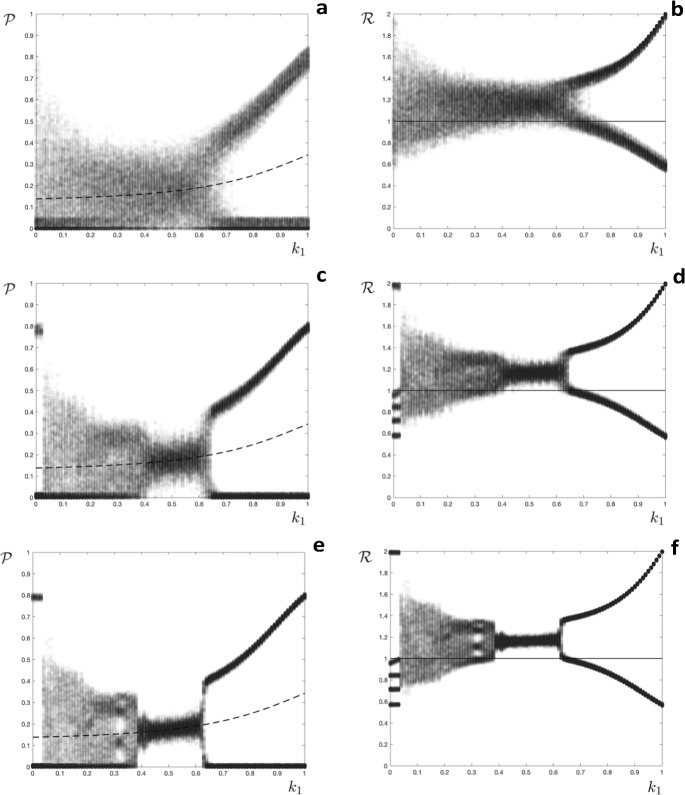
We extend a previously published model for the dynamics of a single strain of an influenza-like infection. The model incorporates a waning acquired immunity to infection and punctuated antigenic drift of the virus, employing a set of coupled integral equations within a season and a discrete map between seasons. The long term behaviour of the model is demonstrated by examples where immunity to infection depends on the time since a host was last infected, and where immunity depends on the number of times that a host has been infected. The first scenario leads to complicated dynamics in some regions of parameter space, and to regions of parameter space with more than one attractor. The second scenario leads to a stable fixed point, corresponding to an identical epidemic each season. We also examine the model with both paradigms in combination, almost always but not exclusively observing a stable fixed point or periodic solution. Adding stochastic perturbations to the between season map fails to destroy the model's qualitative dynamics. Our results suggest that if the level of host immunity depends on the elapsed time since the last infection then the epidemiological dynamics may be unpredictable.

Keywords: Discrete dynamics; Dynamical systems; Epidemiological modelling; SARS-CoV-2; Seasonal influenza.


Conflict of interest statement

The authors have no conflict of interest to declare that are relevant to the content of this article.

Figures

Fig. 1
Fig. 1
Illustration of the modes of action used to model the immune response. a the time since last infection determines immunity; b the number of infections determines immunity; c the general case where the two mechanisms combine. The function f(θ) models the response of previously uninfected hosts to infection, the function g(θ,ξ) models the response of previously infected hosts to infection, and the function h(θ,ξ) models the loss of immunity in the absence of infection
Fig. 2
Fig. 2
Orbit diagrams for the model where the time since last infection determines immunity. a, c the annual proportion of hosts infected (P) as a function of the level of partial immunity (k1), the broken line shows an unstable fixed point; b, dg: the effective reproduction number (R) as a function of the level of partial immunity (k1), the horizontal line is at R=1. ad: R0=2.0, c=0.9. e R0=2.0, c=0.7. F: R0=4.0, c=0.9. g R0=4.0, c=0.7. Initial conditions a, b, e, f, g: s0=0=0,0,0,0, c, d: s0=s¯=0.3,0.2,0.1,0
Fig. 3
Fig. 3
Orbit diagrams for the model where the number of infections determines immunity. a, c the annual proportion of hosts infected (P) as a function of the level of partial immunity (k1), the broken line shows an unstable fixed point; b, dg: the effective reproduction number (R) as a function of the level of partial immunity (k1), the horizontal line is at R=1. ad R0=2.0, c=0.9. e: R0=2.0, c=0.7. f R0=4.0, c=0.9. g: R0=4.0, c=0.7. Initial conditions a, b, eg: s0=0,0,0,0, C,D: s0=0.3,0.2,0.1,0
Fig. 4
Fig. 4
Orbit diagrams for the general model. The effective reproduction number (R) as a function of the level of partial immunity (k1). ad Having been infected increases immunity more than the loss due to escaping infection. eh Having been infected increases immunity less than the loss due to escaping infection. a, e R0=2.0, c=0.9. b, f R0=2.0, c=0.7. c, g R0=4.0, c=0.9. d, h: R0=4.0, c=0.7. Initial conditions s0=0,0,0,0, the horizontal line is at R=1
Fig. 5
Fig. 5
Orbit diagrams for the model where the time since last infection determines immunity and stochastic perturbations have been added. A,C,E: the annual proportion of hosts infected (P) as a function of the level of partial immunity (k1), the broken line shows an unstable fixed point of the corresponding deterministic model; B,D,F: the effective reproduction number (R) as a function of the level of partial immunity (k1), the horizontal line is at R=1. A,B: δ=0.05; C,D: δ=0.02; E,F: δ=0.01. Initial conditions s0=0,0,0,0

Similar articles

References

    1. Andreasen V. Dynamics of annual influenza A epidemics with immuno-selection. J Math Biol. 2003;46:504–536. doi: 10.1007/s00285-002-0186-2. - DOI - PubMed
    1. Bacaer N, Ouifki R. Growth rate and basic reproduction number for population models with a simple periodic factor. Math Biosci. 2007;210:647–658. doi: 10.1016/j.mbs.2007.07.005. - DOI - PubMed
    1. Callaway E. What Omicron’s BA.4 and BA.5 variants mean for the pandemic. Nature. 2022;606:848–849. doi: 10.1038/d41586-022-01730-y. - DOI - PubMed
    1. Dan JD, Mateus J, Kato Y, Hastie KM, Yu ED, Faliti CE, Grifoni A, Ramirez SI, Haupt S, Frazier A, Nakao C, Rayaprolu V, Rawlings SA, Peters B, Krammer F, Simon V, Saphire EO, Smith DM, Weiskopf D, Sette A, Crotty S (2021) Immunological memory to SARS-CoV-2 assessed for up to 8 months after infection. Science. 10.1126/science.abf4063 - PMC - PubMed
    1. Diekmann O, Heesterbeek JAP, Britton T. Mathematical tools for understanding infectious disease dynamics. Princeton: Princeton University Press; 2013.

Publication types

Grants and funding