. 2024 May;27(5):846-861.
doi: 10.1038/s41593-024-01613-7. Epub 2024 Mar 27.

Long-term in vivo three-photon imaging reveals region-specific differences in healthy and regenerative oligodendrogenesis

Affiliations

Long-term in vivo three-photon imaging reveals region-specific differences in healthy and regenerative oligodendrogenesis

Michael A Thornton et al. Nat Neurosci. 2024 May.

Abstract

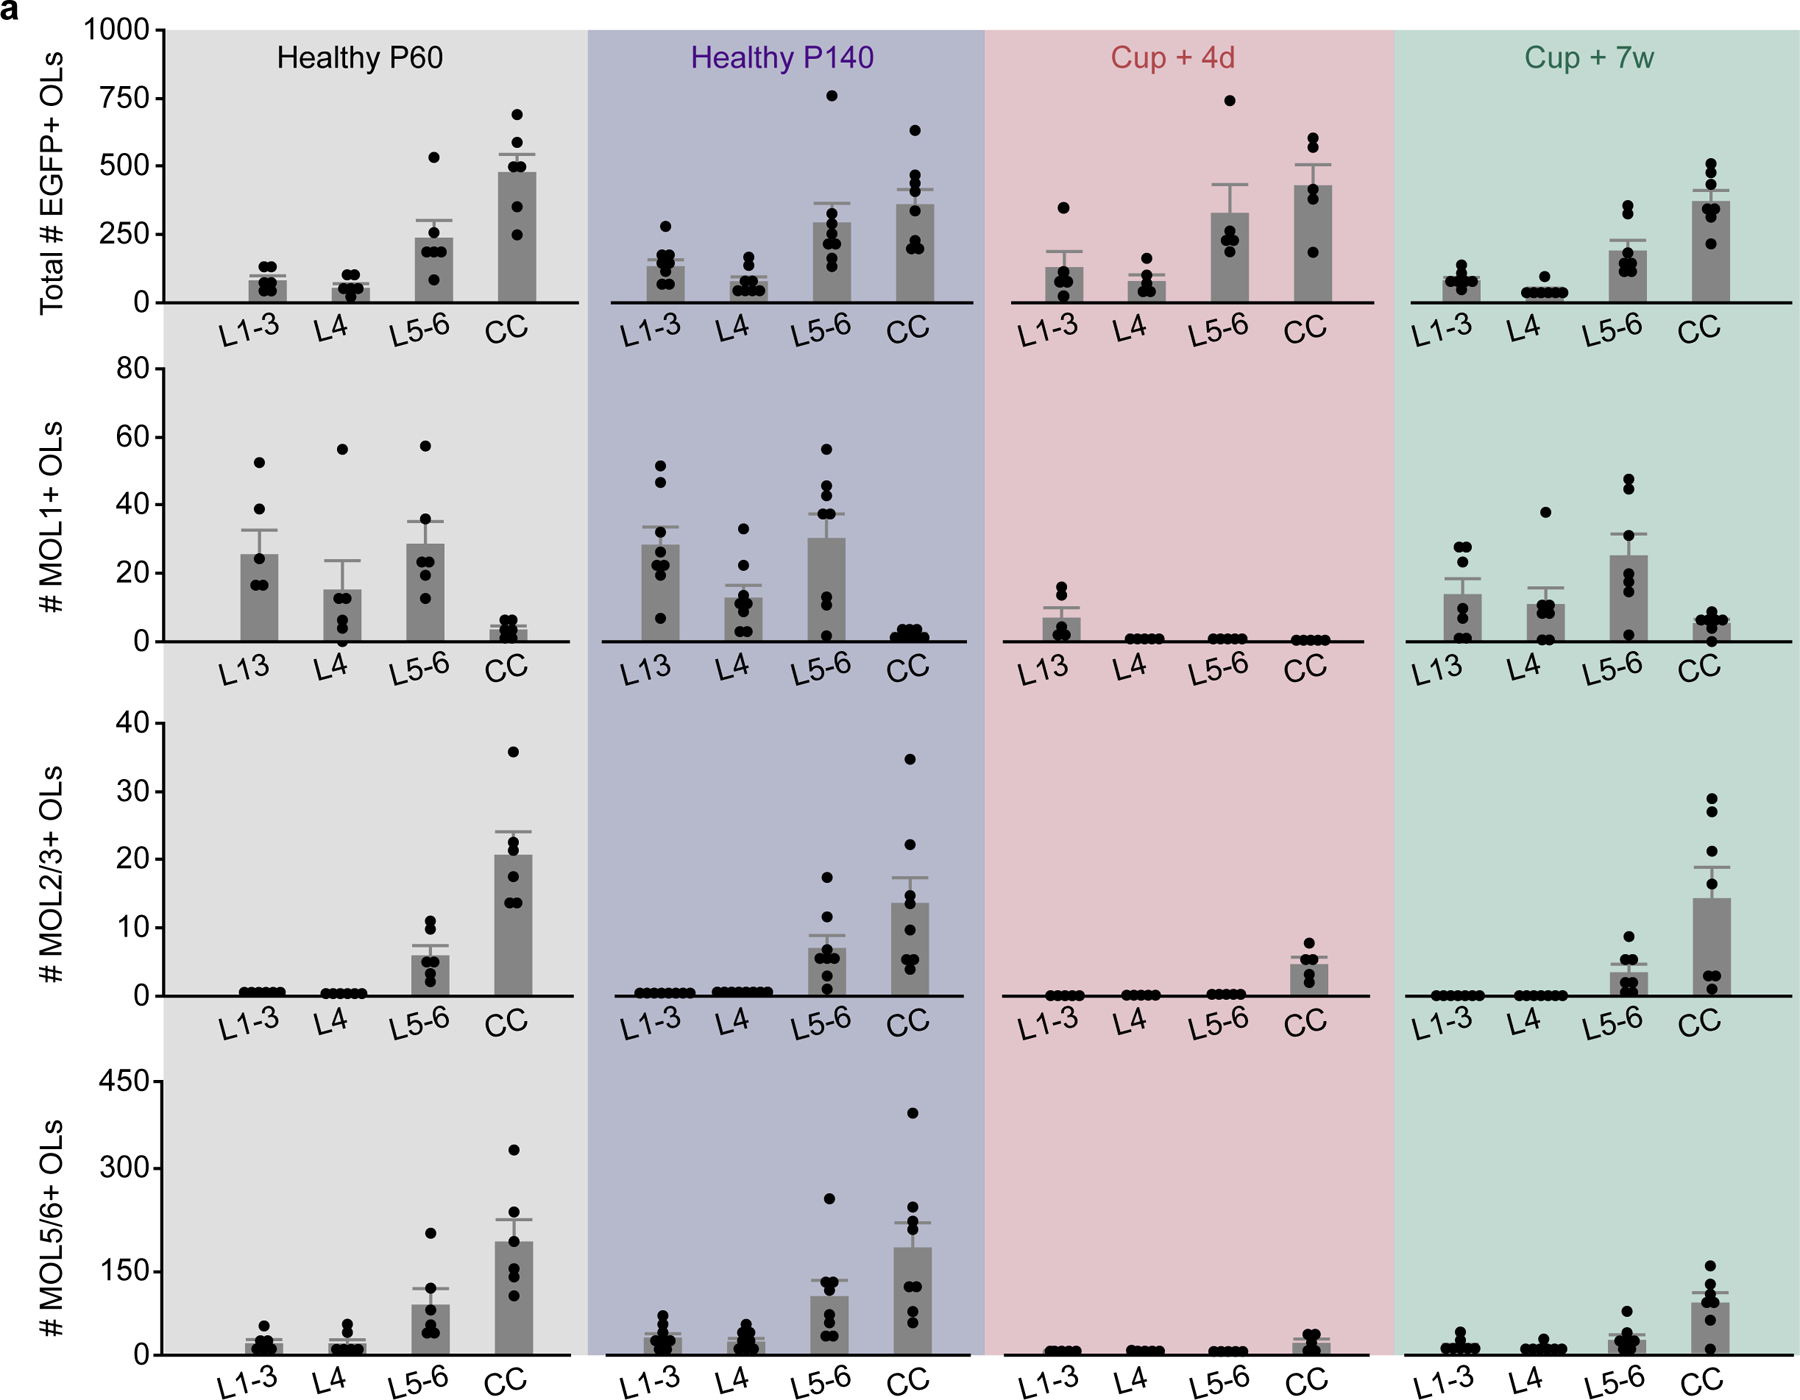
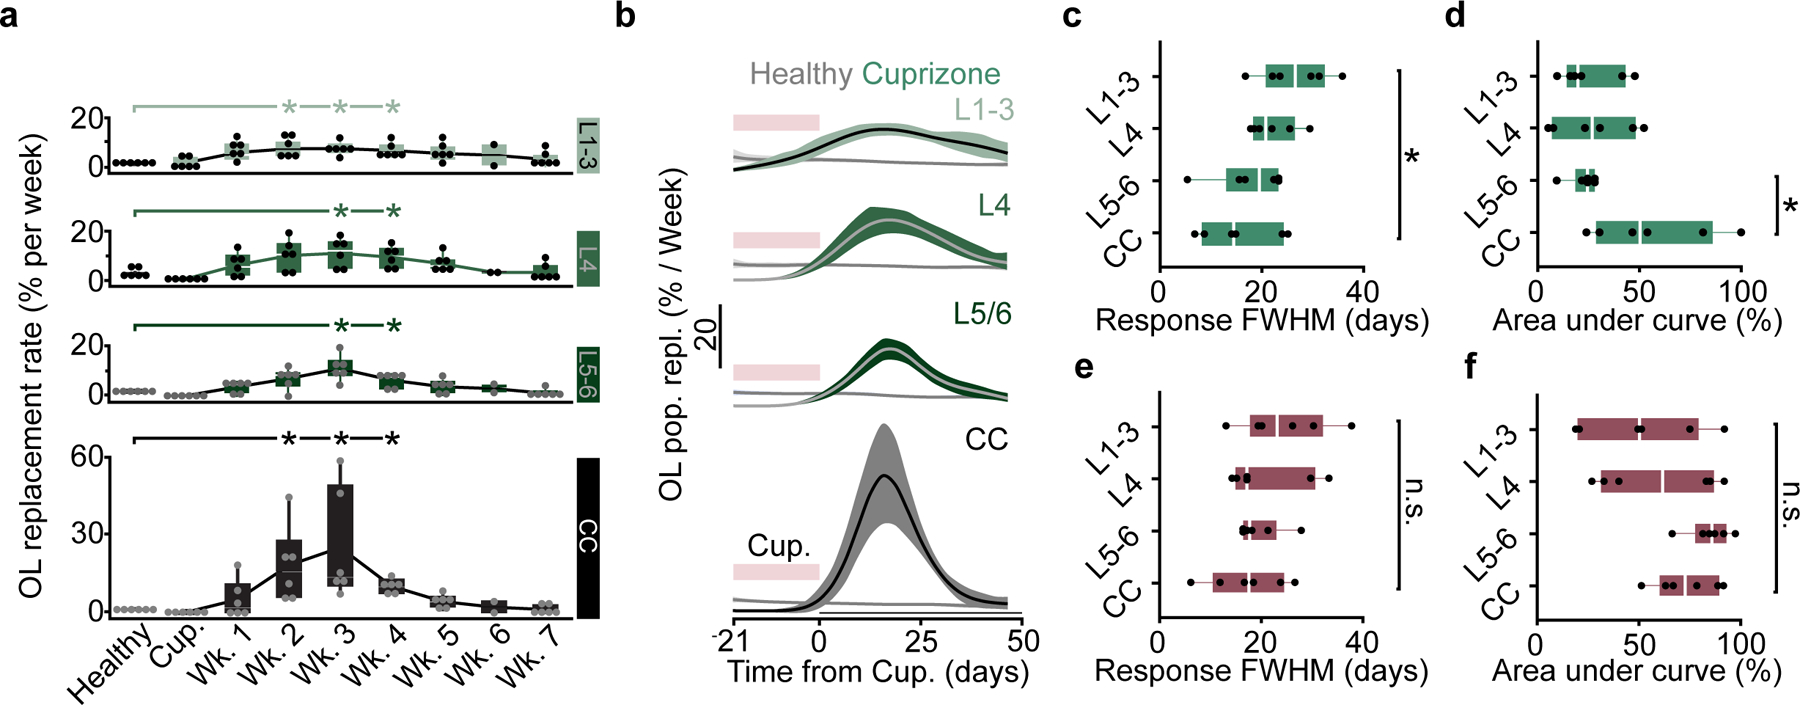
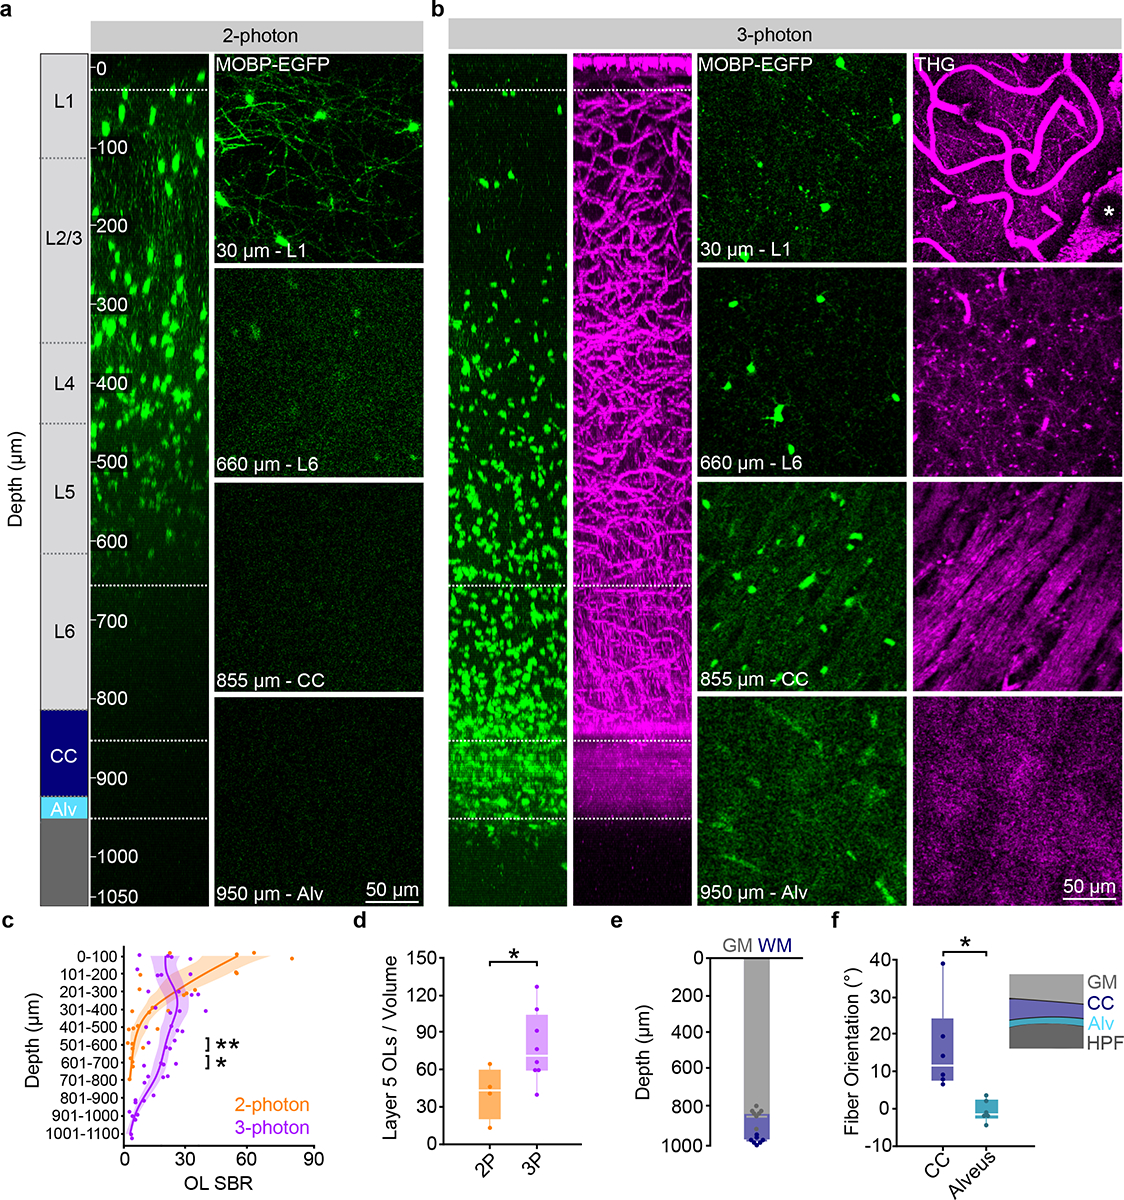
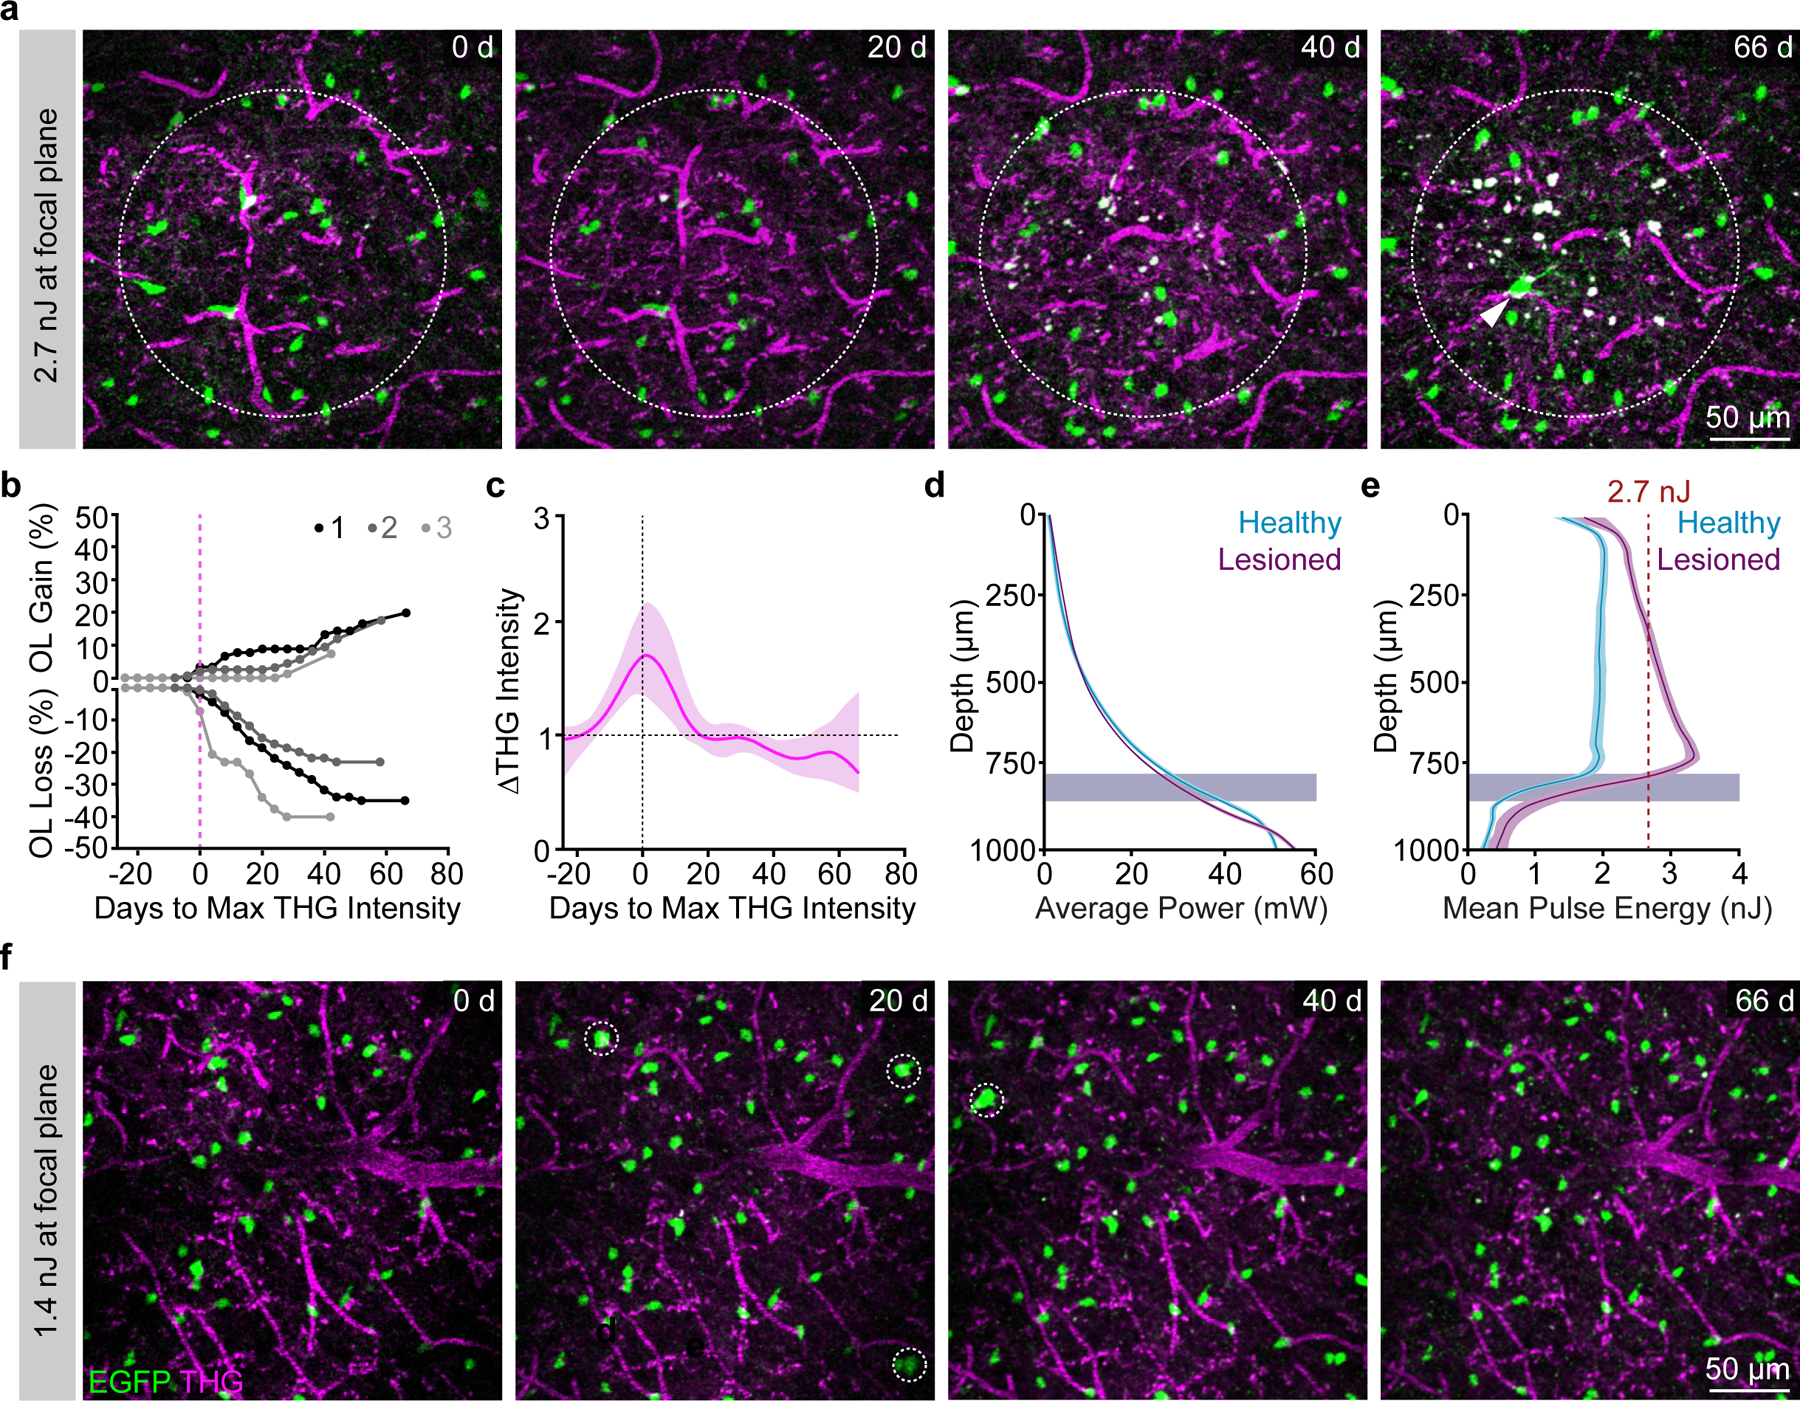
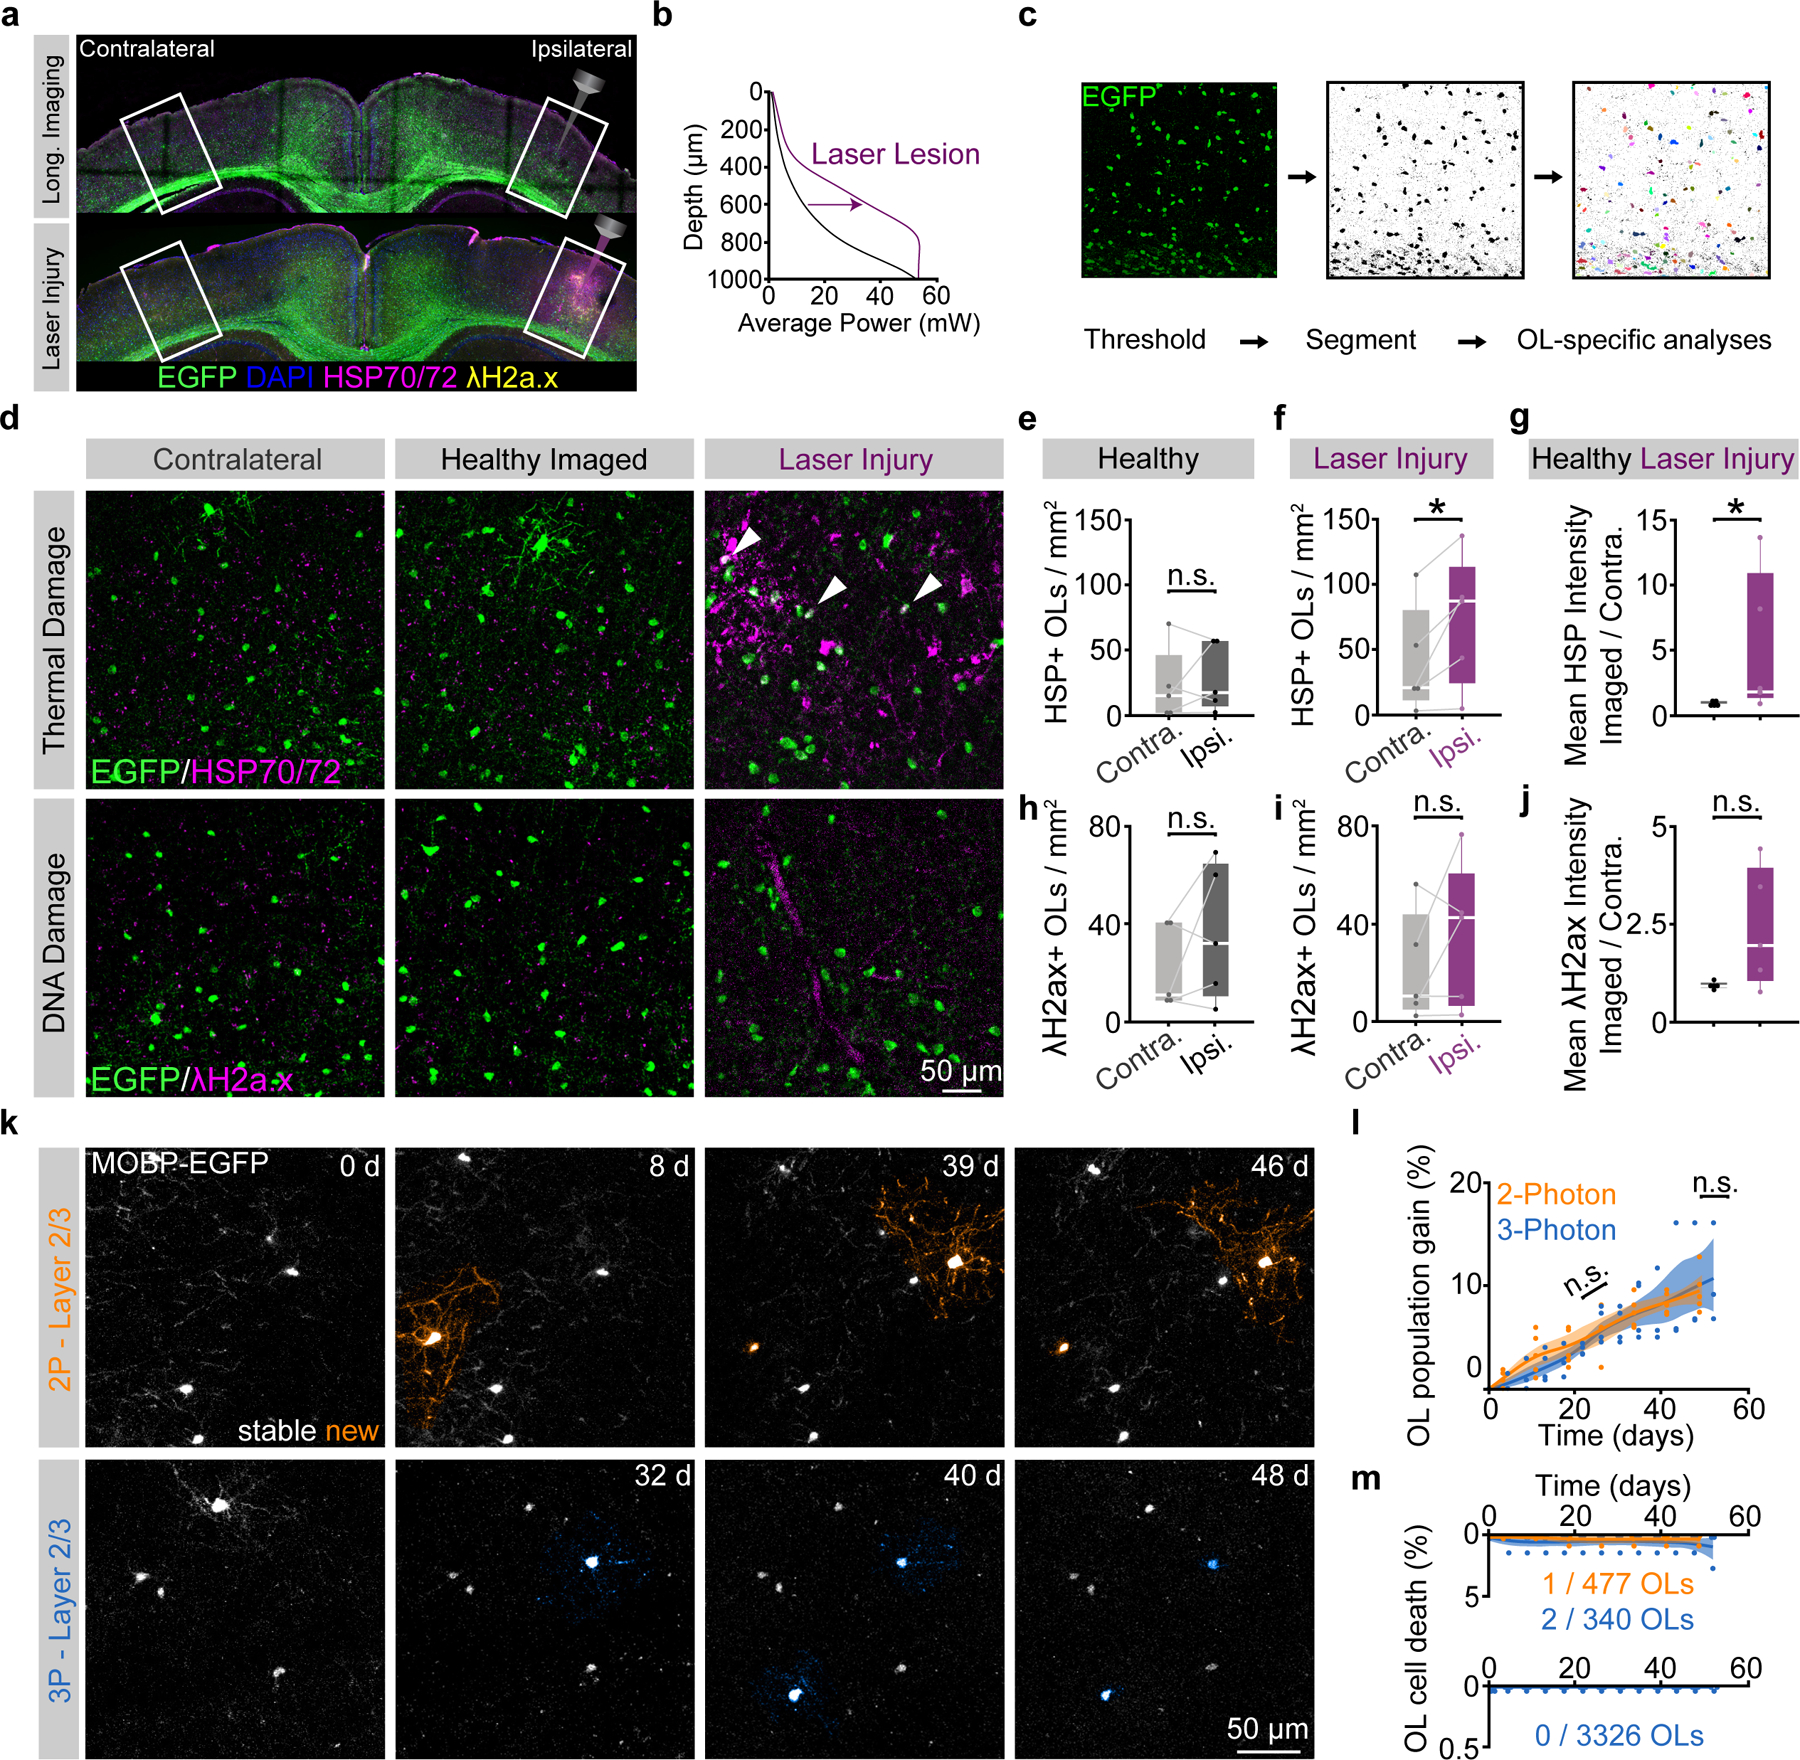
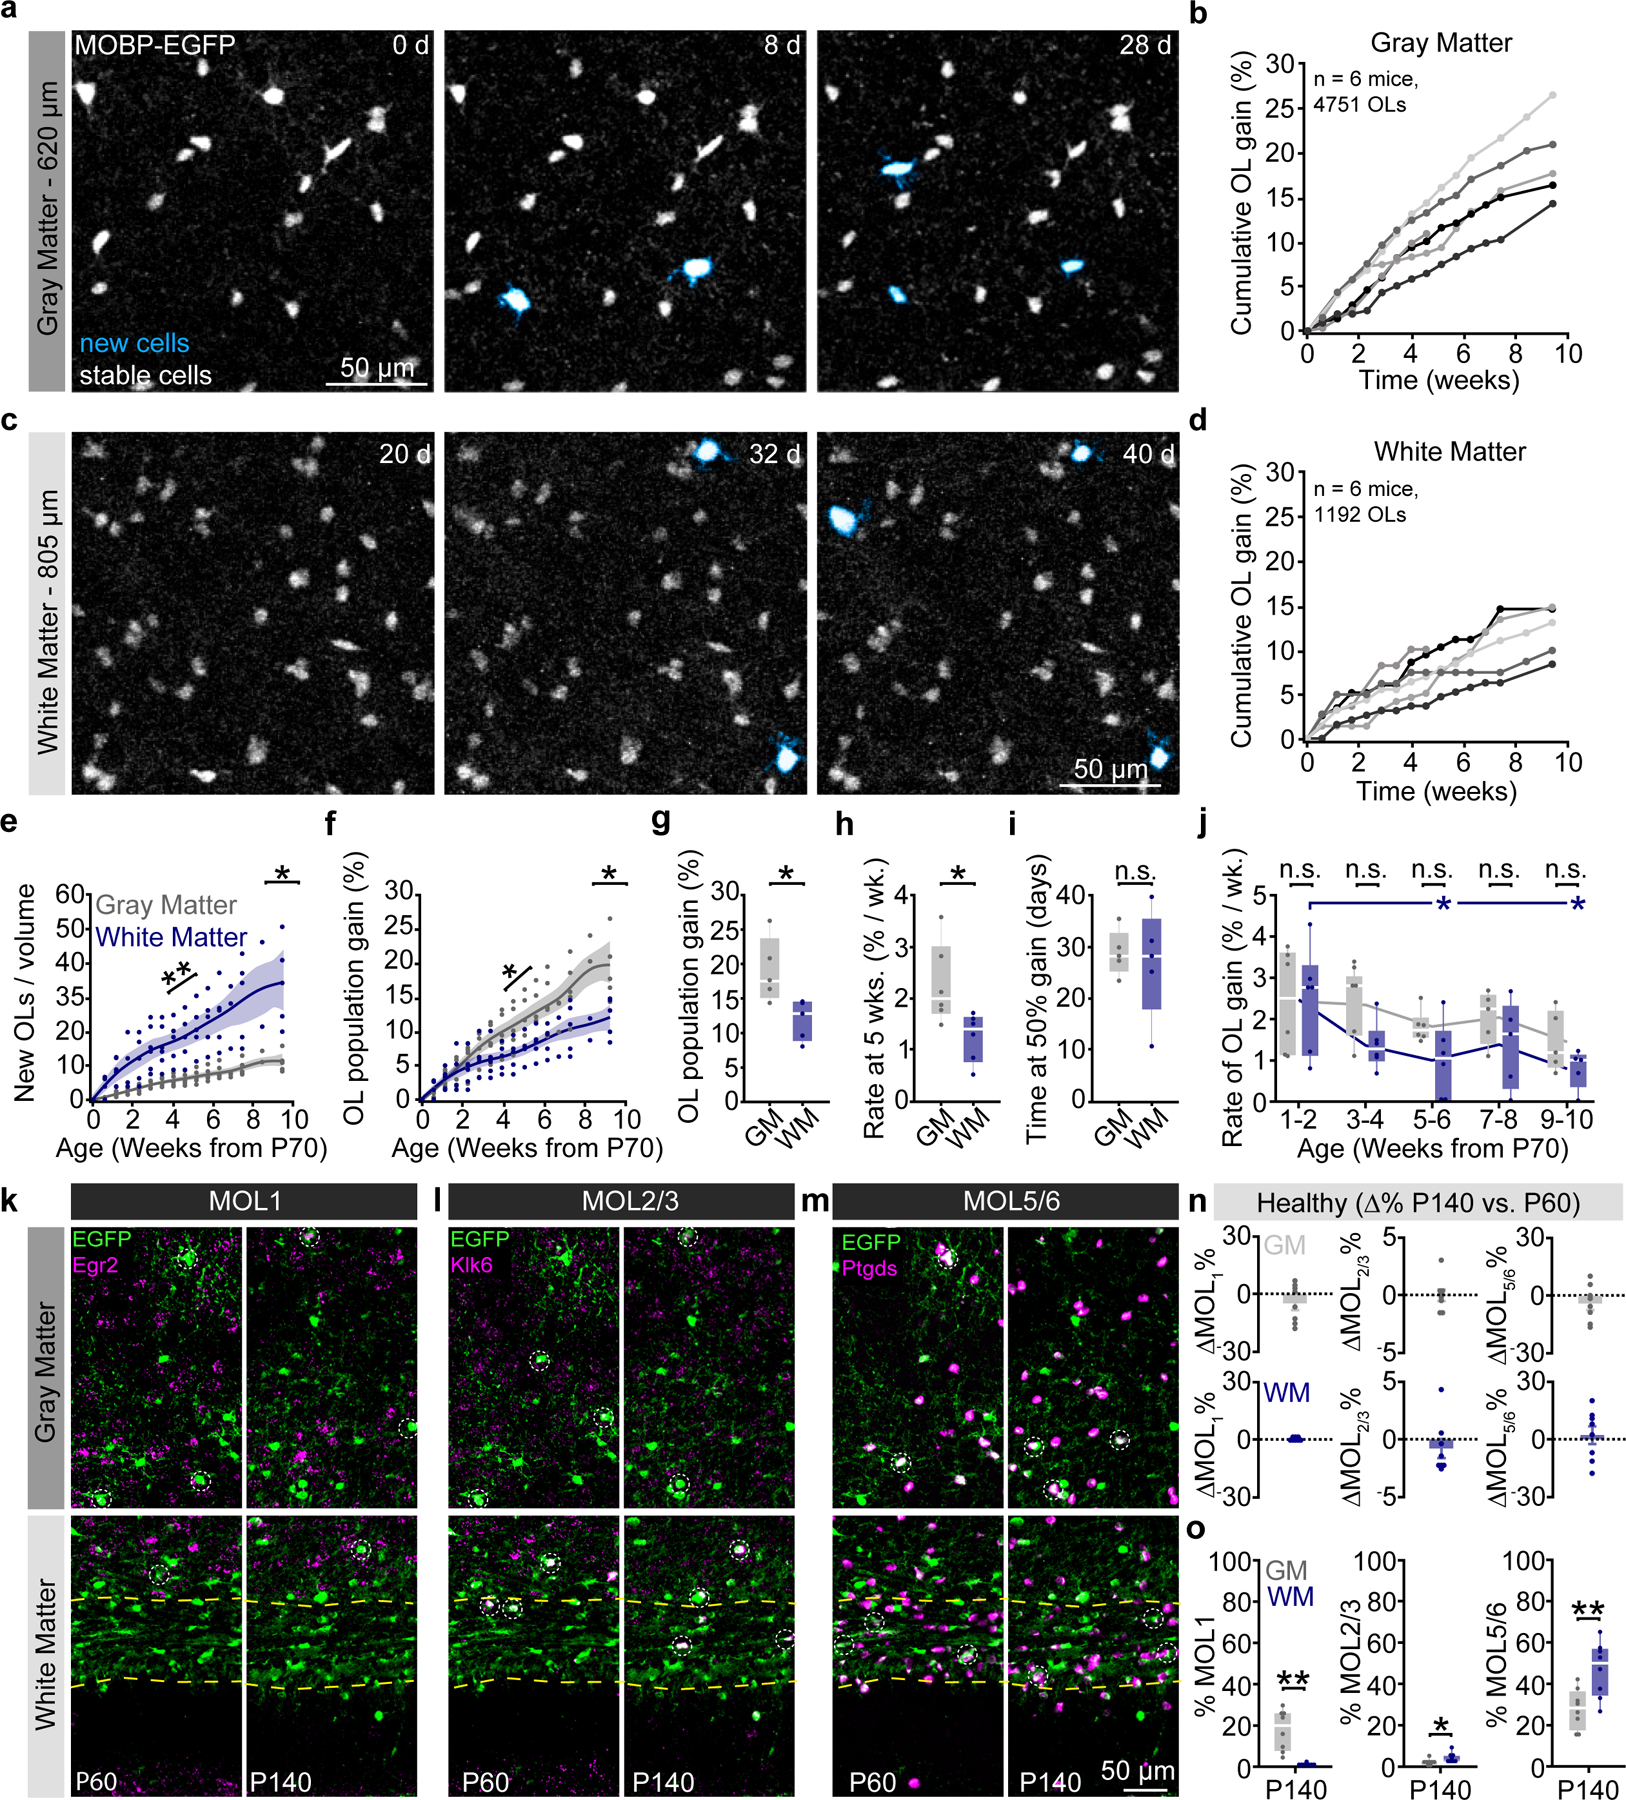
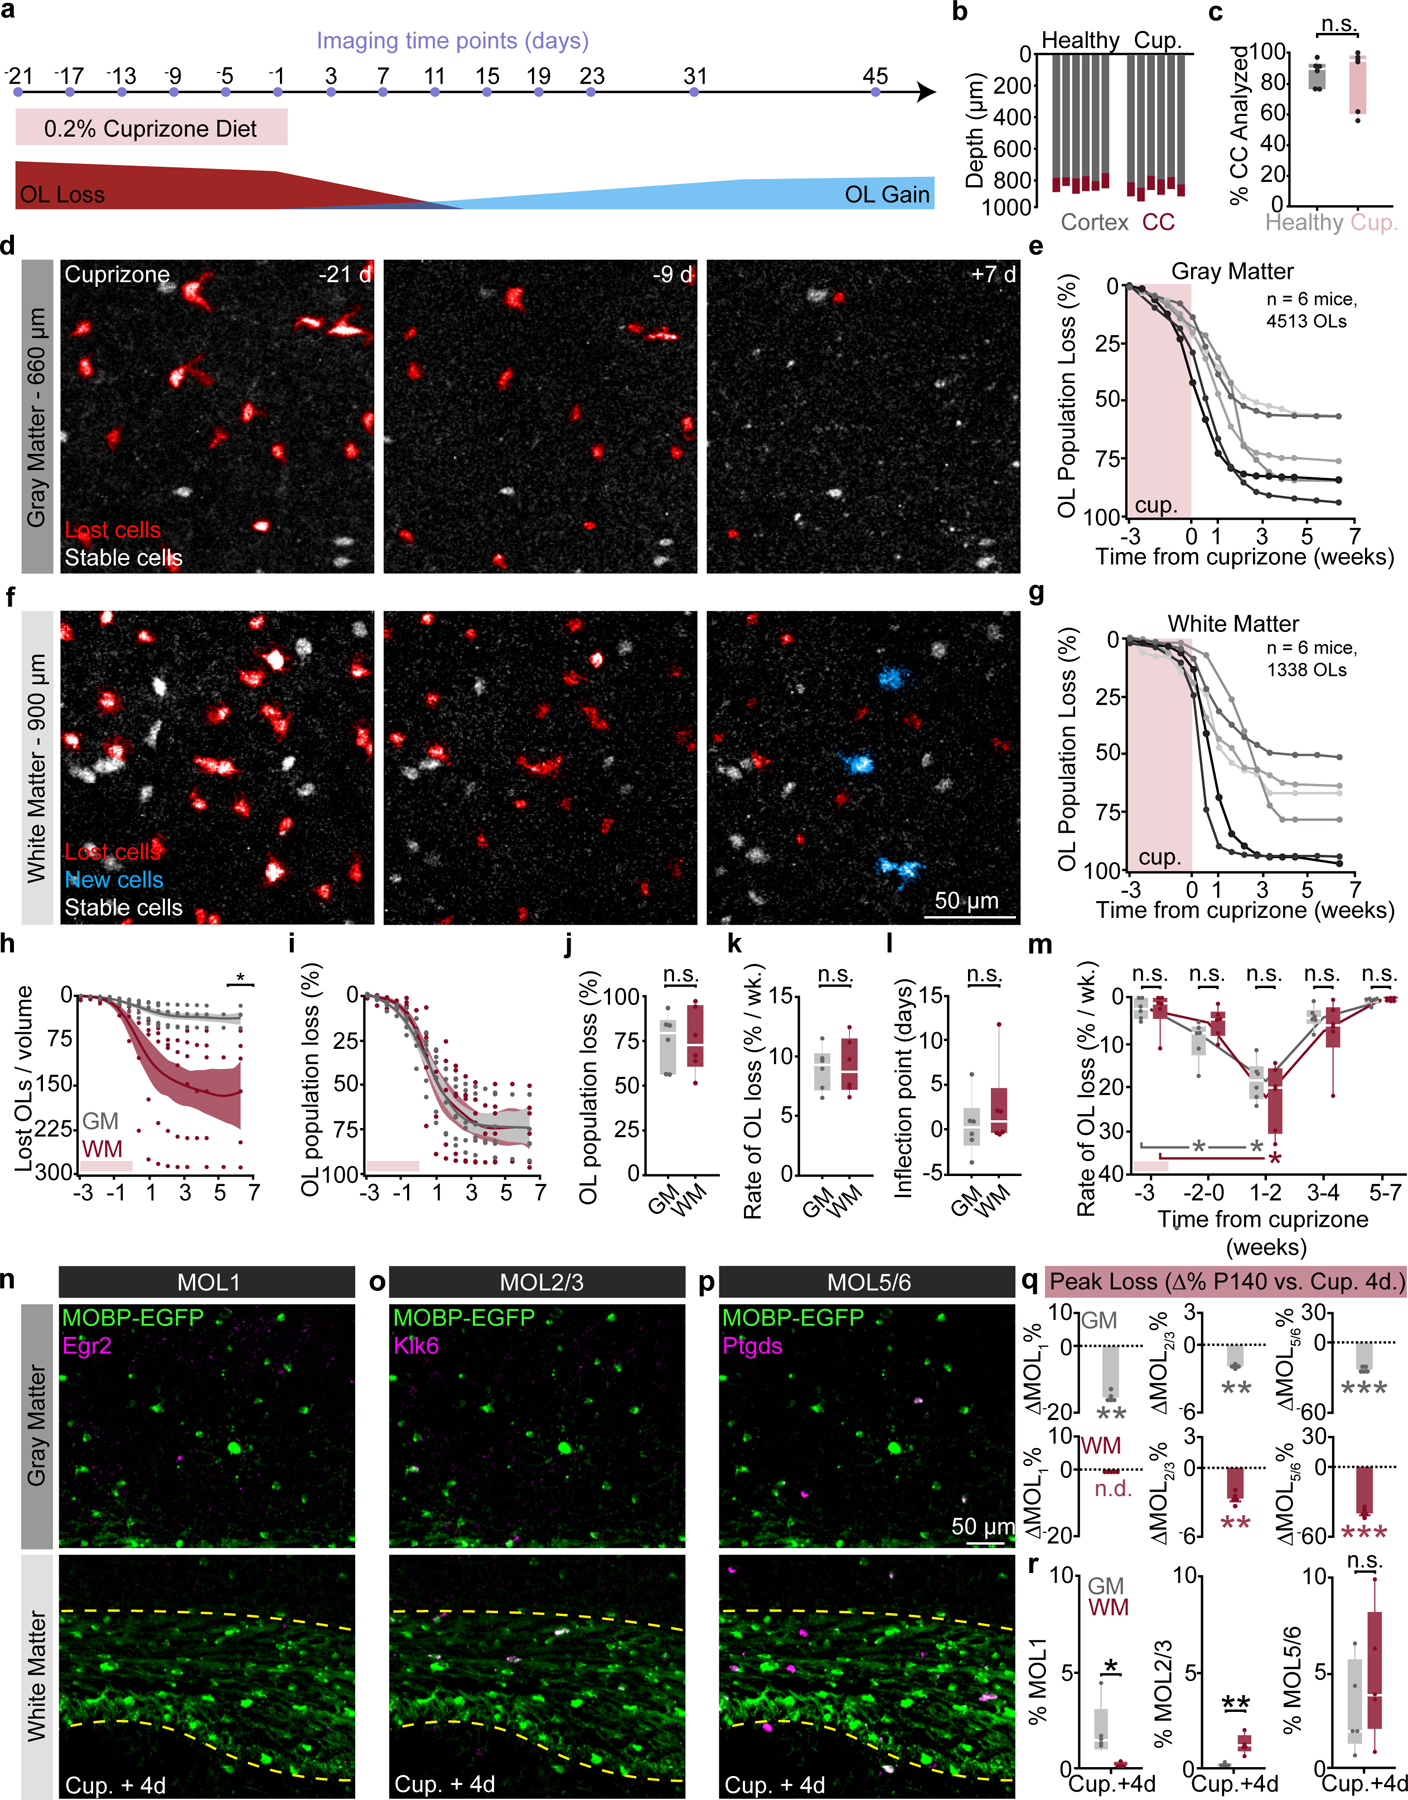
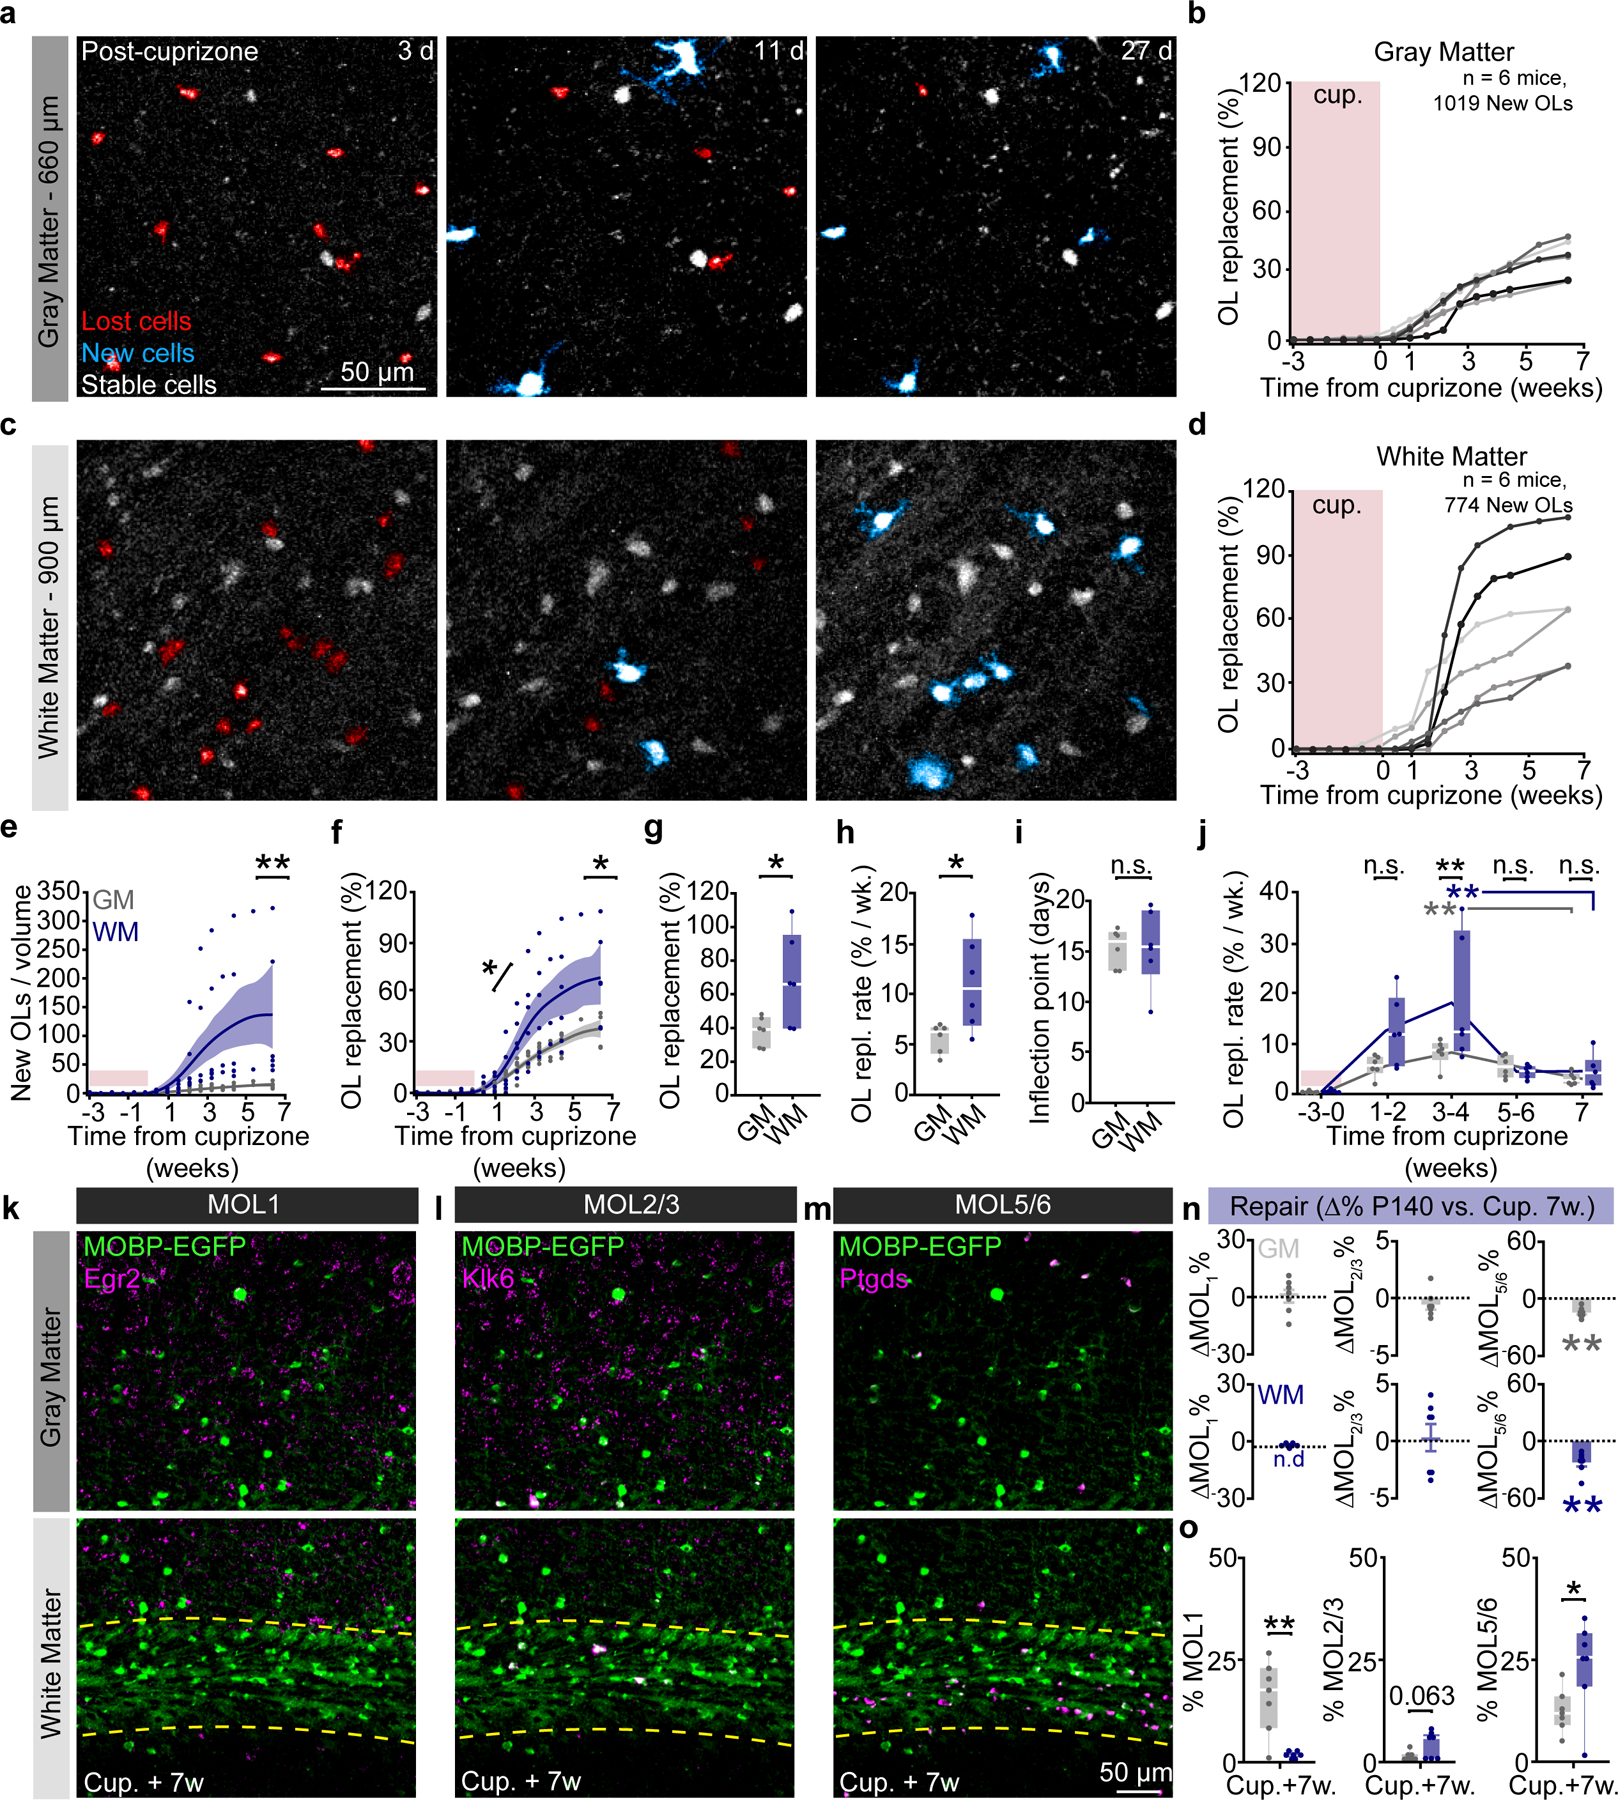
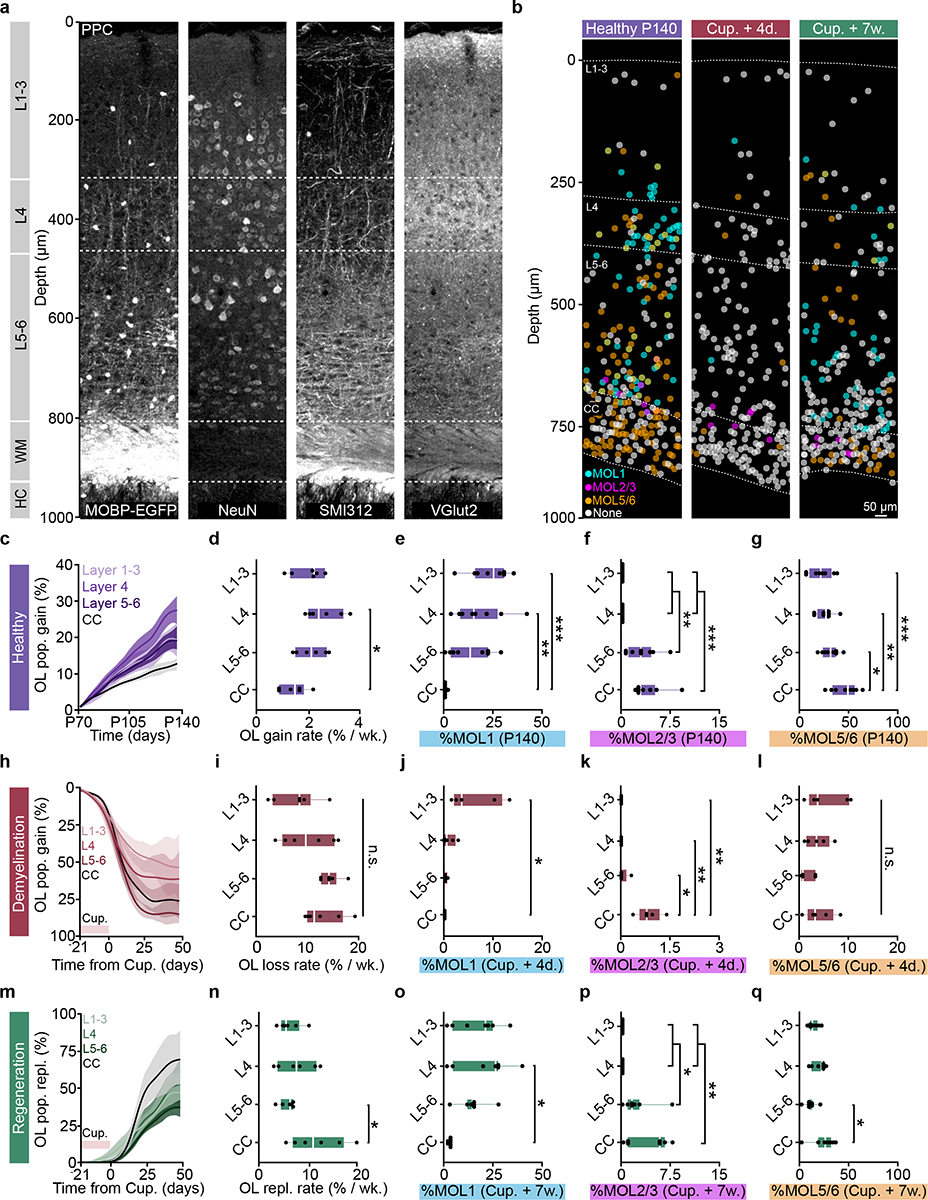
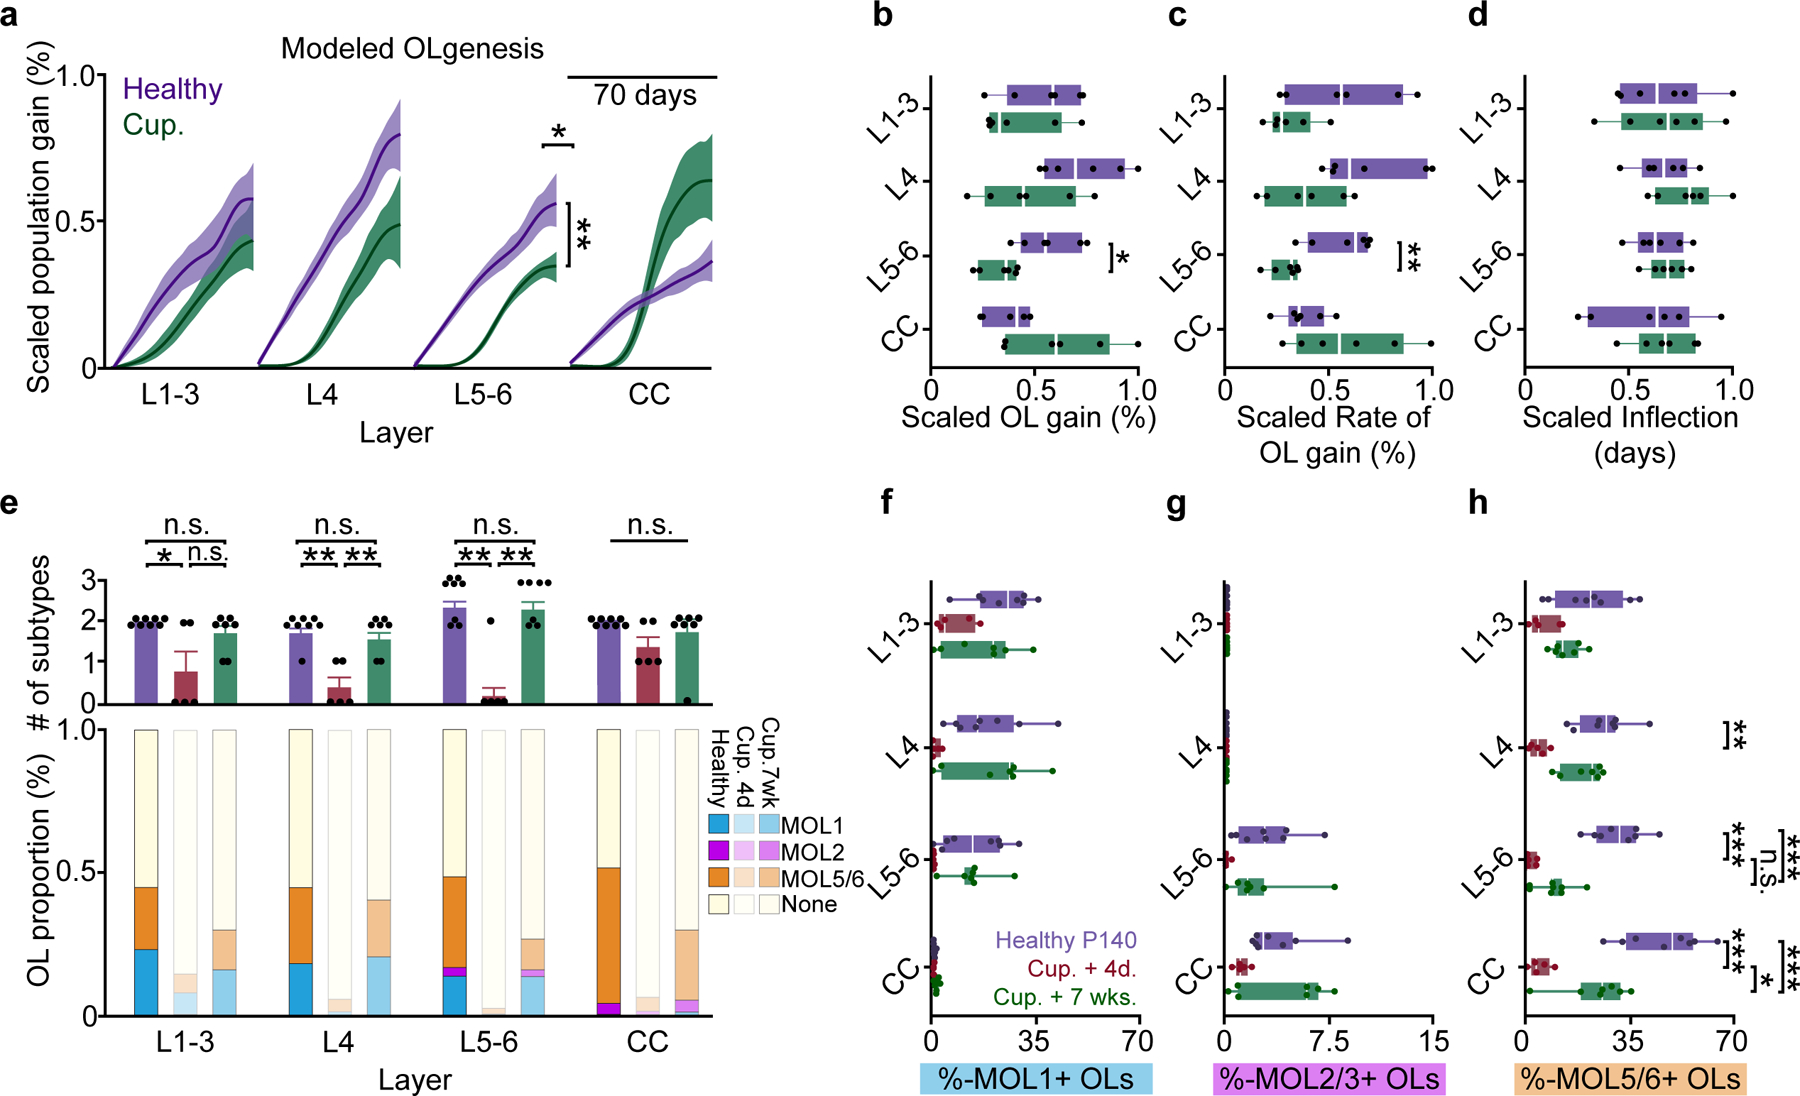
The generation of new myelin-forming oligodendrocytes in the adult central nervous system is critical for cognitive function and regeneration following injury. Oligodendrogenesis varies between gray and white matter regions, suggesting that local cues drive regional differences in myelination and the capacity for regeneration. However, the layer- and region-specific regulation of oligodendrocyte populations is unclear due to the inability to monitor deep brain structures in vivo. Here we harnessed the superior imaging depth of three-photon microscopy to permit long-term, longitudinal in vivo three-photon imaging of the entire cortical column and subcortical white matter in adult mice. We find that cortical oligodendrocyte populations expand at a higher rate in the adult brain than those of the white matter. Following demyelination, oligodendrocyte replacement is enhanced in the white matter, while the deep cortical layers show deficits in regenerative oligodendrogenesis and the restoration of transcriptional heterogeneity. Together, our findings demonstrate that regional microenvironments regulate oligodendrocyte population dynamics and heterogeneity in the healthy and diseased brain.


Conflict of interest statement

Competing Interests

KK is a co-founder and part-owner of 3i. The other authors declare no competing financial interests.

Figures

Extended Data Fig. 1 |
Extended Data Fig. 1 |. Custom three-photon light path and modifications for longitudinal in vivo imaging.
3P excitation source and light path, including motorized half-wave plate for power modulation (λ/2), Glan-Thompson polarizer (GT), dual prism compressor, beam expanding telescope, ALPAO deformable mirror, beam reduction lens relay, galvo-galvo scan mirrors, scan lens, tube lens, dichroic mirror (FF-488-di02, cut at 488 nm), and moveable objective microscope system with collection filters for third harmonic generation signal (430/25 nm, PMT1) and EGFP emission (520/70 nm, PMT2).
Extended Data Fig. 2 |
Extended Data Fig. 2 |. MOBP-EGFP and THG labeling of mature oligodendrocytes and myelin in the cortex and subcortical white matter.
a) Confocal image of a tissue section from the deep posterior parietal cortex stained for transgenic MOBP-EGFP and ASPA. Arrowheads show large, putative newly-generated oligodendrocytes that are MOBP-EGFP-positive and ASPA-negative. b) Confocal image of ASPA/MOBP-EGFP immunofluorescence in the subcortical white matter beneath the posterior parietal cortex (dotted white lines). Arrowheads show MOBP-EGFP-positive and ASPA-negative white matter oligodendrocytes of varying sizes and brightness. c) 99.5% (cortex) and 99.6% (white matter) of ASPA-positive cells express MOBP-EGFP. n = 4 mice, 2 sections per mouse. d) 95.6% (cortex) vs. 86.5% (white matter) of MOBP-EGFP-positive oligodendrocytes were also positive for ASPA (Unpaired, two-tailed Student’s t-test for equal variance, p = 0.016). n = 4 mice, 2 sections per mouse. e) 9 μm z-projection of layer 1 in the posterior parietal cortex showing MOBP-EGFP labeling of myelin sheaths (green) and THG-labeling of myelin sheaths and blood vessels (magenta). f) Zoom image of an isolated EGFP/THG-labeled myelin sheath from the white box in (e) excited with 1300 nm three-photon excitation. g) Isolated MOBP-EGFP sheath from layer 1 of a separate mouse visualized with 920 nm two-photon excitation combined with Spectral Confocal Reflectance (SCoRe) microscopy. Note the decreased THG/SCoRe labeling at putative nodes of Ranvier in (f) and (g) (arrowheads). h) 9 μm z-projection of a single mature oligodendrocyte in layer 1 from a third mouse showing EGFP-labeled processes connected to multiple THG-labeled sheaths. i) 5-pixel line intensity plot from the white line drawn in (d) showing relative fluorescence intensity of EGFP- and THG-labeled myelin sheaths and a THG-labeled blood vessel (arrowhead). All images pixel size = 0.36 μm. *p <0.05, box plots represent the median, interquartile ranges and minimum/maximum values
Extended Data Fig. 3 |
Extended Data Fig. 3 |. Adaptive optics improves SBR and axial resolution in the subcortical white matter.
a) System adaptive optics (AO) correction with a two-dimensional 1.0 μm red polychromatic microsphere sample. Lateral (top) and axial (bottom) projections show a slight enhancement in peak signal after AO correction for system aberrations (8% increase, lateral; 9% increase, axial). The bead sample was diluted 1:10000, coverslipped with Prolong Gold, and the average power at the sample was <0.3 mW. System resolution = 0.88 μm (lateral) and 2.55 μm (axial) as calculated by the full width at half maximum of the gaussian fit after system AO correction. b) Deformable mirror (DM) amplitude plot showing the optimized stroke amplitudes (units = μm RMS) for each Zernike Mode in the system AO correction. c) In vivo, indirect, modal adaptive optics (AO) corrections were made at 775 – 825 μm depth (just above the white matter) by optimizing on the mean intensity of the third harmonic generation channel. The in vivo AO correction revealed cross sections through myelinated axons just dorsal to the corpus callosum (white dotted selection, top, 800 μm) and increased the mean intensity of EGFP-positive oligodendrocytes in the white matter ventral to the plane of the AO correction (bottom, 835 μm). Example images are single-slice images at the depth of the AO correction, 0.14 μm / pixel. d) Deformable mirror (DM) amplitude plot showing the optimized stroke amplitudes (units = μm RMS) for each Zernike Mode in the in vivo AO correction shown in (c). e) (Left) XY (top) and XZ (bottom) projections for a single EGFP-positive OL cell body from the example image shown in (c). (Right) Lateral and axial Gaussian fits of OL cell bodies from the field of view in (c). f) The peak intensity of the EGFP-oligodendrocyte signal was significantly enhanced by the AO correction (Paired, two-tailed Student’s t-test, p = 0.0002, n = 2 mice, 11 cells). g) The axial resolution of EGFP-oligodendrocyte cell bodies was significantly enhanced by the AO correction (Paired, two-tailed Student’s t-test, p = 0.014, n = 2 mice, 11 cells). h) AO correction enhances the peak intensity of OL processes by 202% (n = 2 mice, 4 processes). i) Average power vs. depth plot shows the average power at the sample through the depth of the white matter after AO correction (black, left), and the theoretical power curve (gray, right) necessary to maintain the same signal to background ratio without AO. Data are represented as individual points and mean ± SEM. Curves in a, e, and h represent the mean of the gaussian fits for each analyzed region (cell bodies in a, e, cell processes in h) with 95% confidence intervals. The intensity was integrated over a line plotted through the center of the cell structure (10 μm wide, cell bodies, 1 μm wide, processes). Zernike modes in (b), (d) = Spherical (12), Horizontal Trefoil (9), Horizontal Coma (8), Vertical Coma (7), Oblique Trefoil (6), Astigmatism (5), Oblique Astigmatism (3). For detailed statistics, see Supplementary Table 3.
Extended Data Fig. 4 |
Extended Data Fig. 4 |. Mechanical, scanning, and optical modifications to increase 3P signal and decrease average power.
a) The third harmonic generation (THG) signal at the surface of the cranial window was used to align the preparation orthogonally to the excitation light. b) Scanning modifications to increase SBR and decrease average power to mitigate risk of tissue damage. Frame averaging was advantageous compared to increasing the pixel dwell time to reduce risk of nonlinear damage. Z-stack acquisition was paused periodically to allow for heat dissipation (1 min. pause per 3 min. scanning). Laser pulses were blanked on the galvanometer overscan to reduce the average power applied to the preparation at each z-plane. c) Imaged-based AO correction increased SBR at depth (left) and modulating the spherical aberration correction linearly with depth improved SBR throughout the imaging volume (right). For longitudinal imaging, the AO correction was made before acquiring each time point at the same z-plane just above the scattering white matter (750–850 μm depth).
Extended Data Fig. 5 |
Extended Data Fig. 5 |. Calculation of mouse-specific effective attenuation lengths in the posterior parietal cortex.
a) The mean intensity of the top 1% of the brightest pixels (experimental 3P signal) plotted with depth beneath the brain surface for an example mouse. b) Data from the mouse shown in (a) normalized to the cube of the pulse energy shows the decay of the 3P signal with depth in the mouse brain. c) Logarithm of the data in (b) shows a linear decrease with depth. The single mouse-specific effective attenuation length (EAL) can be calculated from the slope of the linear fit (gray = gray matter, blue = white matter). A steeper slope represents a shorter EAL due to increased scattering. d) Semilogarithmic plot showing gray matter and white matter EALs for n = 10 mice at the first time point of longitudinal imaging. Mean EAL (GM) = 249 +/− 12.7 μm, Mean EAL (WM) = 169 +/− 8.9 μm. e) Distributions of experimental mouse-specific EALs in the gray matter (gray) and white matter (blue). n=10 mice. Linear fits (black line plots in c,d) were calculated separately by region. Box plots represent the median, interquartile ranges and minimum/maximum values.
Extended Data Fig. 6 |
Extended Data Fig. 6 |. Optimized longitudinal three-photon imaging does not increase glial, neuronal, or vascular reactivity.
a) Related to Fig. 3. Coronal brain section from the imaged (right) and contralateral (left) posterior parietal cortex (PPC) of a mouse that was perfused 24 hrs. following 10 weeks of chronic 3P imaging. b) Coronal brain section from the imaged (right) and contralateral (left) posterior parietal cortex (PPC) of a mouse that received supra-threshold excitation across the cortex and white matter to generate laser-induced positive control tissue (laser injury, right). c) High-resolution confocal images of the contralateral (left), longitudinal imaging field (middle) and laser-induced injury (right) regions in the deep cortical layers of the PPC, stained for transgenic MOBP-EGFP expression (mature oligodendrocytes), Iba-1 (microglia), GFAP (reactive astrocytes), 8-hydroxyguanosine (8-OHG, neuronal RNA oxidation), and CD13/Lectin-49 (pericytes, vasculature, respectively). All images were taken with identical power settings, processed with a 100-pixel rolling ball background subtraction and 0.7 pixel gaussian blur, and brightness/contrast correction was applied identically across channels. The bottom row shows an example of the trainable WEKA segmentation to measure pericytes (green) and vascular coverage (magenta, see Methods). Note the Lectin-positive microglia-like cells present in the laser injury vasculature image (white arrowheads). d) No difference in the density of MOBP-EGFP OLs between the contralateral and imaged regions in healthy mice. e) No difference in the density of MOBP-EGFP OLs between the contralateral and imaged regions in laser-induced injury tissue. f) The ratio of the EGFP mean intensity for the imaged:contralateral (contra.) hemispheres was ~1 for healthy mice and did not change significantly in the positive control tissue. g) No difference in the density of Iba-1 microglia (MG) between the contralateral and imaged regions in healthy mice. h) Density of Iba-1 MG is significantly increased on the ipsilateral side of laser-induced injury tissue (p = 0.016). i) The ratio of the imaged:contralateral Iba-1 mean intensity was ~1 for healthy mice and significantly increased in positive controls (p = 0.026). j) No difference in the density of GFAP-positive reactive astrocytes (rAstros) between the contralateral and imaged regions in healthy mice. k) Density of GFAP+ rAstros is significantly increased on the damaged side in laser-induced injury tissue (p = 0.017). l) The ratio of the imaged:contralateral (contra.) GFAP mean intensity was ~1 for healthy mice and was significantly increased in positive controls (p = 0.037). m) No difference in the density of 8-OHG-positive neurons after auto-thresholding (see Methods) between the contralateral and imaged regions in healthy mice. n) No difference in the density of 8-OHG-positive neurons between contralateral and imaged regions in laser-induced injury tissue. o) No difference in the imaged:contralateral ratio of 8-OHG mean intensities between healthy vs. laser-damaged mice. p) No difference in vessel coverage (% positive pixels) between the contralateral and imaged hemispheres of healthy multi-month longitudinal 3P imaging mice. q) Increase in vessel coverage (%) on the ipsilateral hemisphere of laser-induced injury positive control mice (p = 0.022). r) No difference in the density of pericytes between the contra. and ipsi. hemispheres of healthy long-term 3P mice. s) No difference in the density of pericytes between the contra. and ipsi. hemispheres of laser-induced injury mice. *p < 0.05, **p < 0.01, n.s., not significant; n = 5 mice (healthy longitudinal), 5 mice (laser-induced injury), 2 sections, 4 hemispheres per condition. Statistical comparisons in d-e, g-h, j-k, m-n, and p-s were made with paired, two-sided Student’s t-tests (parametric) or two-sided Wilcoxon signed-rank test (nonparametric). Statistical comparisons in f,i,l,o were made with unpaired two-sided Student’s t-tests for equal/unequal variances (parametric) or two-sided Wilcoxon rank sum test (nonparametric). Box plots represent the median, interquartile ranges and minimum/maximum values. For detailed statistics, see Supplementary Table 3.
Extended Data Fig. 7 |
Extended Data Fig. 7 |. Immunofluorescent and in situ hybridization techniques allow for probing OPC proliferation and oligodendrocyte subpopulations in the cortex and subcortical white matter.
a) Experimental timeline of tissue collection for EdU and RNAScope analyses in healthy and cuprizone mice. Healthy MOBP-EGFP mice were injected with 5 mg/kg of the thymidine analog EdU twice a day (10–12 hr. interval) for seven days starting at P70 and perfused the following day. Healthy MOBP-EGFP mice were perfused at P60 and P140 to assess aging-dependent changes in adult oligodendrocyte subpopulations. MOBP-EGFP mice that were fed 0.2% cuprizone for three weeks were perfused at 4 days post-cuprizone removal (peak demyelination, matched to in vivo imaging data, Fig. 4), and 7 weeks post-cuprizone removal (regeneration, matched to the final time point of in vivo imaging, see timeline, Fig. 4). b) EdU-positive proliferated OPCs in the posterior parietal cortex (top, GM) and subcortical white matter (bottom, WM, dashed border). c) The density of PDGFR-α-positive OPCs was significantly increased in the WM compared to the GM (248.6 ± 23.8 vs. 181.2 ± 7.7, Unpaired, two-tailed Student’s t-test for equal variance, t(6) = 2.69, p = 0.036). d) The percentage PDGFR-α+/EdU+ OPCs is increased in the WM compared to the GM (Unpaired, two-tailed Student’s t-test for equal variance, 51.6 ± 6.6 vs. 14.6 ± 2.5, t(6) = 5.29, p = 0.002). e) Coronal sections from the mid-thoracic spinal cord of healthy MOBP-EGFP mice were taken at P140 and run in parallel with brain sections to confirm the labeling specificity of our oligodendrocyte subpopulation probe-set (Egr2, MOL1, cyan; Klk6, MOL2/3, magenta; Ptgds, MOL5/6, orange). f) Egr2 and Ptgds preferentially label oligodendrocytes in the spinal gray matter, while Klk6 predominantly labels oligodendrocytes in the spinal white matter (Unpaired, two-tailed students t-test for unequal variance). g) Coronal sections from the posterior parietal cortex of MOBP-EGFP mice (−1.7 to −2.3 mm posterior and 1 to 3 mm lateral to bregma) showing the pattern of OL subpopulation labeling at the experimental time points described in (a). *p < 0.05, **p<0.01, n = 4 mice, 4 sections per mouse. Boxplots represent the median, interquartile range and the minimum and maximum values. For detailed statistics, see Supplementary Table 3.
Extended Data Fig. 8 |
Extended Data Fig. 8 |. Modeling oligodendrocyte growth, loss, and regeneration in adult mouse cortex and white matter.
a-b) Cumulative oligodendrocyte population growth (% gain over time) in the healthy brain was modeled using asymptote-restricted exponential mechanistic growth curve-fitting. a) Cumulative OL gain (%) and mechanistic growth fit in the gray matter (left) and the white matter (right) for an example mouse. b) Cumulative OL gain (%) and mechanistic growth fits in the gray matter (left) and the white matter (right) for the healthy group (n = 6 mice). c-d) Cumulative oligodendrocyte population loss (% loss over time) due to cuprizone administration was modeled using three-parameter Gompertz Sigmoid curve-fitting. c) Cumulative OL loss (%) and three-parameter Gompertz curves in the gray matter (left) and the white matter (right) for an example mouse. d) Cumulative OL loss (%) and three-parameter Gompertz curves in the gray matter (left) and the white matter (right) for the cuprizone de/remyelination group (n = 6 mice). e-f) Cumulative oligodendrocyte population regeneration (% cell replacement over time) following cuprizone cessation was modeled using three-parameter Gompertz Sigmoid curve-fitting. e) Cumulative OL replacement (%) and three-parameter Gompertz curves in the gray matter (left) and the white matter (right) for an example mouse. f) Cumulative OL replacement (%) and three-paramter Gompertz curves in the gray matter (left) and the white matter (right) for the cuprizone de/remyelination group (n = 6 mice). Modeled rate and timing metrics in Main Figs. 4–7 were calculated by fitting curves to data from individual mice and then extracting summary data (e.g. timing of inflection point).
Extended Data Figure 9 |
Extended Data Figure 9 |. Layer and region-dependent proportions of MOL1, MOL2/3, and MOL5/6 across healthy aging and cuprizone treatment.
Related to Figs. 7,8. Raw counts of the total # of segmented MOBP-EGFP OLs (top), MOL1+ OLs (row 2), MOL2/3+ OLs (row 3) and MOL5/6+ OLs (bottom) across cortical and subcortical layers (x-axes) and experimental time points (shaded background colors). Data are from n=6 mice (Healthy P60), n=8 mice (Healthy P140), n=5 mice (Cup. + 4 days) and n=7 mice (Cup. + 7 weeks), 2 sections per mouse. Bar graphs represent the mean+/−SEM. Data presented in the main figures were expressed either as the percentage of total OLs for each probe (Figs. 7–8), or the change in proportion of each marker from the healthy P140 time point (Figs. 4–6).
Extended Data Figure 10 |
Extended Data Figure 10 |. Layer-dependent differences in the temporal dynamics of cuprizone induced loss and regeneration.
a-e) Related to Fig. 7. a) OL population replacement (%) plotted over weekly time bins following cuprizone cessation for each anatomically defined region. Replacement rate is increased from healthy baseline from 2–4 weeks post-cuprizone in L1–3 and CC, and 3–4 weeks post-cuprizone in L4 and L5/6 (Kruskal-Wallis test followed by Steel method for comparison with control, p = 0.034 for L1–3, Weeks 2–4 vs. Healthy; p = 0.034 for L4 Weeks 3–4 vs. Healthy; p = 0.034 for L5–6, Weeks 3–4 vs. Healthy; p = 0.034 for CC Weeks 2–4 vs. Healthy). n=6 mice (cuprizone), 2 mice were imaged at an extra time point during Week 6. b) First-derivative of the modeled growth curves for healthy baseline and OL replacement (Mechanistic Growth, Gompertz 3P, respectively) showing the response duration of regeneration across regions. c) The regeneration response duration, calculated as the full width at half maximum of the rate curves in (b), is significantly longer in the superficial layers 1–3 compared to the CC (One-way ANOVA followed by Tukey’s HSD, p = 0.048). d) The magnitude of the regeneration response, as calculated by the area under the curve above the healthy baseline rate, is significantly suppressed in L5–6 compared to the CC (One-way ANOVA followed by Tukey’s HSD, p = 0.037). e-f) No significant differences in the duration or magnitude of the cuprizone cell loss response across regions. Data in (a) were calculated based on the raw % change in cell population from baseline. Data in b-f were derived from the modeled and scaled growth curves. n = 6 mice (cuprizone), n=6 mice (healthy). *p < 0.05, **p < 0.01, n.s. = not significant; for growth curves, cubic splines approximate the measure of center and error bars are 95% confidence intervals; box plots represent the median, interquartile ranges and minimum/maximum values. For detailed statistics, see Supplementary Table 3.
Figure 1 |
Figure 1 |. Three-photon microscopy enhances the detection of oligodendrocytes and myelin deep in the adult mouse brain.
a) xz projection of a 2-photon z stack of oligodendrocytes and myelin in a high-quality chronic cranial window acquired with the Olympus 25X objective. Power was modulated from 8–160 mW. b) xz projection of a 3-photon z stack of MOBP-EGFP and third harmonic generation (THG) signal shows high SBR through the PPC, subcortical corpus callosum (CC), and the alveus of the hippocampus. The average power at the sample was modulated from 0 – 45 mW. c) Two-photon (2P) SBR of oligodendrocyte cell bodies is significantly increased in the superficial 100 μm of cortex compared to three-photon (3P, unpaired, two-tailed Student’s t-test, t(6) = −2.45, p = 0.043), while 3P imaging at depths greater than 400 μm has enhanced SBR (unpaired, two-tailed Student’s t-test, t(6) = 2.92, p = 0.027 (401 – 500 μm), t(6) = 4.72, p = 0.003 (501 – 600 μm), t(3.07) = 4.41, p = 0.021 (601 – 700 μm). d) 2P and 3P allow for the detection of similar numbers of oligodendrocytes in layers 1–4, yet significantly fewer cells are detected with 2P in layer 5 (unpaired, two-tailed t-test, t(10)=2.29, p=0.045). e) Stacked bar chart showing the cortical (gray) and total (blue) imaging depth across the PPC for n=7 mice at 10 weeks of age. f) The corpus callosum (CC) can be differentiated from the alveus by the orientation of THG-positive fibers (t(5.57)=−3.24, p=0.026) for n=6 mice. *p < 0.05, **p < 0.01, n.s., not significant; For growth curves, cubic splines approximate the measure of center and the error bars are 95% confidence intervals, bar plots represent mean±SEM, box plots represent the median, interquartile ranges and minimum/maximum values. For detailed statistics, see Supplementary Table 3.
Figure 2 |
Figure 2 |. Optimization of excitation parameters permits long-term three-photon microscopy without tissue damage.
a) Example imaging time points from a mouse exposed to 2.7 nJ pulse energy at the focus. Dotted circle represents the area of the lesion as defined by an increase in THG intensity; white arrowhead shows a newly-generated OL in response to cell ablation. Depth of lesion=594 – 786 μm. b) Cumulative OL population cell loss (%) and cell gain (%) in lesioned regions shows rapid OL cell death that proceeded for up to 40 days following the tissue damage. OL regeneration was rapid and biphasic for lesion 1 (black) but delayed by ~20 days and linear for lesions 2 and 3. Mean OL population loss was 32.9±5.2 %; Mean replacement of the lost OLs was 50.0±16.9%; Mean z-width of the lesions was 149±26.1 μm (mean±SEM). c) Mean intensity of the THG signal over time in the lesion area aligned to the time point of max intensity change for n=3 lesioned mice. d) Similar exponential power vs. depth curves were applied at all time points in lesioned vs. healthy mice that underwent long-term 3P imaging. The excitation laser was blanked on the galvanometer overscan. e) The pulse energy at the focus vs. z-depth was determined for each mouse by calculating the EAL at the first time point. Mouse-specific differences in cortical EAL, and not average power (d), drove the increase in excitation that caused cellular damage. The minimum damage threshold was 2.7 nJ at the focus (red dotted line). Healthy imaged mice had a mean pulse energy at the focus of less than 2 nJ across the cortical depth (cyan). f) Example imaging time points from a healthy mouse with optimized settings and ~1.4 nJ excitation at the focus across the cortex. Note the detection of new oligodendrocytes (white dotted circles) without cell death or changes in THG intensity. For THG, power, and pulse energy curves, cubic splines approximate the measure of center and the error bars are95% confidence intervals. Data in (d-e) are from n=3 mice (Lesioned) and n=10 mice (Healthy long-term imaging).
Figure 3 |
Figure 3 |. Long-term three-photon imaging does not perturb damage markers or oligodendrogenesis.
a) Coronal brain section from the imaged (right) and contralateral (left) PPC of a mouse perfused 24 hrs. following long-term 3P imaging (top) stained for MOBP-EGFP, HSP70/72 and gamma-H2ax. Brain section from the imaged and contralateral PPC of a mouse that received volumetric supra-threshold excitation to generate positive control tissue (bottom). b) Power vs. Depth curves for long-term imaging (black) vs. laser-damaged positive control tissue (magenta). c) OL segmentation and cell-specific intensity analyses. d) Images of the contralateral (left), imaged (middle) and laser-induced injury (right) regions in layer 5/6 of the PPC of MOBP-EGFP mice, stained for heat shock proteins 70/72 (top, HSP70/72, thermal damage), and phosphorylated—H2A.X (bottom, gamma-H2A.X, DNA double-strand breaks). e) No difference in HSP70/72–positive OL density between contralateral and ipsilateral hemispheres of healthy mice that underwent optimized, long-term 3P imaging. f) Increased HSP70/72–positive OL density on the ipsilateral side following laser injury (p=0.041). g) The ratio of the imaged:contralateral HSP70/72 mean intensities was increased after laser damage (p=0.037). h) No difference in λH2a.X–positive OL density between the contralateral and imaged hemispheres of healthy 3P mice. i) No difference in λH2a.X-positive OL density between the hemispheres after laser-induced injury tissue. j) No difference in the ratio of the ipsilateral:contralateral λH2a.X mean intensities in either condition. k) Longitudinal imaging of oligodendrogenesis in layer 2/3 with 2P (top, orange) and 3P (bottom, blue). l) Comparison of oligodendrogenesis in the healthy PPC with standard 2P vs. optimized 3P. No differences in OL gain between imaging modalities. m) 3P imaging does not increase mature OL death. L1–3 represents ~0–340 μm depth; L4-CC represents ~341–1000 μm depth. Data in (d-j), n=5 mice per group, (k-l), n=4 mice (3P) and n=5 mice (2P). *p < 0.05, n.s., not significant; for growth curves, cubic splines approximate the measure of center and error bars are 95% confidence intervals, box plots represent the median, interquartile ranges and minimum/maximum values. Data in (f) were compared with two-sided paired Student’s t-test, (g) two-sided Wilcoxon rank sum test; For detailed statistics, see Supplementary Table 3.
Figure 4 |
Figure 4 |. Region-specific differences in oligodendrogenesis correlate with transcriptional heterogeneity.
a) Oligodendrogenesis (cyan) over 4 weeks in layer 5 of the PPC. b) Cumulative OL gain curves for individual mice in the entire depth of the GM. c) Oligodendrogenesis (cyan) from weeks 3–6 in the dorsal corpus callosum. d) Cumulative OL gain curves for individual mice in the WM. e) The WM gained substantially more OLs per imaging volume at a faster rate than the GM (p=0.013 for total gain at 66d; p=0.005 for mean rate). f) The GM population experienced greater percentage growth than the WM. Significance asterisks refer to data in (g) and (h). g) Total population gain was increased in the GM vs. the WM (p=0.022). h) The rate of OL gain during the fifth week of imaging (~P100) was increased in the GM vs. WM (p=0.020). i) The time at half-maximum of the mechanistic growth curves did not differ between GM and WM. j) The rate of WM population gain decreased more rapidly with age than in the GM (p=0.037, Weeks 5–6 vs. 1–2; p=0.022, Weeks 9–10 vs. 1–2). k-m) Images of MOL1+ (EGFP/Egr1+), MOL2/3+ (EGFP/Klk6+), and MOL5/6+ (EGFP/Ptgds+) oligodendrocyte populations in the PPC and WM at P60 (left) and P140 (right). n) No age-related changes in the population proportions of OL subtypes between P60 and P140. o) Differences in transcriptional heterogeneity between the GM and WM. MOL1+ OLs represented a higher proportion of the OL population in the GM vs. WM (p=0.002), while MOL2 and MOL5/6-OLs were more abundant in the WM (p=0.018, MOL2/3; p=0.005, MOL5/6). Data in h,i were calculated from the mechanistic growth curves. Data in a–f,h,j represent n=6 mice / group, g,i, n=5 mice, n–o represent n=6 mice (P60) and n=8 mice (P140), two sections per mouse. *p<0.05, **p<0.01, n.s., not significant; for growth curves, cubic splines approximate the measure of center and error bars are 95% confidence intervals; box plots represent the median, interquartile ranges and the minimum/maximum values. Line plots connect the mean at each time point. Statistical tests were unpaired, two-sided Student’s t-tests for equal or unequal variance (e,g,h,o), Dunnett’s multiple comparisons with control (j), or two-sided Wilcoxon rank sum (o). For detailed statistics, see Supplementary Table 3.
Figure 5 |
Figure 5 |. Cuprizone affects gray and white matter oligodendrocyte populations similarly.
a) 3P imaging timeline to track cuprizone-induced OL loss and gain. b) Depth of PPC and subcortical WM that was imaged over 66 days. c) Percentage of the corpus callosum that was imaged/ analyzed longitudinally did not differ by group. d) Time series of cuprizone-mediated OL loss in the deep cortex. e) Cumulative OL loss (%) over time in the GM for individual mice. f) Time series of cuprizone-mediated OL loss in the WM. g) Cumulative OL loss (%) over time in the WM for individual mice. h) The number of OLs lost per 350×350×60μm imaging volume was lower in the GM vs. WM (p=0.024). i) OL population loss dynamics are similar across regions. j) No difference in the total % loss for the GM vs. WM. k) No difference in the rate of % loss for the GM vs. WM. l) No difference in the inflection point of the population loss curve. m) The rate of GM and WM population loss, binned by 2–3 week intervals. No differences between the GM and WM at each time point. OL loss increased earlier in the GM vs. WM (p=0.018, Weeks 2–0 vs. 3 GM; p=0.018, Weeks 1–2 vs. 3 GM; p=0.018, Weeks 1–2 vs. 3, WM). n-p) Images of the distribution of MOL1, MOL2/3, and MOL5/6 subpopulations in the PPC and WM at 4-days post-cuprizone. q) Cuprizone reduced expression of all three markers in both regions (Healthy P140 to Cup.+4d; p=0.007, MOL1-GM; p=0.038, MOL1-WM; p=0.004, MOL2/3-GM; p=0.004, MOL2/3-WM; p=0.0001, MOL5/6-GM; p<0.0001, MOL5/6-WM). r) GM vs. WM transcriptional heterogeneity at four days post-cuprizone (MOL1, p=0.011; MOL2/3, p=0.0097; MOL5/6, n.s.). Data in k,l were calculated from the Gompertz curve parameters. Data in a-m represent n=6 mice/group, q-r represent n=5 mice (Cup. +4d) and n=8 mice (Healthy P140), two sections per mouse. *p<0.05, **p<0.01, ***p<0.001, n.s., not significant; for growth curves, cubic splines approximate the measure of center and error bars are 95% confidence intervals, box plots represent the median, interquartile ranges and the minimum/maximum values; Line plots connect the mean at each time point. Statistical tests were unpaired, two-sided Student’s t-tests for equal/unequal variance (h,j,k,q), Steel multiple comparisons with control (m) or two-sided Wilcoxon rank sum (l,q,r). For detailed statistics, see Supplementary Table 3.
Figure 6 |
Figure 6 |. Oligodendrocyte replacement is enhanced in the white matter and partially restores regional heterogeneity.
a) Timelapse of 24-day period after cuprizone cessation showing OL loss (red), followed by OL regeneration (cyan) in the deep PPC. b) Cumulative OL replacement (%-gain normalized to %-loss) across the cortex for individual mice. c) Same time points and mouse as in (a) in the corpus callosum. d) Cumulative OL replacement for individual mice in the WM. e) Density of newly-generated OLs was increased in the WM vs. GM (p=0.005). Note the high variability without normalization to OL loss. f) Cumulative OL replacement over time in WM vs. GM. Significance asterisks represent data in (g) and (h). g) OL replacement (%) is significantly increased at 45 days post-cuprizone in the WM (p=0.043). h) Rate of replacement is enhanced in the WM vs. GM (p=0.043). i) No difference in the timing of OL replacement between GM and WM. j) The rate of GM and WM population replacement binned by 1–3-week intervals with respect to cuprizone treatment. OL replacement rate is increased in the WM vs. GM at 3–4-weeks post-cuprizone (p=0.0009, black asterisks). Both the WM and the GM are significantly increased at the 3–4-week phase compared to the 7-week plateau phase (p=0.002, Weeks 3–4 vs. 7, GM; p=0.0052 Weeks 3–4 vs. 7, WM). k-m) Images of the distribution of MOL1, MOL2/3, and MOL5/6 OL populations in the PPC and WM at 7 weeks post-cuprizone. n) Change in the population proportions from healthy P140 to 7 weeks post-cuprizone (p=0.003, MOL5/6 GM; p=0.007, MOL5/6 WM). o) GM vs. WM differences in transcriptional heterogeneity 7-weeks post-cuprizone (p=0.005, MOL1; p=0.063, MOL2/3; p=0.032, MOL5/6) Data in h,i were calculated from the parameters of the Gompertz growth curves. Data in a-j represent n=6 mice per group, n-o represent n=7 mice (Cup.+7w.) and n=8 mice (Healthy P140), two sections per mouse. *p<0.05, **p<0.01, n.s., not significant; for growth curves, cubic splines approximate the measure of center and error bars are 95% confidence intervals; box plots represent the median, interquartile ranges and minimum/maximum values; line plots connect the mean at each time point. Statistical tests were unpaired, two-sided Student’s t-tests for equal or unequal variance (g, h, n, o), Dunnett’s multiple comparisons with control (within-groups, j), Two-way ANOVA with Bonferroni correction for piecewise multiple comparisons (between-groups, j) and two-sided Wilcoxon rank sum (e, n). For detailed statistics, see Supplementary Table 3.
Figure 7 |
Figure 7 |. Layer-specific differences in oligodendrogenesis correlate with changes in molecular heterogeneity.
a) Myelo-, neuronal, axonal, and thalamic input architecture of the PPC and subcortical WM. Note the Vglut2-positive layer 4.b) Spatial map of MOL1 (cyan), MOL2/3(magenta), and MOL5/6 (orange) OLs across the PPC and WM at P140, four days, and seven weeks post-cuprizone removal (4 d.p.c., 7 w.p.c.) ~50% of the OLs did not express any of the markers (None, gray). c) Healthy OL growth curves plotted by sub-region across the cortical and subcortical depth. d) Layer-specific differences in healthy oligodendrogenesis (p=0.012). e) Layer-specific differences in the percentage of OLs expressing Egr1 (p=0.0004, L1–3 vs. CC; p=0.006, L4 vs. CC). f) Layer-specific differences in the percentage of OLs expressing Klk6 (p=0.0034, L4 vs. L5–6; p=0.0034, L1–3 vs. L5–6; p=0.0009, L4 vs. CC; p=0.0009, L5–6 vs. CC). g) Layer-specific differences in the percentage of OLs expressing Ptgds (p=0.042, L5–6 vs. CC; p=0.005, L4 vs. CC; p=0.0005, L1–3 vs. CC). h) OL loss curves plotted by subregion across the cortical and subcortical depth. i) No layer-specific differences in cuprizone loss rate. Note increased variability of demyelination in L1–4. j) Layer-specific differences in MOL1 at 4 d.p.c. (p=0.016). k) Layer-specific differences in MOL2/3 at 4 d.p.c. (p=0.022, L5–6 vs. CC; p=0.004, L4 vs. CC; p=0.004, L1–3 vs. CC). l) No layer-specific differences for MOL5/6 at 4 d.p.c.. m) OL replacement curves plotted by sub-region. n) OL replacement is decreased specifically in L5–6 vs. CC (p=0.035). o) Layer-specific differences in MOL1 at 7 w.p.c. (p=0.012). p) Layer-specific differences in MOL2/3 at 7 w.p.c. (p=0.025, L1–3 vs. L5–6; p=0.025, L4 vs. L5–6; p=0.003, L1–3 vs. CC; p=0.003, L4 vs. CC). q) Layer-specific differences in MOL5/6 at 7 w.p.c. (p=0.015). Data in c,d,h,I,m,n represent n=6 mice per group, data in e-g n=8 mice, 2 sections per mouse, data in j-l n=5 mice, 2 sections per mouse, o-q n=7 mice, 2 sections per mouse. *p<0.05, **p<0.01, ***p<0.001, n.s., not significant. For growth curves, cubic splines approximate the measure of center and error bars are 95% confidence intervals, box plots represent the median, interquartile ranges and minimum/maximum values. Statistical tests were One-way ANOVA with Tukey’s HSD (d, e, g, n, o, q) or Kruskal-Wallis with Dunn’s test for multiple comparisons (f, j, k, p). For detailed statistics, see Supplementary Table 3.
Figure 8 |
Figure 8 |. Decreased oligodendrogenesis and recovery of molecular identity in deep layers 5–6.
a) Modeled growth curves plotted by cortical sub-region and scaled to the maximum % gain or replacement to enable comparisons of healthy vs. regenerative oligodendrogenesis. Significance asterisks are related to data in (b–c). b) Decrease in scaled oligodendrogenesis in L5–6 post-cuprizone vs. healthy baseline, p=0.006). c) Decrease in scaled oligodendrogenesis rate in L5/6 after cuprizone (p=0.0025) d) No differences in scaled inflection points across regions. e) (Top) Differences in the number of molecular subpopulations represented at Healthy P140, Cup. +4d. and Cup. +7wk.time points (Bottom) Stacked bar chart showing changes in the relative proportion of MOL1, MOL2/3 and MOL5/6 OLs at 7-weeks post-cuprizone treatment. f) No differences in the MOL1-positive OL proportions within individual cortical layers across experimental time points. g) No differences in the MOL2/3-positive proportions within individual cortical layers across experimental time points. h) Differences in the MOL5/6 proportions within cortical layers across experimental time points (Healthy P140 (purple) vs. Cup. +4 days (red); p=0.001, L4; p=0.0001, L5–6; p=0.0001, CC). The proportion of MOL5/6 OLs returned at 7 weeks post-cuprizone only in the CC (Cup.+4d (red) vs. Cup.+7w (green), p=0.012). The MOL5/6 OL proportion returned to Healthy P140 levels in layers 1–4 but remained relatively decreased in L5–6 and the CC (Healthy P140 (purple) vs. Cup.+7wks. (green), p=0.0007, L5–6; p=0.001, CC). Data in a-d represent n=6 mice per group, data in e-h represent n=8 mice, 2 sections per mouse (P140), n=5 mice, 2 sections per mouse (Cup.+4d.) and, n=7 mice, 2 sections per mouse (Cup.+7wks.).*p<0.05, **p<0.01,***p<0.001, n.s., not significant; For growth curves, cubic splines approximate the measure of center and error bars are 95% confidence intervals, box plots represent the median, interquartile ranges and minimum/maximum values, bar plots are mean±SEM. Statistical tests were Two-way ANOVA with Bonferroni correction (between-groups comparisons, ad), Two-way ANOVA with Tukey’s HSD (all comparisons, f-h), and Kruskal-Wallis with Dunn’s test for joint ranks (e). For detailed statistics, see Supplementary Table 3.

Update of

References

    1. Flechsig Of Leipsic, P. DEVELOPMENTAL (MYELOGENETIC) LOCALISATION OF THE CEREBRAL CORTEX IN THE HUMAN SUBJECT. The Lancet 158, 1027–1030 (1901).
    1. Spitzer SO et al. Oligodendrocyte Progenitor Cells Become Regionally Diverse and Heterogeneous with Age. Neuron 101, 459–471.e5 (2019). - PMC - PubMed
    1. Dimou L, Simon C, Kirchhoff F, Takebayashi H & Götz M Progeny of Olig2-Expressing Progenitors in the Gray and White Matter of the Adult Mouse Cerebral Cortex. J. Neurosci 28, 10434–10442 (2008). - PMC - PubMed
    1. Kang SH, Fukaya M, Yang JK, Rothstein JD & Bergles DE NG2+ CNS Glial Progenitors Remain Committed to the Oligodendrocyte Lineage in Postnatal Life and following Neurodegeneration. Neuron 68, 668–681 (2010). - PMC - PubMed
    1. Viganò F, Möbius W, Götz M & Dimou L Transplantation reveals regional differences in oligodendrocyte differentiation in the adult brain. Nat Neurosci 16, 1370–1372 (2013). - PubMed

Publication types

LinkOut - more resources