. 2024 May;27(5):886-900.
doi: 10.1038/s41593-024-01600-y. Epub 2024 Mar 27.

Xenografted human microglia display diverse transcriptomic states in response to Alzheimer's disease-related amyloid-β pathology

Affiliations

Xenografted human microglia display diverse transcriptomic states in response to Alzheimer's disease-related amyloid-β pathology

Renzo Mancuso et al. Nat Neurosci. 2024 May.

Abstract

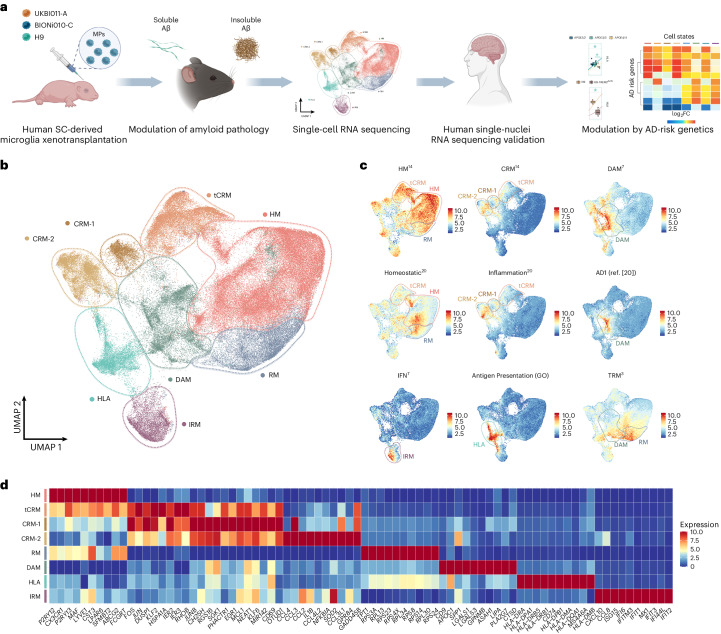
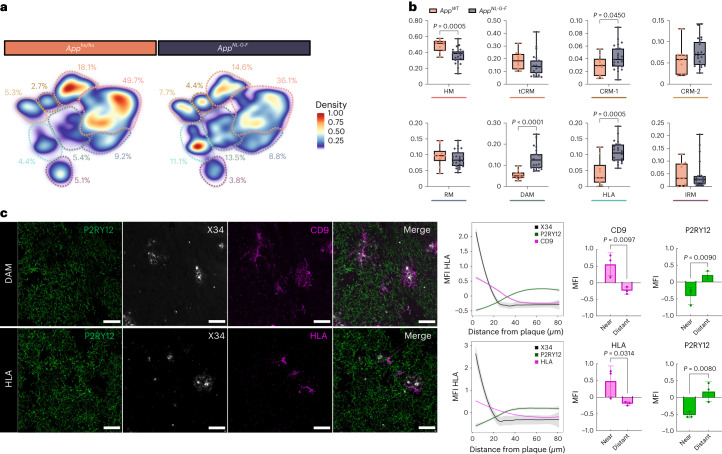
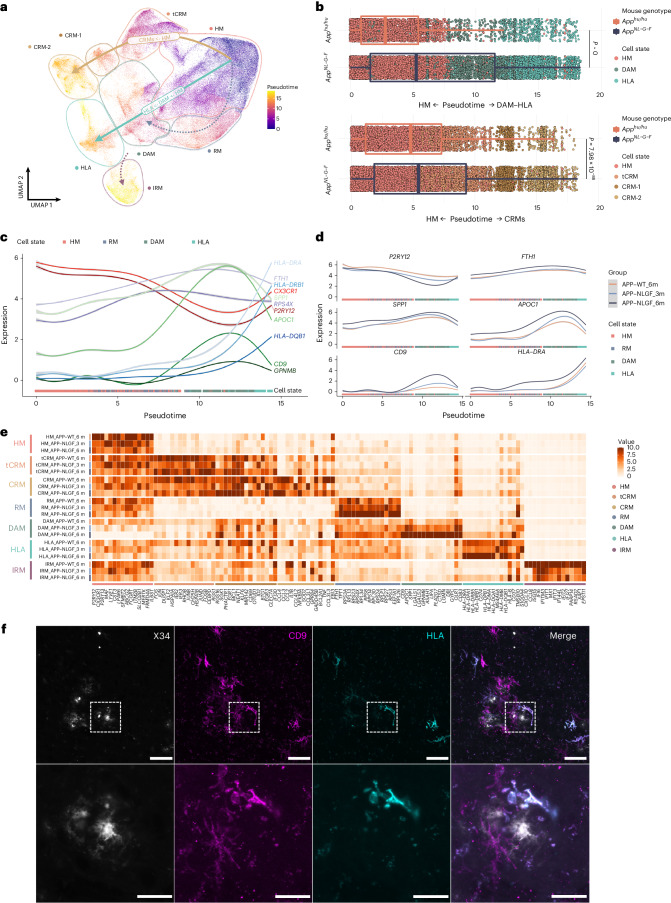
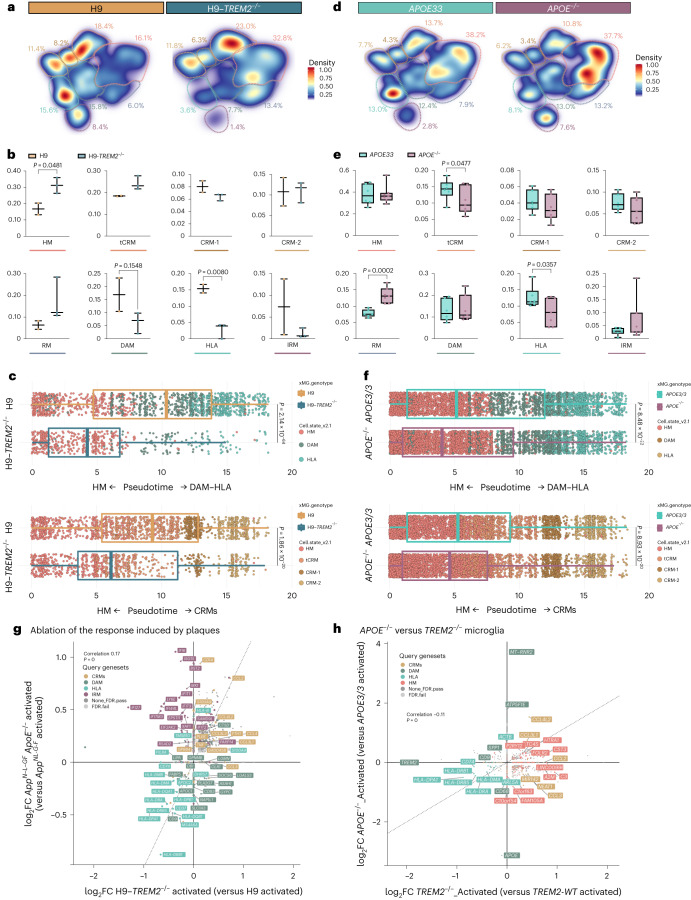
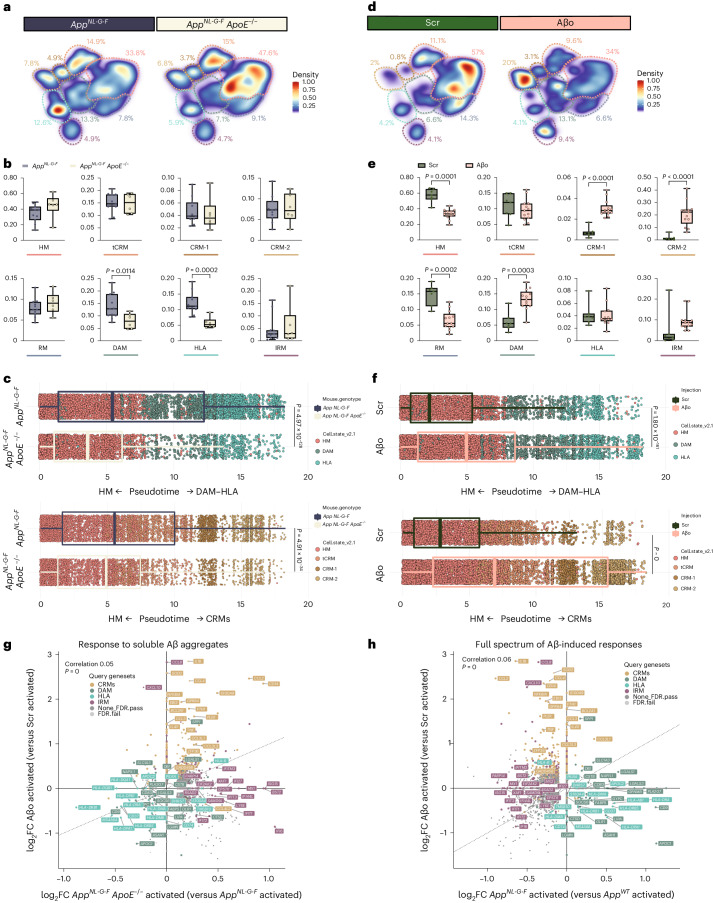
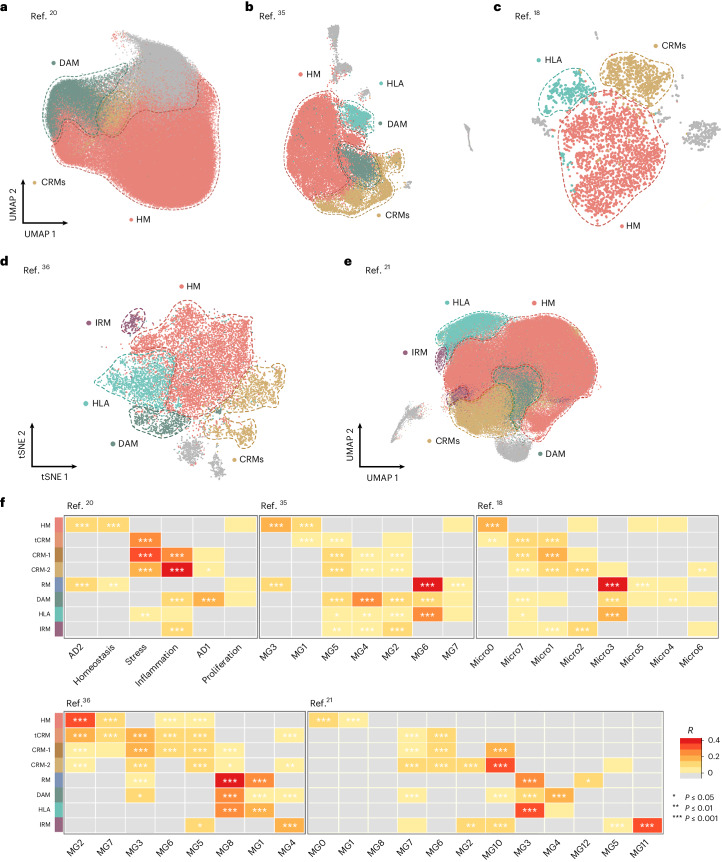
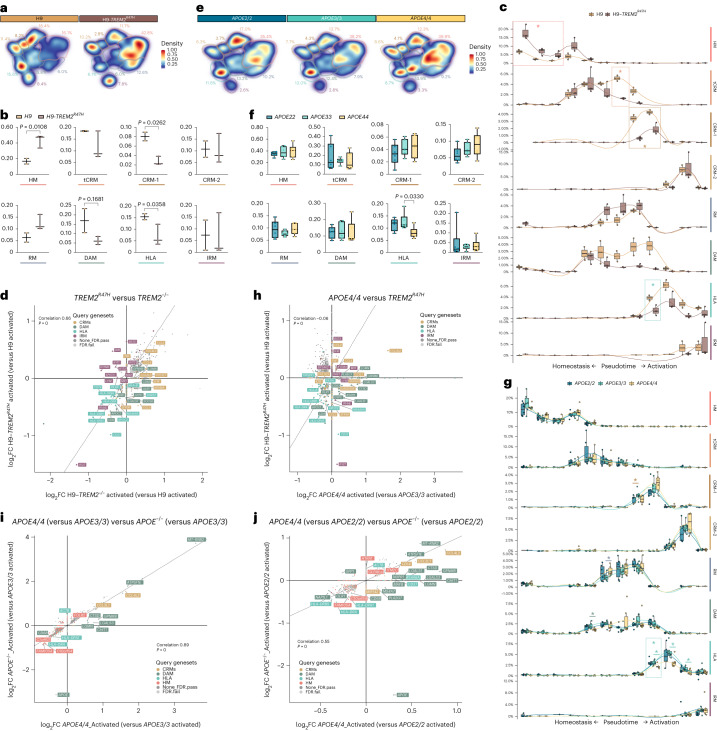
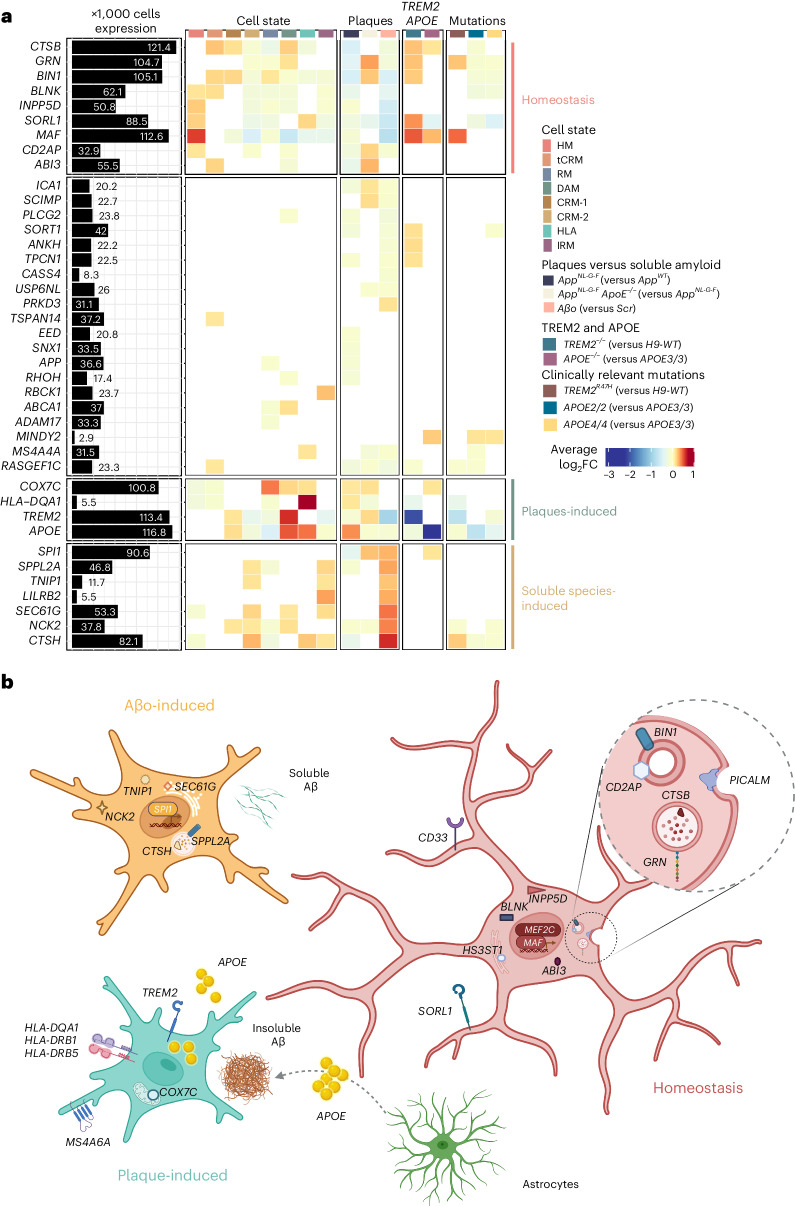
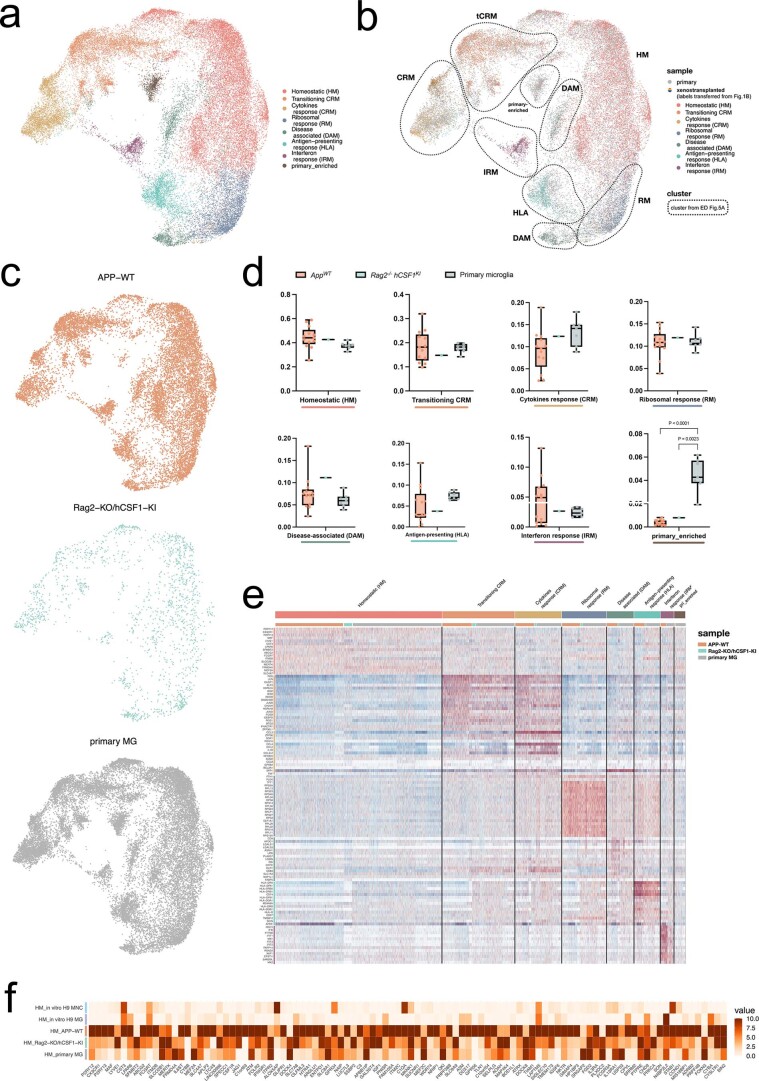
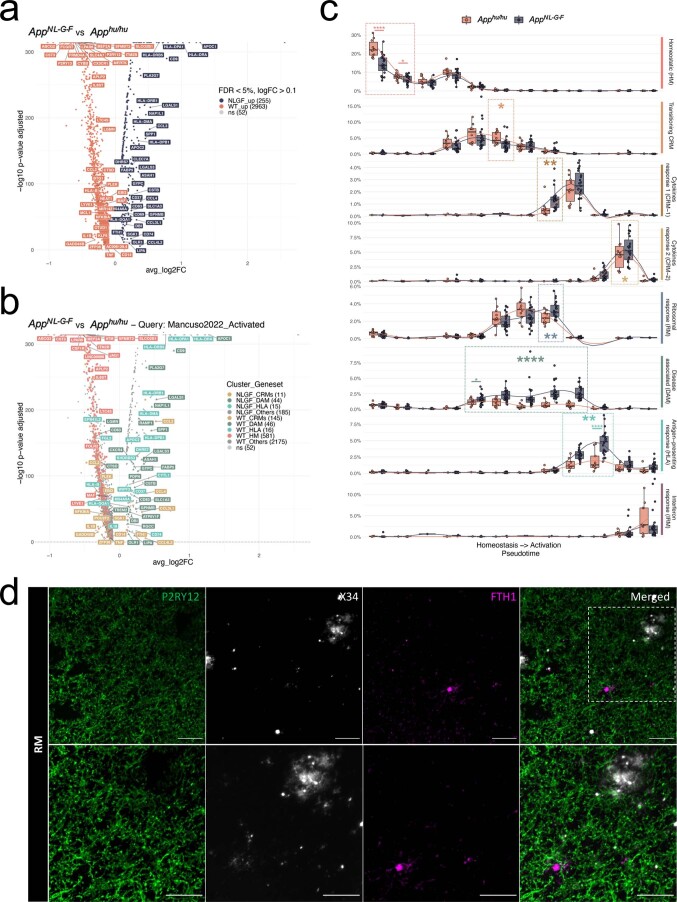
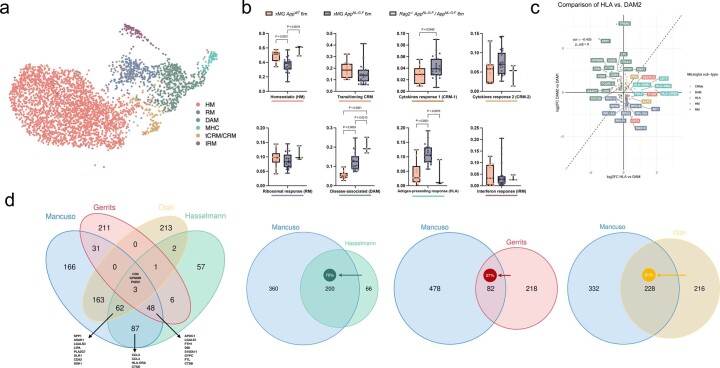
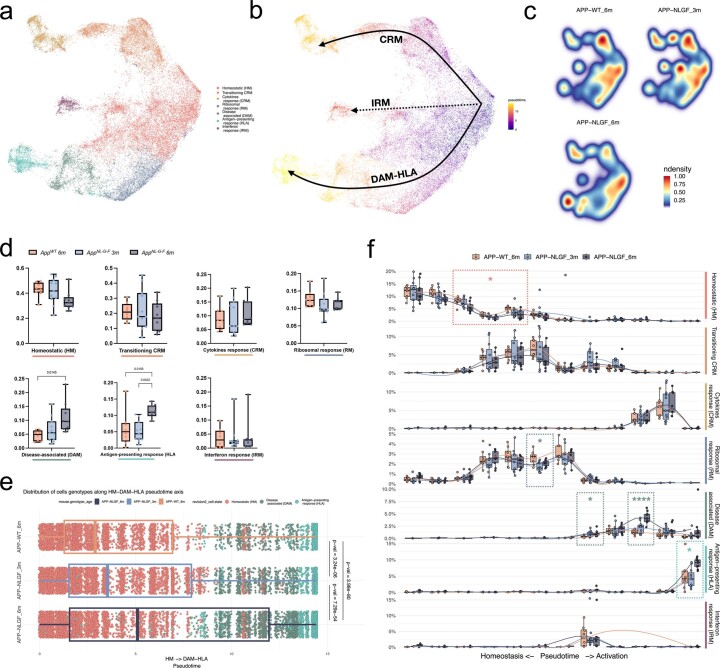
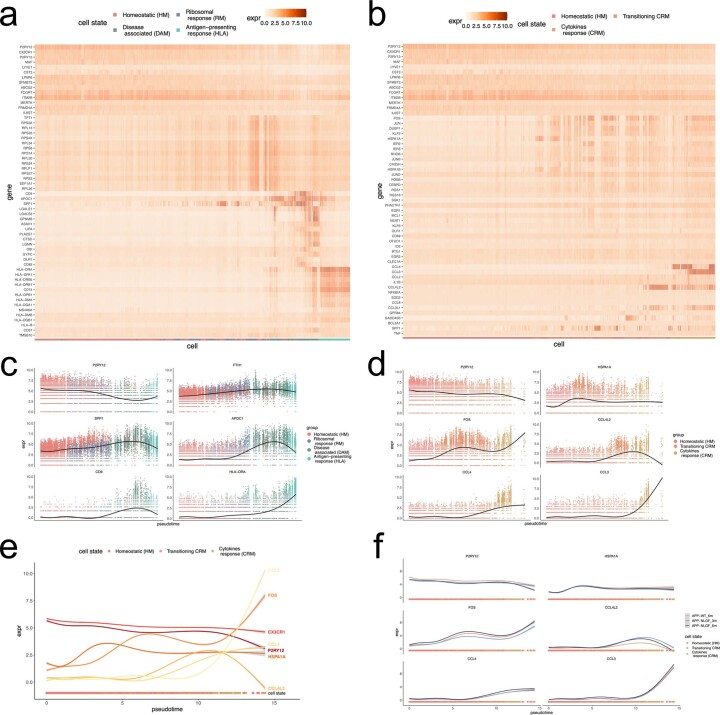
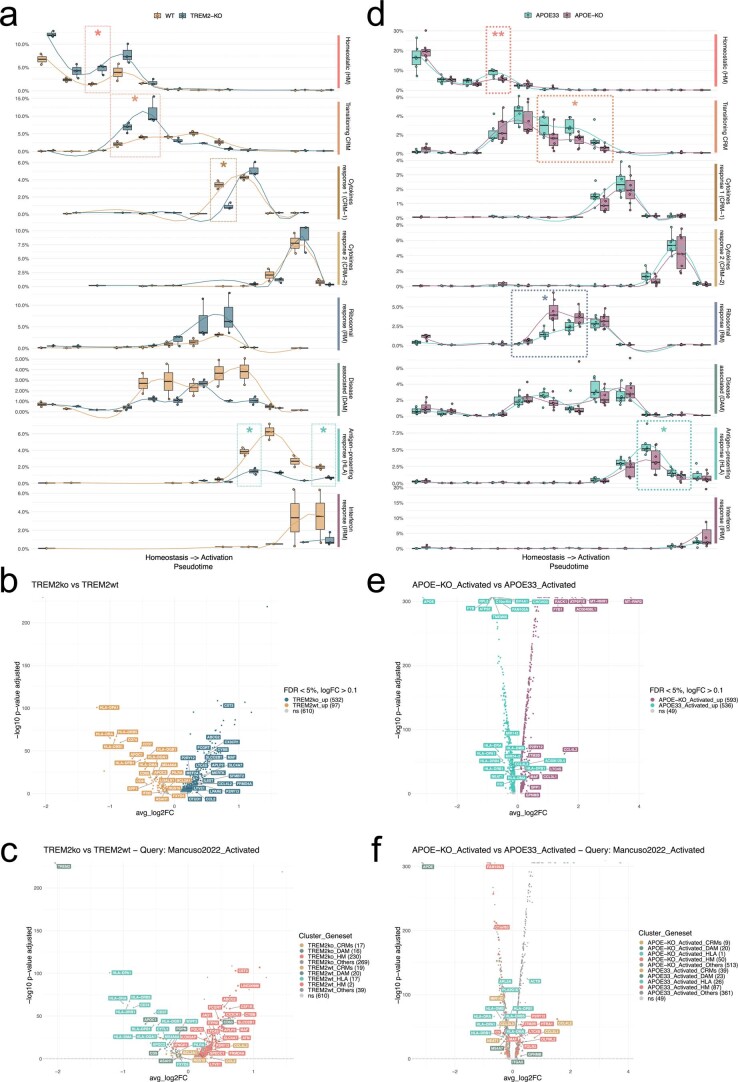
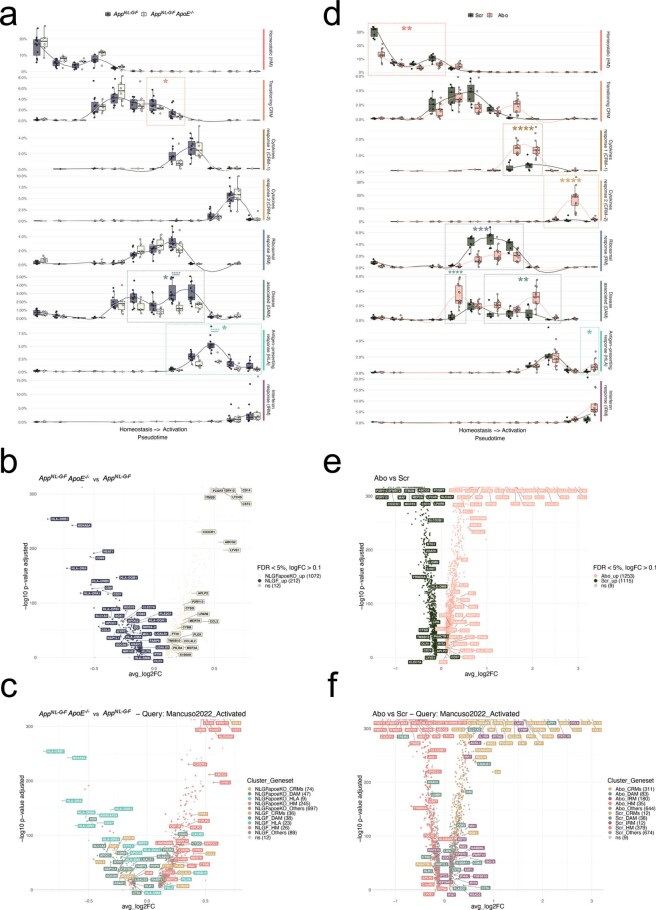
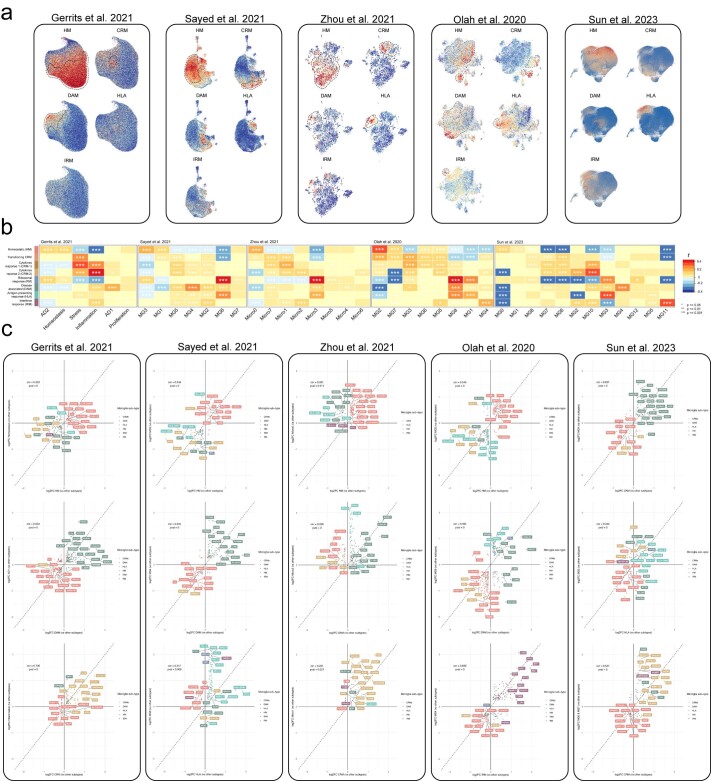
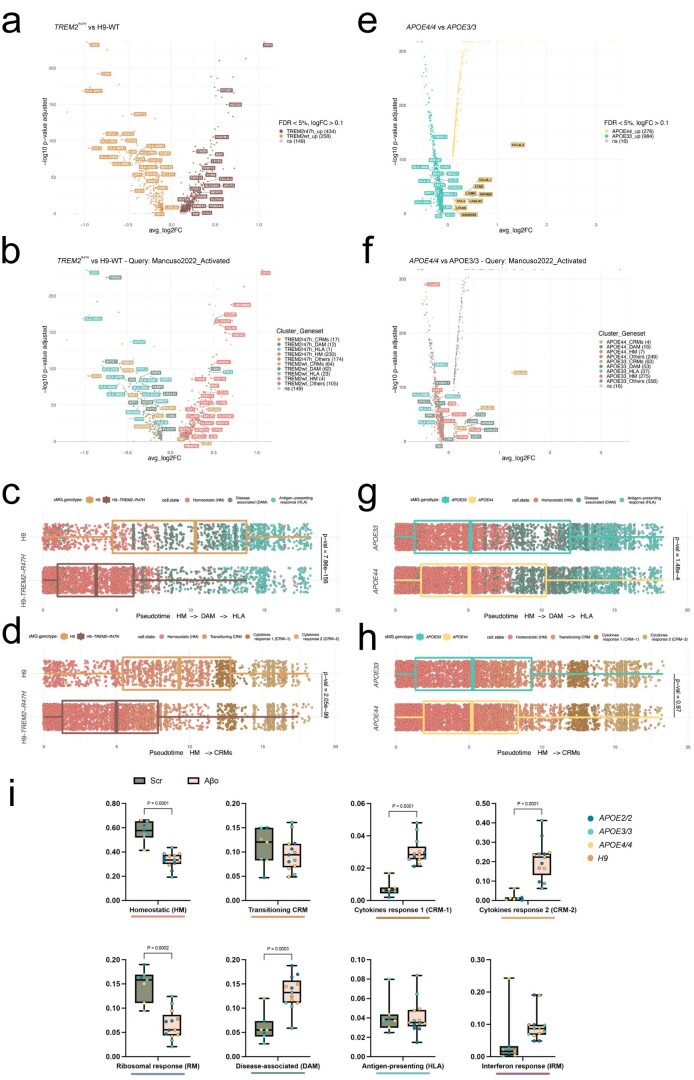
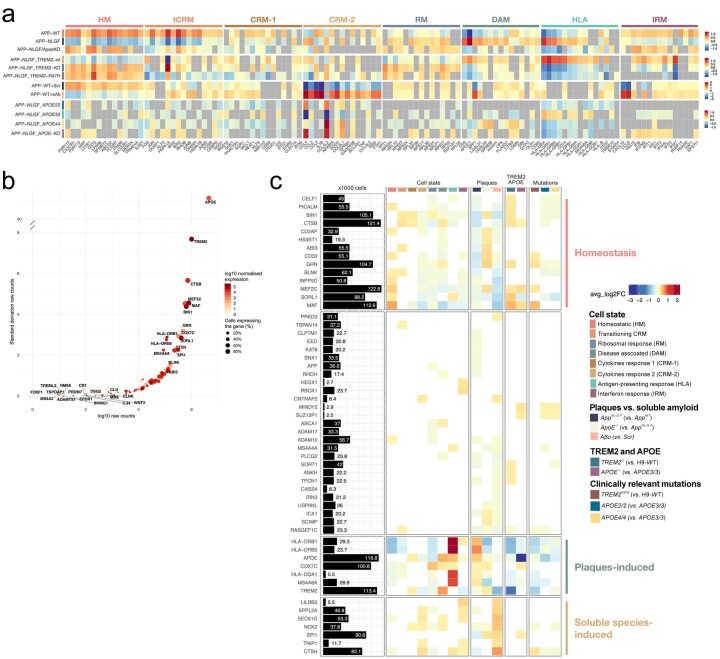
Microglia are central players in Alzheimer's disease pathology but analyzing microglial states in human brain samples is challenging due to genetic diversity, postmortem delay and admixture of pathologies. To circumvent these issues, here we generated 138,577 single-cell expression profiles of human stem cell-derived microglia xenotransplanted in the brain of the AppNL-G-F model of amyloid pathology and wild-type controls. Xenografted human microglia adopt a disease-associated profile similar to that seen in mouse microglia, but display a more pronounced human leukocyte antigen or HLA state, likely related to antigen presentation in response to amyloid plaques. The human microglial response also involves a pro-inflammatory cytokine/chemokine cytokine response microglia or CRM response to oligomeric Aβ oligomers. Genetic deletion of TREM2 or APOE as well as APOE polymorphisms and TREM2R47H expression in the transplanted microglia modulate these responses differentially. The expression of other Alzheimer's disease risk genes is differentially regulated across the distinct cell states elicited in response to amyloid pathology. Thus, we have identified multiple transcriptomic cell states adopted by human microglia in a multipronged response to Alzheimer's disease-related pathology, which should be taken into account in translational studies.


Conflict of interest statement

B.D.S. is or has been a consultant for Eli Lilly, Biogen, Janssen Pharmaceutica, Eisai, AbbVie and other companies. B.D.S. is also a scientific founder of Augustine Therapeutics and a scientific founder and stockholder of Muna Therapeutics. R.M. has scientific collaborations with Alector, Nodthera and Alchemab, and Roche, and has been a consultant for Sanofi. I.G. and L.W. are currently employed by Muna Therapeutics but were part of the De Strooper lab when this work was performed. The remaining authors declare no competing interests.

Figures

Fig. 1
Fig. 1. Human microglia display a complex, heterogeneous response to Aβ pathology.
a, Experimental design used in this study. b, UMAP plot visualizing 138,577 single xenografted human microglial cells sorted from mouse brain (CD11b+hCD45+) ~6 months after transplantation. Cells are colored according to clusters identified: HM, RM, DAM, IRM, HLA, CRM-1 and CRM-2, and tCRM. The assignment of different clusters to distinct cell types or states is based on previous experimental data from our and other laboratories,,, (see c,d and Extended Data Figs. 3 and 4). c, UMAP plots as in b, colored by the combined level of expression of groups of genes that characterize distinct microglial transcriptional states. d, Top ten most differentially expressed genes in each cluster (normalized expression scaled by gene is shown). FC, fold change; GO, gene ontology; MP, microglial precursor; SC, stem cell.
Fig. 2
Fig. 2. Multipronged response of human microglia upon exposure to Aβ.
a, Density plots displaying the average distribution of human microglia transplanted in AppNL-G-F (n = 23) and AppWT (n = 10) mice (density is normalized to sample size). b, Distribution and proportion of cells across all identified clusters (box plots are limited by lower and upper quartiles and midline indicates median; whiskers show minimum to maximum values. Each dot represents a single mouse. Unpaired t-test with Welch’s correction, two-tailed, alpha = 0.05, significance was set as P < 0.05). c, Representative images and quantification of human microglia engrafted in the brain of AppNL-G-F mice at 6 months of age, labeled with human-specific antibodies for P2RY12 (HM microglia), CD9 (DAM), HLA-DR/DQ (HLA microglia), as well as X-34 for Aβ plaques. The shift in immunofluorescent signal in the proximity of Aβ plaques was performed using a modified Sholl analysis where the fluorescent intensity of microglial markers P2RY12, CD9 and HLA was measured through concentric rings (annuli) of increasing diameter surrounding the X-34 plaque center. Intensities of each channel were scaled for comparison using z-score normalization. Intensity over distance (µm) was plotted using Loess nonparametric regression in R with estimated standard error for each predicted value. For comparison of intensities near and distant from the plaque center, the means of the inner and outer three annuli were independently calculated (near, 0–10 mm, distant, 70–80 mm from the plaque; n = 3 per group; bar plots represent mean ± s.e.m.; unpaired t-test, one-tailed, alpha = 0.05, significance was set as P < 0.05). Scale bars, 50 μm. MFI, median fluorescent intensity.
Fig. 3
Fig. 3. Human microglial transcriptional trajectory in response to Aβ pathology.
a, Phenotypic trajectory followed by the human microglia after exposure to Aβ in vivo, obtained by an unbiased pseudotime ordering with Monocle 3. b, Distribution of cells from different host mouse genetic backgrounds (y axis) across the two main transcriptional trajectories, DAM and HLA (top panel) and CRM (bottom panel), colored by clusters shown in a. Note the shift in transcriptional states in AppNL-G-F versus AppWT mice (box plots are limited by lower and upper quartiles and midline indicates median; whiskers extend from the box to the smallest or largest value no further than 1.5 × interquartile range. Each dot represents a single cell, n = 10 mice (10,663 cells) for AppWT, n = 23 mice (32,436 cells) for AppNL-G-F. Unpaired t-test with Welch’s correction, two-tailed, alpha = 0.05, significance was set as P < 0.05). c,d, Expression profile of selected genes across the HM–DAM–HLA pseudotime axis from the entire dataset (c), and divided into the different experimental groups: AppWT, AppNL-G-F at 3 months and AppNL-G-F at 6 months (d). e, Top ten most differentially expressed genes in each cluster divided by experimental group: AppWT, AppNL-G-F at 3 months and AppNL-F-G at 6 months (normalized expression scaled by gene is shown). f, Representative images of human microglia engrafted in the brain of AppNL-G-F mice at 6 months of age and labeled with human-specific CD9 (DAM) and HLA-DR/DQ (HLA microglia) antibodies. Scale bars, 25 μm (upper panel) and 50 μm (lower panel). APP–NLGF_3m, AppNL-G-F 3 months; APP–NLGF_6m, AppNL-G-F 6 months; APP–WT_6m, AppWT 6 months.
Fig. 4
Fig. 4. TREM2 and APOE differentially modulate the transition to DAM and HLA states.
a,d, Density plots displaying the average distribution of human H9-WT (n = 2) and H9-TREM2−/− (n = 3) (a), and human APOE3/3 (n = 6) and APOE−/− (n = 7) (d) microglia transplanted in AppNL-G-F mice. Density is normalized by sample size. b,e, Distribution and proportion of cells across all identified clusters for H9-WT (n = 2) and H9-TREM2−/− (n = 3) (b), and APOE3/3 (n = 6) and APOE−/− (n = 7) (e) transplanted microglia. Dots represent single mice. c,f, Phenotypic trajectory followed by H9-WT (n = 2 mice and 3,282 cells) and H9-TREM2−/− (n = 3 mice and 1,301 cells) (c), and APOE3/3 (n = 6 mice and 7,894 cells) and APOE−/− (n = 7 mice and 14,012 cells) (f) human microglia obtained by an unbiased pseudotime ordering with Monocle 3. Proportion of cells (y axis) at different stages of the pseudotime trajectory (x axis), colored as shown in Fig. 1a. Dots represent single cells. g, Correlation analysis of the logFC in microglia transplanted in AppNL-G-F ApoE−/− versus AppNL-G-F mice (y axis from Fig. 4) and H9-TREM2−/− versus H9-WT from AppNL-G-F mice (x axis) (Pearson’s correlation, R = 0.17, differentially expressed genes adjusted using Bonferroni correction and colored as in Fig. 1b; ‘activated’ indicates that differential expression was performed comparing cell states reactive to pathology, excluding homeostatic or transitioning clusters). h, Correlation analysis of the logFC in TREM2−/− (x axis) and APOE−/− (y axis) microglia transplanted in AppNL-G-F mice (Pearson’s correlation, R = −0.11, differentially expressed genes adjusted using Bonferroni correction and colored as in Fig. 1b; ‘activated’ indicates that differential expression was performed comparing reactive cell states, excluding homeostatic or transitioning clusters). Box plots in b,c,e,f are limited by lower and upper quartiles and midline indicates median; whiskers show minimum to maximum value (b,e) or extend from the box to the smallest or largest value no further than 1.5× interquartile range (c,f). Unpaired t-test with Welch’s correction, two-tailed, alpha = 0.05, significance was set as P < 0.05.
Fig. 5
Fig. 5. Human microglia display a differential response to Aβ plaques and Aβo.
a,d, Density plots displaying the average distribution of human microglia transplanted in AppNL-G-F (n = 11) and AppNL-G-F ApoE−/− (n = 6) mice (a), and human microglia transplanted in AppWT mice and challenged with scrambled peptide (Scr, n = 7) or Aβo (n = 13) (d). Density is normalized by sample size. b,e, Distribution and proportion of cells across all identified clusters for microglia transplanted in AppNL-G-F (n = 11) and AppNL-G-F ApoE−/− (n = 6) mice (b), and Scr/Aβo injected mice (e). Dots represent single mice. c,f, Phenotypic trajectory followed by human microglia transplanted in AppNL-G-F (n = 11 and 14,649 cells) and AppNL-G-F ApoE−/− (n = 6 and 7,738 cells) mice (c), and challenged with scrambled peptide (Scr, n = 7 and 10,967 cells) or Aβo (n = 13 and 18,691 cells) (f), obtained by an unbiased pseudotime ordering with Monocle 3. Proportion of cells from different mouse hosts (y axis) at different stages of the pseudotime trajectory (x axis), colored as shown in Fig. 1a. Dots represent single cells. g, Correlation analysis of the logFC in microglia either challenged with Aβο versus Src (y axis) or transplanted in AppNL-G-F ApoE−/− versus AppNL-G-F mice (x axis) (Pearson’s correlation, R = 0.05, differentially expressed genes were adjusted using Bonferroni correction and colored according to clusters in Fig. 1a). h, Correlation analysis of the logFC in microglia either challenged with Aβ soluble aggregates (Aβο) versus scrambled peptide (Src, y axis) or transplanted in AppNL-G-F mice (x axis) (Pearson’s correlation, R = 0.06, differentially expressed genes adjusted using Bonferroni correction). Box plots in b,c,e,f are limited by lower and upper quartiles and midline indicates median; whiskers show minimum to maximum values (b,e) or extend from the box to the smallest or largest value no further than 1.5× interquartile range (c,f). Unpaired t-test with Welch’s correction, two-tailed, alpha = 0.05, significance was set as P < 0.05. Scr, scrambled peptide.
Fig. 6
Fig. 6. Single-microglial nuclei from human postmortem brain.
ae, Human snRNA-seq datasets from Gerrits et al. (n = 176,136) (a), Sayed et al. (n = 28,767) (b), Zhou et al. (n = 3,978) (c), Olah et al. (n = 16,242) (d) and Sun et al. (n = 194,000) (e) re-analyzed to reproduce their original embeddings and annotated with our xenotransplanted microglial profiles as in Fig. 1b. f, Pairwise Pearson correlation between logFC of all differentially expressed genes (logFC cut-off set at 0.25, P < 0.05) of each microglial subtype and logFC of all differentially expressed genes (P < 0.05) of clusters from each human snRNA-seq study, with significance set at a P-adjusted value < 0.05 (*P ≤ 0.05, **P ≤ 0.01, ***P ≤ 0.001). Only positive correlations are depicted here (r > 0). Additional correlations are shown in Extended Data Figs. 6 and 7. scRNA-seq, single cell RNA-sequencing.
Fig. 7
Fig. 7. AD genetic risk modifies the response of human microglia to Aβ pathology.
a,e, Density plots displaying the average distribution of human H9-WT (n = 2) and H9-TREM2R47H (n = 3) (a), and APOE2/2 (n = 6), APOE3/3 (n = 6) and APO4/4 (n = 6) human microglia (e) transplanted in AppNL-G-F mice. b,f, Distribution and percentage of cells across all identified clusters for H9-WT (n = 2) and H9-TREM2R47H (n = 3) (b), and APOE2/2 (n = 6), APOE3/3 (n = 6) and APO4/4 (n = 6) (f). Dots represent single mice. c,g, Phenotypic trajectory followed by H9-WT (n = 2) and H9-TREM2R47H (n = 3) (c), and APOE2/2 (n = 6), APOE3/3 (n = 6) and APO4/4 (n = 6) (g) human microglia obtained by an unbiased pseudotime ordering with Monocle 3. Proportion of cells (y axis) over the binned pseudotime trajectory (x axis), colored by genotypes shown in a. Dots represent single mice (*P < 0.05). d,h, Correlation of the logFC in TREM2R47H versus H9-WT (y axis) and H9-TREM2−/− versus H9-WT (x axis) (d), and TREM2R47H versus H9-WT (y axis) and APOE4/4 versus APOE3/3 (x axis) (h) microglia transplanted in AppNL-G-F mice (Pearson’s correlation, R = 0.17, differentially expressed genes were adjusted using Bonferroni correction and colored as in Fig. 1b). i,j, Comparison of transcriptomic profiles of APOE4/4 (versus APOE3/3) versus APOE−/− (versus APOE3/3) (i), and APOE4/4 (versus APOE2/2) versus APOE−/− (versus APOE2/2) (j) microglia transplanted in AppNL-G-F mice (Pearson’s correlation, differentially expressed genes were adjusted using Bonferroni correction and colored according to clusters in Fig. 1b). Box plots in b,c,f,g are limited by lower and upper quartiles and midline indicates median; whiskers show minimum to maximum values (b,f) or extend from the box to the smallest or largest value no further than 1.5 × interquartile range (c,g). Unpaired t-test with Welch’s correction, two-tailed, alpha = 0.05, significance was set as P < 0.05 (b,c); or one-way ANOVA with Tukey’s multiple comparisons as post hoc test, alpha = 0.05, significance was set as P-adjusted value < 0.05 (f,g). In d,h,i, ‘activated’ indicates that differential expression was performed comparing reactive cell states, excluding homeostatic or transitioning clusters.
Fig. 8
Fig. 8. AD genetic risk genes are differentially expressed in human microglial cell states and modulated by Aβ pathology.
a, Analysis of genome-wide association studies (GWAS) genes enrichment in xenotransplanted microglia. The black bars represent the number of cells (in thousands) with detectable expression (≥1 read per cell) for each candidate gene from Bellenguez et al.. The heatmap summarizes the deregulated expression (logFC, color scale) of these genes across cell states (each cluster compared with all others), as well as after exposure to Aβ plaque pathology, upon injection of soluble Aβ aggregates or altering the genetic background of the mice or the transplanted cells. The genes are ranked in rows based on hierarchical clustering. We identify three sets of genes that display a common profile across cell states (based on their enrichment in the specific microglial phenotypic transcriptional states HM, DAM and HLA, and CRM), Aβ pathology and genetic risk, and we group these profiles as: microglial homeostasis, plaque-induced genes and soluble aggregates-induced genes. The remaining genes did not show a clear enrichment in cell states or other conditions. All differential expressions were significant after adjusting P values using Bonferroni correction (FDR < 0.05). Only genes that are significantly changing in at least one of the tested conditions are reported, see Supplementary Table 4 and Extended Data Fig. 10 for further details. b, Illustration of the complex microglial AD genetics by cell-state profiles and driven by different Aβ pathologies as found in a and Extended Data Fig. 10.
Extended Data Fig. 1
Extended Data Fig. 1. Comparison of human microglia transplanted in AppWT and Rag2−/−hCSFKI mice, and primary microglia isolated from human surgical resections published before.
a, UMAP plot of the 39,538 cells passing quality control, coloured by annotated cell states after removal of CAMs, other myeloid, low quality and proliferating clusters. b, UMAP plots as in a, coloured by sample. c, UMAP plots as in a, split between the three experimental groups. d, Box plot showing proportion of cells across all identified clusters (box plots are limited by lower and upper quartiles and midline indicates median; whiskers show minimum to maximum value. Each dot represents a single replicate, n = 13 for AppWT, n = 1 for Rag2−/−/hCSF1KI, n = 7 for primary MG. One-way ANOVA with Tukey’s multiple comparisons as post-hoc test, alpha = 0.05, significance was set as P-adjusted value < 0.05). e, Heatmap displaying the top20 most upregulated genes in each cluster as in a. f, Heatmap depicting the expression levels of homeostatic microglial markers across all experimental groups (normalized expression scaled by gene is shown).
Extended Data Fig. 2
Extended Data Fig. 2. Extended analysis of the cell state transition in AppNL-G-F and AppWT mice.
a, Volcano plot showing a paired comparison between AppNL-G-F and AppWT mice (Wilcoxon rank-sum test, P-values adjusted with Bonferroni correction based on the total number of genes in the dataset). The number of significant genes per condition is reported in brackets in the legend (Log2 Fold-Change threshold > 0.1). Adjusted p-value threshold < 0.05 (ns = not significant). b, Volcano plot showing a paired comparison between AppNL-G-F and AppWT mice (Wilcoxon rank-sum test, P-values adjusted with Bonferroni correction based on the total number of genes in the dataset), coloured by clusters as in Fig. 1 (HM = red squares, CRMs (CRM-1 & CRM-2) = ochre circles, DAM = olive triangles, HLA = cyan diamonds, other markers = grey circles). The number of significant genes per condition is reported in brackets in the legend (Log2 Fold-Change threshold > 0.1). Adjusted p-value threshold < 0.05 (ns = not significant). c, Phenotypic trajectory followed by the human microglia obtained by an unbiased pseudotime ordering with Monocle 3. Proportion of cells (y-axis) present in each cell state as in Fig. 1a (rows) at different stages of the binned pseudotime trajectory (x-axis) in AppNL-G-F and AppWT mice (box plots are limited by lower and upper quartiles and midline indicates median; whiskers extend from the box to the smallest or largest value no further than 1.5*inter-quartile range. Each dot represents a single mouse, n = 10 for AppWT, n = 23 AppNL-G-F. Unpaired t-test with Welch’s correction, two-tailed, alpha = 0.05, significance was set as P-value < 0.05; *p < 0.05, **p < 0.01, ****p < 0.0001). d, Representative images of human microglia engrafted in the brain of AppNL-G-F mice at 6 months of age and labelled with human specific antibodies FTH1 (RM). Human P2RY12 was stained in green, and amyloid-β plaques were stained with X34 in white. Scale bars are 25 μm (top row) and 50 μm (bottom row).
Extended Data Fig. 3
Extended Data Fig. 3. Extended comparison of the response of human and mouse microglia to amyloid pathology.
a, UMAP plot of the 3,803 mouse microglia isolated from AppNL-G-F and Rag2−/− Il2rγ−/− hCSF1KI AppNL-G-F passing quality control, coloured by annotated cell states and after removal of CAMs, other myeloid, low quality and proliferating clusters. b, Distribution and proportion of cells across all identified clusters (box plots are limited by lower and upper quartiles and mid line indicates median; whiskers show minimum to maximum value. Each dot represents a single mouse, n = 10 for xMG AppWT 6 m, n = 23 for xMG AppNL-G-F 6 m, n = 2 for AppNL-G-F). One-way ANOVA with Tukey’s multiple comparisons as post-hoc test, alpha = 0.05, significance was set as P-adjusted value < 0.05). For cell states that only had 2 groups (tCRM and CRM-1), we applied an unpaired t-test with Welch’s correction, alpha = 0.05, two-tailed, significance was set as P-value < 0.05. Note that whereas mouse cells polarize to DAM, HLA and CRM, proportions do not increase. c, Correlation analysis of the logFC in DAM2 vs. DAM1 clusters defined by Keren-Shaul et al. (y-axis) and HLA vs. DAM clusters defined in this study (x-axis). Pearson’s correlation, R = −0.44, differentially expressed genes were adjusted using Bonferroni correction and colored according to clusters in Fig. 1a. d, Overlap in the number of genes between our DAM signature and that from mouse systems (KarenShaul DAM and SalaFrigerio ARM), other human microglia xenotransplantation studies (Hasselman DAM), and postmortem single nuclei samples (Gerrits AD1, and Olah DAM). The arrow depicts the direction used to calculate the percentage overlap.
Extended Data Fig. 4
Extended Data Fig. 4. Extended pseudotime analysis, including transplanted microglia isolated from 3 months old AppNL-G-F mice.
a, UMAP plot of the 38,360 mouse microglia isolated from 3 and 6 months AppNL-G-F and AppWT mice passing quality control, coloured by annotated cell states and after removal of CAMs, other myeloid, low quality and proliferating clusters. b, Phenotypic trajectory followed by the human microglia after exposure to amyloid-β in vivo, obtained by an unbiased pseudotime ordering with Monocle 3. c, Density plots displaying the average distribution of human microglia transplanted in 3 months old AppNL-G-F (n = 11) 6 months old AppNL-G-F (n = 9) and AppWT (n = 8) mice (density is normalized to sample size). d, Box plot showing proportion of cells across all identified clusters (eEach dot represents a single mouse, n = 8 for AppWT, n = 11 for AppNL-G-F 3 m, n = 9 for AppNL-G-F 6 m). e, Distribution of cells from different host mouse genetic backgrounds and ages (y-axis) across the DAM and HLA transcriptional trajectories colored by clusters shown in a (Each dot represents a single cell, n = 8 mice (8,974 cells) for AppWT, n = 11 mice (10,822 cells) for AppNL-G-F 3 m, n = 9 mice (12,197 cells) for AppNL-G-F 6 m). f, Phenotypic trajectory followed by the human microglia obtained by an unbiased pseudotime ordering with Monocle 3. Proportion of cells (y-axis) present in each cell state as in a (rows) at different stages of the binned pseudotime trajectory (x-axis) in 3 and 6 months old AppNL-G-F and AppWT mice (Each dot represents a single mouse, n = 8 for AppWT, n = 11 for AppNL-G-F 3 m, n = 9 for AppNL-G-F 6 m; *p < 0.05, ****p < 0.001). Box plots in d, e and f are limited by lower and upper quartiles and midline indicates median; whiskers show minimum to maximum value (d) or extend from the box to the smallest or largest value no further than 1.5*inter-quartile range (e and f). One-way ANOVA with Tukey’s multiple comparisons as post-hoc test, alpha = 0.05, significance was set as P-adjusted value < 0.05.
Extended Data Fig. 5
Extended Data Fig. 5. Extended pseudotime analysis, including transplanted microglia isolated from 3 months old AppNL-G-F mice (continuation).
a, b, Heatmaps displaying the cells ordered by the (a) HM-DAM-HLA and (b) HM-CRM pseudotime axis, coloured by single-cell levels of expression of the top markers per cluster. c, d, Expression profile of selected genes across the (c) HM-DAM-HLA and (d) CRM pseudotime axis averaging all experimental groups in the dataset. e, Comparison of the expression profile of selected CRM markers across the trajectory. f, Expression profile of selected genes across the CRM pseudotime axis as in d divided into the different experimental groups: AppWT, AppNL-G-F 3 M and AppNL-F-G 6 M.
Extended Data Fig. 6
Extended Data Fig. 6. Extended analysis on the differential impact of TREM2 and APOE deficiency in the transplanted microglia.
a, Phenotypic trajectory followed by TREM2 deficient and control microglia, obtained by an unbiased pseudotime ordering with Monocle 3. Proportion of cells (y-axis) present in each cell state as in Fig. 1b (rows) at different stages of the binned pseudotime trajectory (x-axis), colored by host genotypes (each dot represents a single mouse, n = 2 mice H9-WT, n = 3 mice H9-TREM2−/−). b, c, Volcano plots showing a paired comparison between TREM2−/− and WT microglia transplanted in AppNL-G-F, coloured by (b) cells genotype and (c) cluster as in Fig. 1b. The number of significant genes per condition is reported in brackets in the legend (Log2 Fold-Change threshold > 0.1). Adjusted p-value threshold < 0.05 (Wilcoxon rank-sum test, P-values adjusted with Bonferroni correction based on the total number of genes in the dataset, ns = not significant). d, Phenotypic trajectory followed by APOE deficient microglia compared to isogenic APOE3/3 controls, obtained by an unbiased pseudotime ordering with Monocle 3. Proportion of cells (y-axis) present in each cell state as in Fig. 1b (rows) at different stages of the binned pseudotime trajectory (x-axis), colored by host genotypes (each dot represents a single mouse, n = 6 APOE3/3 and n = 7 for APOE−/−). e, f, Volcano plots showing a paired comparison between APOE−/− and APOE3/3 microglia transplanted in AppNL-G-F, coloured by (e) cells genotype and (f) cluster as in Fig. 1b. The number of significant genes per condition is reported in brackets in the legend (Log2 Fold-Change threshold > 0.1). Adjusted p-value threshold < 0.05 (Wilcoxon rank-sum test, P-values adjusted with Bonferroni correction based on the total number of genes in the dataset, ns = not significant). Box plots in a and d, are limited by lower and upper quartiles and midline indicates median; whiskers extend from the box to the smallest or largest value no further than 1.5*inter-quartile range. Unpaired t-test with Welch’s correction, two-tailed, alpha = 0.05, significance was set as P-value < 0.05, *p < 0.05, **p < 0.01.
Extended Data Fig. 7
Extended Data Fig. 7. Extended analysis on the differential effects of amyloid-β plaques and soluble aggregates on microglia cell states.
a, Phenotypic trajectory followed by the human microglia transplanted in AppNL-G-F ApoE−/− and AppNL-G-F, obtained by an unbiased pseudotime ordering with Monocle 3. Proportion of cells (y-axis) present in each cell state as in Fig. 1b (rows) at different stages of the binned pseudotime trajectory (x-axis), colored by host genotypes (dots represent single mice, n = 11 AppNL-G-F, n = 6 AppNL-G-F ApoE−/−). b, c, Volcano plots showing a paired comparison between microglia transplanted in AppNL-G-F ApoE−/− and AppNL-G-F mice, coloured by (b) host genotype and (c) cluster as in Fig. 1a. The number of significant genes per condition is reported in brackets in the legend (Log2 Fold-Change threshold > 0.1). Adjusted p-value threshold < 0.05 (Wilcoxon rank-sum test, P-values adjusted with Bonferroni correction based on the total number of genes in the dataset, ns = not significant). d, Phenotypic trajectory followed by the human microglia after injection of amyloid-b oligomers (Aβο) or scrambled peptide (Scr), obtained by an unbiased pseudotime ordering with Monocle 3. Proportion of cells (y-axis) present in each cell state as in Fig. 1a (rows) at different stages of the binned pseudotime trajectory (x-axis), colored by cells genotypes (dots represent single mice, n = 7 for Scr, n = 13 Aβο). e, f, Volcano plots showing a paired comparison between microglia transplanted in AppWT mice and treated with Aβο or Scr, coloured by (e) treatment and (f) cluster as in Fig. 1a. The number of significant genes per condition is reported in brackets in the legend (Log2 Fold-Change threshold > 0.1). Adjusted p-value threshold < 0.05 (Wilcoxon rank-sum test, P-values adjusted with Bonferroni correction based on the total number of genes in the dataset, ns = not significant). Box plots in a and d, are limited by lower and upper quartiles and midline indicates median; whiskers extend from the box to the smallest or largest value no further than 1.5*inter-quartile range. Unpaired t-test with Welch’s correction, two-tailed, alpha = 0.05, significance was set as P-value < 0.05, *p < 0.05, **p < 0.01, ***p < 0.001,****p < 0.0001.
Extended Data Fig. 8
Extended Data Fig. 8. Extended analysis of the single nuclei from human post-mortem brains (continuation).
a, UMAP plots as in Fig. 6, coloured by the combined level of expression of groups of genes that characterise distinct microglial transcriptional states from xenotransplanted microglia. b, Full set of pairwise Pearson correlations between logFC of all DE genes (logFC cut off set at 0.25, P-value < 0.05) of each microglia sub-type and logFC of all DE genes (p < 0.05) of clusters from each human snRNA-seq study, with significance set at a P-adjusted value < 0.05 (*p < =0.05, **p < =0.01, ***p < =0.001). c, Representative scatter plots showing the correlation analysis of the logFC between xenotransplanted and single nuclei post-mortem microglia. The labels are coloured by cell state as in Fig. 1.
Extended Data Fig. 9
Extended Data Fig. 9. Extended analysis of the impact of clinical mutations on microglial cell states.
a, b, Volcano plots showing a paired comparison between TREM2R47H and TREM2-WT microglia transplanted in AppNL-G-F mice and coloured by (a) cells genotype or (b) cluster as in Fig. 1a. The number of significant genes per condition is reported in brackets in the legend (Log2 Fold-Change threshold > 0.1). Adjusted p-value threshold < 0.05 (Wilcoxon rank-sum test, P-values adjusted with Bonferroni correction based on the total number of genes in the dataset, ns = not significant). c, d, Distribution of TREM2R47H and TREM2-WT cells across (c) DAM-HLA and (d) CRM transcriptional trajectories. Note the shift in transcriptional states in both the DAM-HLA and CRM axes (each dot represents a single cell, n = 2 (3,282 cells) H9-WT, n = 3 (5,845 cells) H9-TREM2R47H). e, f, Volcano plots showing a paired comparison between APOE4/4 and APOE3/3 microglia transplanted in AppNL-G-F mice and coloured by (e) cells genotype or (f) cluster as in Fig. 1a. The number of significant genes per condition is reported in brackets in the legend (Log2 Fold-Change threshold > 0.1). Adjusted p-value threshold < 0.05 (Wilcoxon rank-sum test, P-values adjusted with Bonferroni correction based on the total number of genes in the dataset, ns = not significant). g, h, Distribution of APOE4 and APOE3 cells across (g) DAM and HLA and (h) CRM transcriptional trajectories (each dot represents a single mouse, n = 6 (7,894 cells) for APOE3/3, n = 6 (10,151 cells) for APO4/4). i, Distribution and proportion of cells across all identified clusters as in Fig. 5e, coloured by the microglial APOE genotype (each dot represents a single mouse, n = 7 for Scr, n = 13 Aβο). Box plots in c, d, g, h and i, are limited by lower and upper quartiles and midline indicates median; whiskers show minimum to maximum value (i) or extend from the box to the smallest or largest value no further than 1.5*inter-quartile range (c, d, g and h). Unpaired t-test with Welch’s correction, two-tailed, alpha = 0.05, significance was set as P-value < 0.05.
Extended Data Fig. 10
Extended Data Fig. 10. Extended analysis of GWAS genes enrichment in xenotransplanted microglia.
a, Summary heatmap with the expression levels of the Top10 marker genes for each cluster (as in Fig. 1c), compared across all experimental groups used in this study. b, Expanded gene list with the canonical AD genes according to the latest GWAS study of Fig. 8a, with the addition of other genes of interest, that is the genes selected in our previous publication (see Supplementary Table 4 for the complete list). Raw counts (log scale) are reported on the x axis, while standard deviation of counts is shown on the y-axis. Dots are coloured by SCT-normalised expression (see Methods) and size reflects percentage of cells in our dataset where the gene is detected (see all values in Supplementary Table 4). All genes from (a) that are significantly changing in at least one of the tested conditions in this manuscript are reported in an extended heat map build as in Fig. 8a. The black bars represent the number of cells (in thousands) with detectable expression (>=1 read per cell) for each candidate gene. The heat map summarizes the deregulated expression (LogFC, colour scale) of these genes across cell states (each cluster compared to all others), as well as after exposure to amyloid-β plaque pathology, upon injection of soluble aggregates of Aβ, or altering the genetic background of the mice or the transplanted cells. The genes are ranked in rows based on hierarchical clustering. We identify 3 sets of genes that display a common profile across cell states (based on their enrichment in the specific microglial phenotypic transcriptional states HM, DAM and HLA, and CRM), amyloid-β pathology and genetic risk, and we group these profiles as: microglia Homeostasis, plaque-induced genes, and soluble aggregates-induced genes. The remaining genes did not show a clear enrichment in cell states or other conditions. All differential expressions were significant after adjusting P-values using Bonferroni correction (FDR < 0.05).

References

    1. Sierksma A, Escott-Price V, De Strooper B. Translating genetic risk of Alzheimer’s disease into mechanistic insight and drug targets. Science. 2020;370:61–66. doi: 10.1126/science.abb8575. - DOI - PubMed
    1. Song WM, Colonna M. The identity and function of microglia in neurodegeneration. Nat. Immunol. 2018;19:1048–1058. doi: 10.1038/s41590-018-0212-1. - DOI - PubMed
    1. Sala Frigerio C, et al. The major risk factors for Alzheimer’s disease: age, sex, and genes modulate the microglia response to Aβ plaques. Cell Rep. 2019;27:1293–1306.e6. doi: 10.1016/j.celrep.2019.03.099. - DOI - PMC - PubMed
    1. Keren-Shaul H, et al. A unique microglia type associated with restricting development of Alzheimer’s disease. Cell. 2017;169:1276–1290.e17. doi: 10.1016/j.cell.2017.05.018. - DOI - PubMed
    1. Krasemann S, et al. The TREM2-APOE pathway drives the transcriptional phenotype of dysfunctional microglia in neurodegenerative diseases. Immunity. 2017;47:566–581.e9. doi: 10.1016/j.immuni.2017.08.008. - DOI - PMC - PubMed

Publication types

MeSH terms